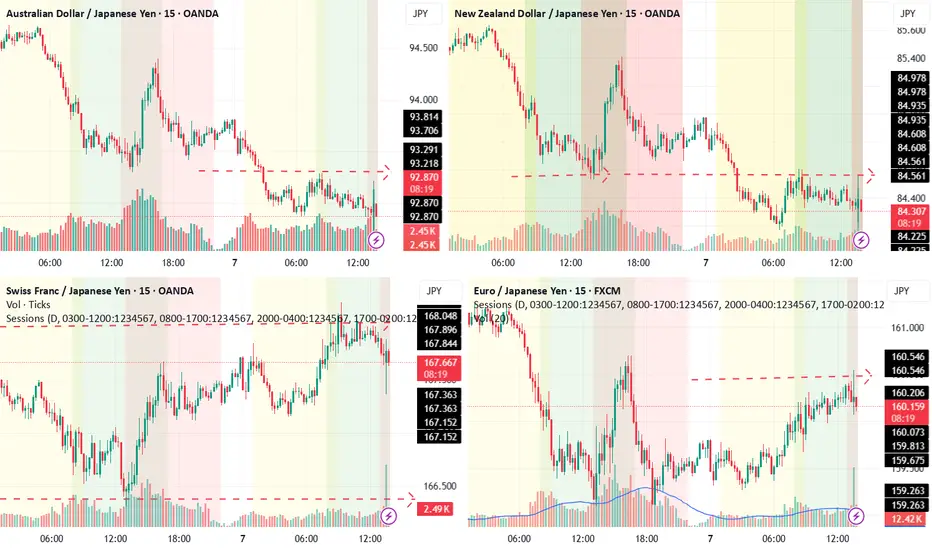
bearish thesis for the week for NZD/JPYBased on my projections of my watchlist a range of 83 pips must be honored within this week ,
(Range projection based on last 5 yrs)
as BoJ is increasing rates by 0.5%
And
Japan accounts for 6.3% of NZD total exports
therefore widening rate gap nzd/jpy faces downward pressure
and taking TA into perspective , we can take advantage by selling for exactly 0.12% or 83 pips.
NZDJPY trade ideas

nzdjpy longaccording to cot reports nzd has reached over sold range and jpy is in the over bought range.

NZDJPY IN BULLISH TRENDTechnically:
NZDJPY printing bullish divergence
NZDJPY break lower high
NZDJPY printing its higher high and retracement level

NZDJPY- Bullish ReversalNZDJPY has made a bullish divergence at the 4-H time frame and broke a previous LH. Look for buy opportunities around the current price levels.

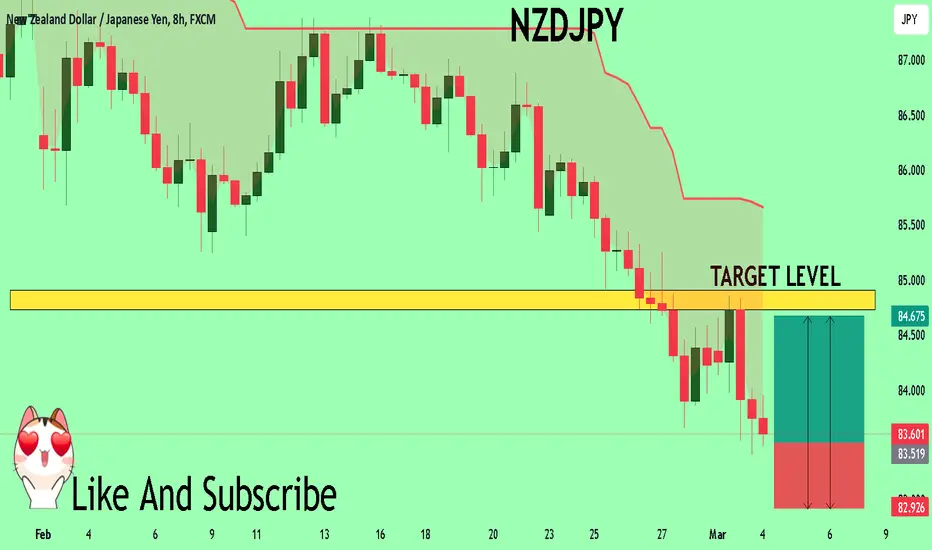
NZDJPY - 2025 Plan. Make It Your Best Year Yet!Here we have the 2 Day chart for NZDJPY.
We've seen a massive impulse mid 2024. We are now in an ABC correction.
We are currently in wave B of the correction, subwave B. Expecting subwave C to complete wave B.
We're looking for a rejection of the fib zone and a drop of over 700pips.
Trade idea:
- Watch for rejection of fib zone
- Once rejection appears, enter with stops above the highs
- Targets: 86 (350pips), 83 (700pips)
Once we've completed this move down, we'll be looking for longs. We'll update this setup if there's enough engagement.
Goodluck and as always, trade safe!


NZDJPY BUY Long Trading IdeaHello Traders
In This Chart NZDJPY HOURLY Forex Forecast By FOREX PLANET
today NZDJPY analysis 👆
🟢This Chart includes_ (NZDJPY market update)
🟢What is The Next Opportunity on NZDJPY Market
🟢how to Enter to the Valid Entry With Assurance Profit
This CHART is For Trader's that Want to Improve Their Technical Analysis Skills and Their Trading By Understanding How To Analyze The Market Using Multiple Timeframes and Understanding The Bigger Picture on the Charts

NZD/JPY BULLISH BIAS RIGHT NOW| LONG
Hello, Friends!
We are now examining the NZD/JPY pair and we can see that the pair is going down locally while also being in a downtrend on the 1W TF. But there is also a powerful signal from the BB lower band being nearby indicating that the pair is oversold so we can go long from the support line below and a target at 85.520 level.
✅LIKE AND COMMENT MY IDEAS✅

strong JPY (Short Signal )As the correlation is saying strong JPY ,thats mean any currency Like AUDJPY ,NZDJPY ,EURJPY can go down.
NZD/JPY: Strong Bearish Formation📉 NZD/JPY has formed a well-defined head and shoulders pattern at a key daily/intraday resistance level.
A bearish breakout below the horizontal neckline signals strong selling pressure, reinforcing a bearish outlook.
The pair is likely to extend its decline, with a potential target of at least 83.83.

NZDJPY POSSIBLE SELL OPPORTUNITY Price just broke below a pullback support price of 84.661 a sell opportunity is envisaged from the current market price. The overall trend for the market remains bearish .

NZDJPY: Very Bearish Pattern📉NZDJPY formed a cute head & shoulders pattern on a key daily/Intraday horizontal resistance.
A bearish breakout below the horizontal neckline indicates strong selling pressure and is a powerful bearish signal.
It is likely that the pair will continue to decline and potentially reach a level of at least 83.83.

NZDJPY: Bearish Continuation 🇳🇿🇯🇵
NZDJPY formed a huge head & shoulders pattern after a test
of a key daily resistance.
Its neckline violation is a strong bearish trend-following signal.
I think that the market will continue falling.
Next support - 84.0
❤️Please, support my work with like, thank you!❤️

nzdjpy sell tradeThe Relative Strength Index (RSI) is showing a downward trend, indicating weakening momentum. Additionally, the Moving Average Convergence Divergence (MACD) is showing a bearish crossover, further supporting the potential for a downward move

NZDJPY Sellers In Panic! BUY!
My dear friends,
Please, find my technical outlook for NZDJPY below:
The instrument tests an important psychological level 83.544
Bias - Bullish
Technical Indicators: Supper Trend gives a precise Bullish signal, while Pivot Point HL predicts price changes and potential reversals in the market.
Target - 84.727
Recommended Stop Loss - 82.926
About Used Indicators:
Super-trend indicator is more useful in trending markets where there are clear uptrends and downtrends in price.
———————————
WISH YOU ALL LUCK
NZDJPY potential sell Love how this setup looks on the 4h. I'm waiting for price to pullback then I'll be looking for sells

Potential bullish rise?NZD/JPY has reacted off the pivot and could rise to the 1st resistance.
Pivot: 84.75
1st Support: 83.78
1st Resistance: 86.37
Risk Warning:
Trading Forex and CFDs carries a high level of risk to your capital and you should only trade with money you can afford to lose. Trading Forex and CFDs may not be suitable for all investors, so please ensure that you fully understand the risks involved and seek independent advice if necessary.
Disclaimer:
The above opinions given constitute general market commentary, and do not constitute the opinion or advice of IC Markets or any form of personal or investment advice.
Any opinions, news, research, analyses, prices, other information, or links to third-party sites contained on this website are provided on an "as-is" basis, are intended only to be informative, is not an advice nor a recommendation, nor research, or a record of our trading prices, or an offer of, or solicitation for a transaction in any financial instrument and thus should not be treated as such. The information provided does not involve any specific investment objectives, financial situation and needs of any specific person who may receive it. Please be aware, that past performance is not a reliable indicator of future performance and/or results. Past Performance or Forward-looking scenarios based upon the reasonable beliefs of the third-party provider are not a guarantee of future performance. Actual results may differ materially from those anticipated in forward-looking or past performance statements. IC Markets makes no representation or warranty and assumes no liability as to the accuracy or completeness of the information provided, nor any loss arising from any investment based on a recommendation, forecast or any information supplied by any third-party.

Potential bullish rise?NZD/JPY has bounced off the support level which is a pullback support and could rise from this level to ur take profit.
Entry: 84.77
Why we like it:
There is a pullback support level.
Stop loss: 83.82
Why we like it:
There is a pullback support level.
Take profit: 86.35
Why we like it:
There is a pullback resistance level that is slightly above the 78.6% Fibonacci retracement.
Enjoying your TradingView experience? Review us!
Please be advised that the information presented on TradingView is provided to Vantage (‘Vantage Global Limited’, ‘we’) by a third-party provider (‘Everest Fortune Group’). Please be reminded that you are solely responsible for the trading decisions on your account. There is a very high degree of risk involved in trading. Any information and/or content is intended entirely for research, educational and informational purposes only and does not constitute investment or consultation advice or investment strategy. The information is not tailored to the investment needs of any specific person and therefore does not involve a consideration of any of the investment objectives, financial situation or needs of any viewer that may receive it. Kindly also note that past performance is not a reliable indicator of future results. Actual results may differ materially from those anticipated in forward-looking or past performance statements. We assume no liability as to the accuracy or completeness of any of the information and/or content provided herein and the Company cannot be held responsible for any omission, mistake nor for any loss or damage including without limitation to any loss of profit which may arise from reliance on any information supplied by Everest Fortune Group.

buy NZDJPYLooks like the JPY pairs are finally making that move up. you can buy NZD or AUDJPY, both look good for the R:R ratio.

NZD/JPY Buy Setup: Potential Reversal Near Key SupportNZDJPY - Buy Setup
Technical: The overall trend remains bearish, but the price has stalled just below the major 83.06 support level, last seen in August 2024. This could attract buying interest. On the daily chart, a bullish reversal formed on March 4, 2025, suggesting a potential short-term bottom.
Fundamental: The latest Commitment of Traders Report shows increasing New Zealand Dollar long interest, while Japanese Yen interest is declining. This indicates that "Smart Money" may be accumulating NZD.
Seasonal: Historically, between March 7 – April 13, NZD/JPY has performed well, producing positive returns 61.1% of the time, with an average gain of 1.47% over the past 36 years.
Setup:
Entry: 84.43 – 83.97
Stop Loss: 82.83 (below the 2024 low at 83.06)
Target: 87.80 (50% retracement)
Disclosure: I am part of Trade Nation's Influencer program and receive a monthly fee for using their TradingView charts in my analysis.

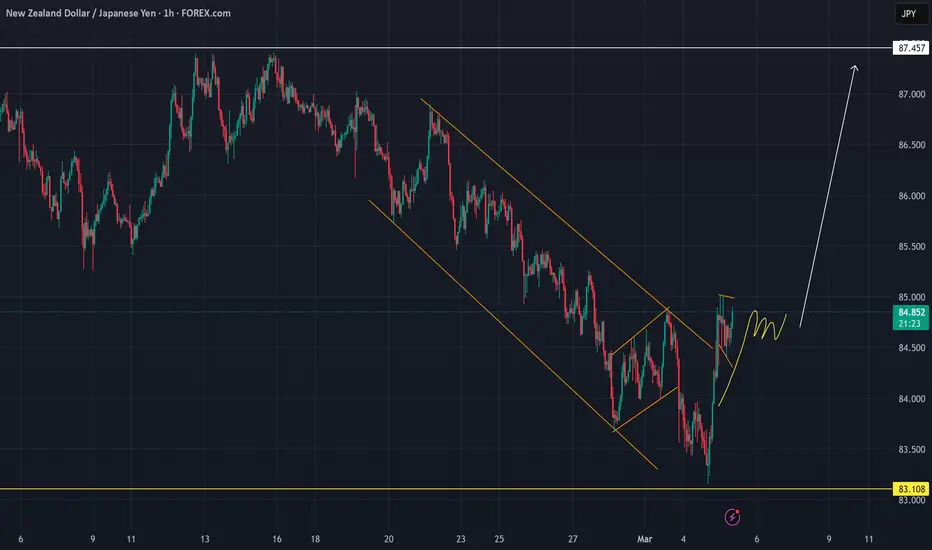
POTENTIAL LONG TRADE SET UP FOR NZDJPYAnalysis: Utilizing chart patterns, highs & lows, and impulses & corrections, the focus is on identifying a continuation corrective structure following a breakout.
The price has approached a previous swing low zone on the higher time frame (HTF) while moving within a descending structure on the MTF. The price has broken out of the MTF descending structure and we will now monitor for a continuation structure to identify a potential entry point for the trade.
Expectation: A upward move is expected.
⚠️ Reminder: Always conduct your own analysis and apply proper risk management, as forex trading involves no guarantees. This is a high-risk activity, and past performance is not indicative of future results. Trade responsibly!
Heading into resistance?NZD/JPY is rising towards the pivot and could reverse to the 1st support.
Pivot: 85.23
1st Support: 83.78
1st Resistance: 85.70
Risk Warning:
Trading Forex and CFDs carries a high level of risk to your capital and you should only trade with money you can afford to lose. Trading Forex and CFDs may not be suitable for all investors, so please ensure that you fully understand the risks involved and seek independent advice if necessary.
Disclaimer:
The above opinions given constitute general market commentary, and do not constitute the opinion or advice of IC Markets or any form of personal or investment advice.
Any opinions, news, research, analyses, prices, other information, or links to third-party sites contained on this website are provided on an "as-is" basis, are intended only to be informative, is not an advice nor a recommendation, nor research, or a record of our trading prices, or an offer of, or solicitation for a transaction in any financial instrument and thus should not be treated as such. The information provided does not involve any specific investment objectives, financial situation and needs of any specific person who may receive it. Please be aware, that past performance is not a reliable indicator of future performance and/or results. Past Performance or Forward-looking scenarios based upon the reasonable beliefs of the third-party provider are not a guarantee of future performance. Actual results may differ materially from those anticipated in forward-looking or past performance statements. IC Markets makes no representation or warranty and assumes no liability as to the accuracy or completeness of the information provided, nor any loss arising from any investment based on a recommendation, forecast or any information supplied by any third-party.

NZDJPY Wave Analysis – 4 March 2025
- NZDJPY reversed from long-term support level 83.15
- Likely to rise to resistance level 85.00
NZDJPY currency pair today reversed up exactly from the long-term support level 83.15 (which stopped the sharp downtrend at the start of August of 2024 as can be seen below), standing near the lower daily Bollinger Band.
The upward reversal from this support zone will form the daily Japanese candlesticks reversal pattern Hammer – if the pair closes today near the current levels.
Given the proximity of the strong support level 83.15 and the oversold daily Stochastic, NZDJPY currency pair can be expected to rise to the next resistance level 85.00, former support from the start of February.
