NZD/JPY SHORTNZD/JPY SHORT " break of a resistance area and retest it + 50 ema dynamic support + 50% fib retracement + risk on environment"
NZDJPY trade ideas


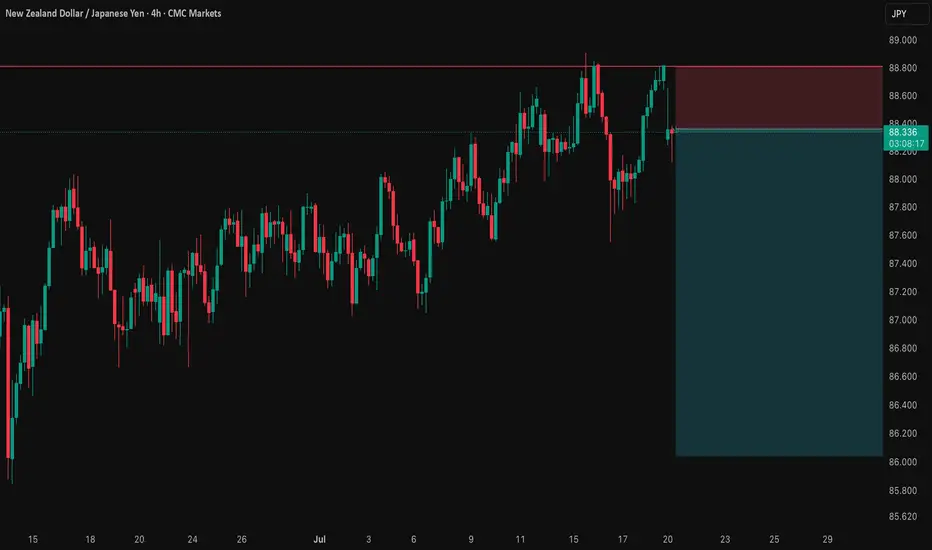
NZD/JPY: A Data-Driven Short SignalBefore I post a trade, I put it through a rigorous, multi-step analysis. Here’s exactly what I did for this NZD/JPY setup to build a data-driven case.
I Started with the 'Why': The Fundamental Story 📰
First, I identified the powerful divergence between the dovish RBNZ and the hawkish BoJ. This gave me my core bearish thesis for the pair.
I Challenged My Idea with Data: The Stress Test 🧠
A good story isn't enough. So, I ran this bearish idea through my mathematical models . My goal was to find any hidden risks and see if the hard data supported my fundamental view.
What My Analysis Revealed: A Warning and a Confirmation ⚠️
The data came back with two critical insights:
Confirmation: The models strongly validated the bearish direction with a high degree of mathematical probability.
Warning: They exposed a hidden danger—a standard entry had a very high probability of getting stopped out in the current market.
I Engineered the Solution: The Optimized Plan 🛠️
This is the most important step. I used these data insights to build a new trade plan from the ground up. The entry, stop loss, and take profit below are not guesses; they are the output of my analysis, specifically designed to navigate the risk the data uncovered.
The result is a trade with a huge 5.15-to-1 Risk-to-Reward ratio , where my fundamental view is now backed by a data-driven execution strategy. Let's get into it. 👇
The Complete Trade Plan
Strategy & Trade Parameters ✅
📉 Pair: NZD/JPY
👉 Direction: Short
⛔️ Entry: 88.35800
🎯 Take Profit: 86.04347
🛡️ Stop Loss: 88.80723
⚖️ Risk-Reward: 5.15
This setup represents my ideal trading approach: forming a strong fundamental thesis and then using disciplined, mathematical analysis to define the execution. The result is a plan where the direction is clear and the risk is precisely managed. Trade safe.
NZD-JPY Local Short! Sell!
Hello,Traders!
NZD-JPY has hit a horizontal
Resistance level of 88.851
And we are already seeing
A bearish reaction so we will
Be expecting a local
Bearish move down
On Monday!
Sell!
Comment and subscribe to help us grow!
Check out other forecasts below too!
Disclosure: I am part of Trade Nation's Influencer program and receive a monthly fee for using their TradingView charts in my analysis.

An arbitrage chance: NZ Dollar goes down & JP Yen goes upDue to economies trends and currency policies, USDJPY is going down in a long term (3 to 5 years) and NZDUSD is also going down in the next 3 years
Except for trend following trade for these 2 pairs, you can also set buy limit at the bottom of a value box for NZDJPY and sell limit at the top boarder of this box. Will take good P/L and good win rate positions for this crosspairs


NZD/JPY – 4H Technical and Fundamental AnalysisNZD/JPY – 4H Technical and Fundamental Analysis
NZD/JPY remains supported fundamentally by a hawkish stance from the Reserve Bank of New Zealand, which recently held rates at 5.50%, emphasizing ongoing caution around inflation. This tone continues to favor NZD strength in the short to medium term.
Adding to that, seasonal trends also support bullish momentum July and August have historically been weak for the Japanese yen and relatively strong for the New Zealand dollar, aligning with the current upside bias.
On our Technical Side
NZD/JPY recently broke above a minor key resistance at 87.900, following a multi-week period of consolidation. This breakout signaled renewed buyer interest and a potential shift into a bullish continuation phase.
After the breakout, price entered a clear accumulation zone, where early buyers positioned themselves just above support. However, smart money triggered a stop-loss hunt below 87.900, targeting liquidity trapped beneath that key level.
This liquidity grab formed a Clear liquidity within the liquidity zone, creating a cleaner setup for long opportunities. Price is now heading back toward the previous resistance now flipped into a key support level.
📍 Buy Limit Setup:
Buy Limit Entry: 88.030
Stop Loss: 87.570 (below liquidity zone)
Take Profit: 89.250 (next minor resistance zone)
📌 Disclaimer:
This is not financial advice. Always wait for proper confirmation before executing trades. Manage risk wisely and trade what you see—not what you feel.

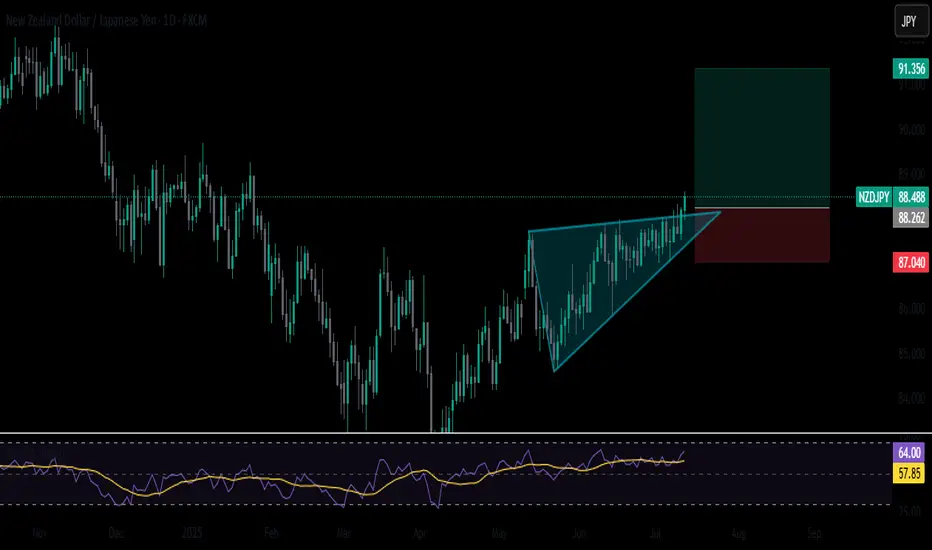
NZDJPY Breakout: Bulls take charge above key resistanceNZDJPY has broken out of a textbook ascending triangle on the daily time frame, signaling strong bullish momentum. Price is pushing higher with a solid structure and supportive RSI levels, leaving room for continuation. A breakout retest can offer a high-probability entry.
NZDJPY Strong Breakout!
HI,Traders !
NZDJPY is trading in an
Uptrend and the pair has
Made a bullish breakout of
The key horizontal level
Of 87.394 and the breakout
Is confirmed so we are
Bullish biased and we
Will be expecting a further
Bullish move up !
Comment and subscribe to help us grow !

NZDJPY SELLDetailed NZD JPY forecast as well as a New Zealand Dollar Japanese Yen technical analysis through moving averages, buy/sell signals, and common chart
NZDJPY Bullish IdeaWaiting for an confirmation on our POI, to go longer.
NB: Trade should be executed only after confirmation of all of our criteria.
NZDJPY Long Setup: Institutional Flow Signals Upside to 89.690🗓 Seasonal Outlook
- JPY Seasonal Weakness: Historical trends show July and August tend to be bearish months for the Japanese Yen, reinforcing weakness across JPY pairs.
- NZD Seasonal Strength: July typically supports bullish momentum for NZD, while August may present challenges. However, strength in NZD versus relative JPY softness suggests continued upside potential into early August.
💼 Institutional Positioning (COT Analysis)
- JPY: Commercial traders remain net short, suggesting expectations of further depreciation.
- NZD: Also shows commercial net shorts, yet the price structure aligns more with bullish continuation, hinting at speculative flow favoring NZD upside.
🧠 Technical Analysis
- Liquidity Dynamics:
- Price has cleared multiple buy-side liquidity levels near prior swing highs.
- Sell-side zones continue to hold, indicating strong bullish intent and failed bearish follow-through.
- Market Structure:
- Higher lows and sustained bullish reactions post-liquidity sweeps reinforce an upward trajectory.
- Current structure suggests accumulation and breakout patterns toward the proposed target.
🎯 Target Projection: 89.690

NZDJPY to find buyers at previous support?NZDJPY - 24h expiry
The primary trend remains bullish.
Short term RSI is moving lower.
Preferred trade is to buy on dips.
Risk/Reward would be poor to call a buy from current levels.
Bespoke support is located at 87.50.
We look to Buy at 87.50 (stop at 87.30)
Our profit targets will be 88.30 and 88.50
Resistance: 88.00 / 88.30 / 88.50
Support: 87.50 / 87.20 / 87.00
Risk Disclaimer
The trade ideas beyond this page are for informational purposes only and do not constitute investment advice or a solicitation to trade. This information is provided by Signal Centre, a third-party unaffiliated with OANDA, and is intended for general circulation only. OANDA does not guarantee the accuracy of this information and assumes no responsibilities for the information provided by the third party. The information does not take into account the specific investment objectives, financial situation, or particular needs of any particular person. You should take into account your specific investment objectives, financial situation, and particular needs before making a commitment to trade, including seeking advice from an independent financial adviser regarding the suitability of the investment, under a separate engagement, as you deem fit.
You accept that you assume all risks in independently viewing the contents and selecting a chosen strategy.
Where the research is distributed in Singapore to a person who is not an Accredited Investor, Expert Investor or an Institutional Investor, Oanda Asia Pacific Pte Ltd (“OAP“) accepts legal responsibility for the contents of the report to such persons only to the extent required by law. Singapore customers should contact OAP at 6579 8289 for matters arising from, or in connection with, the information/research distributed.

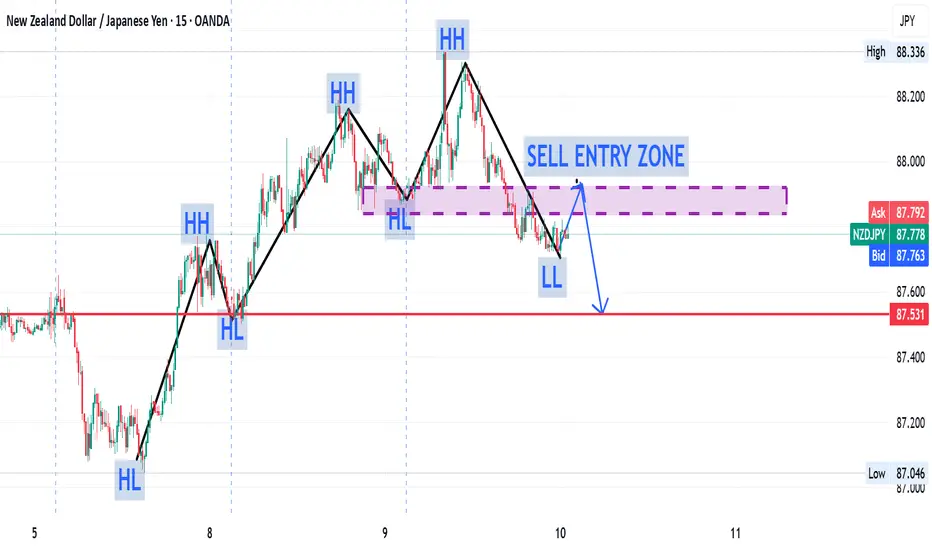
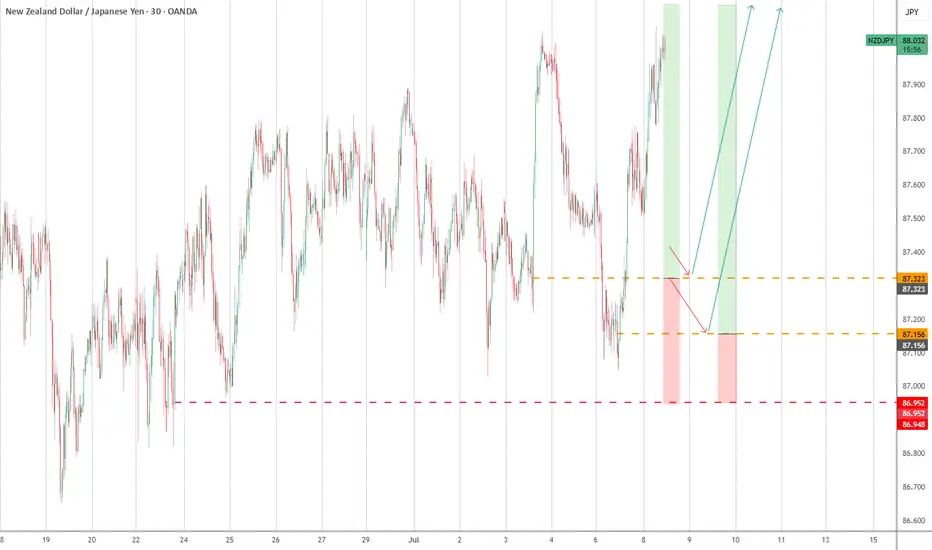
Lower time frame opportunity on nzdjpymeanwhile, while we wait for a pullback to the higher timeframe fib level for a vuy trade, we seem to be have a setup for a sell trade. to follow the market down towards our higher timeframe fib level.
if all turns out right, we can sell into our higher time frame fib level and then buy upward
lets see how the market unfolds

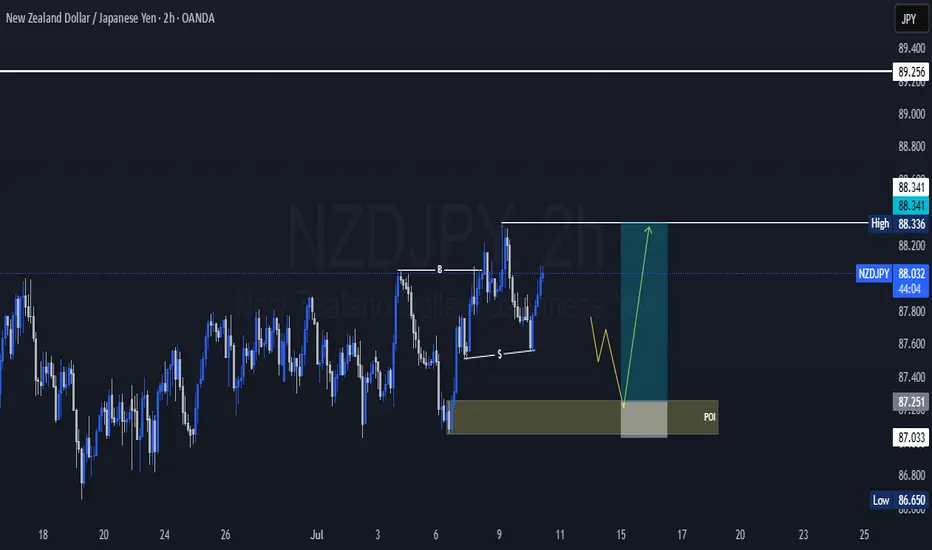
NZDJPY TRADE IDEANzdjpy also seems to be in an upward motion. lets see how it plays out, as we await a pullback to our fib level to the the trade to the upside.
its now a waiting game.
Trade can be taken and managed properly using the parameters shown in the image above.
please, this is no financial advice

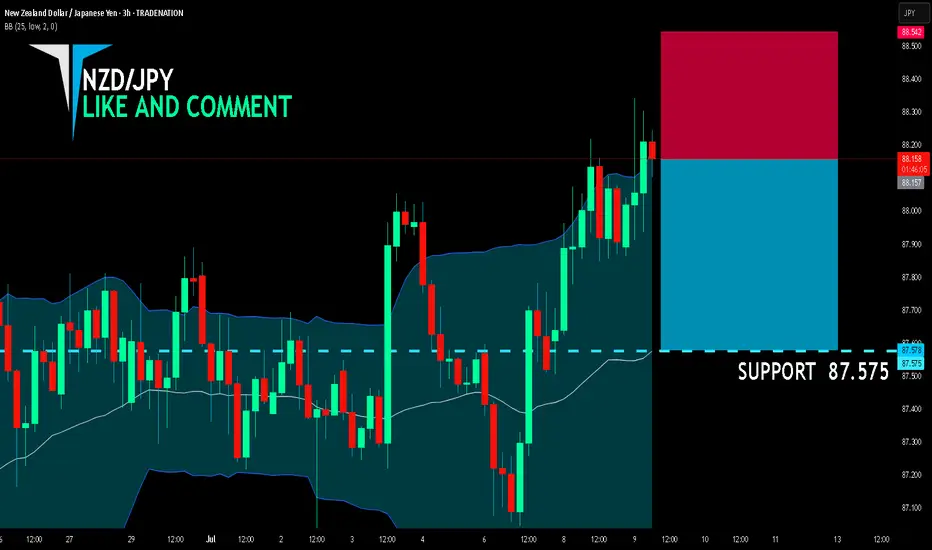
NZD/JPY BEARS ARE STRONG HERE|SHORT
NZD/JPY SIGNAL
Trade Direction: short
Entry Level: 88.157
Target Level: 87.575
Stop Loss: 88.542
RISK PROFILE
Risk level: medium
Suggested risk: 1%
Timeframe: 3h
Disclosure: I am part of Trade Nation's Influencer program and receive a monthly fee for using their TradingView charts in my analysis.
✅LIKE AND COMMENT MY IDEAS✅
selling opportunity from resistance level-ForexbdNZDJPY is at a price resistance level in the H-4 market, so it is expected that the market will go into a downtrend from this level.
You can share your opinion.
⭕️Risk Warning : Trading on financial markets carries risks!
©FXBD Official Team

nzdjpy📈 The trend is clearly bullish, with the week starting strong and Friday closing above the 22-period daily moving average.
Now it’s just a matter of waiting for a correction to enter at a more interesting price zone. Personally, I believe the price has a high probability of visiting the two marked areas — roughly a 75% and 60% chance, respectively.
If you're looking to manage a tighter stop-loss and aim for a risk-to-reward ratio around 1:5, this setup could be for you. 🔍
⚠️ Always remember: risk no more than 0.5% of your account per trade.
#NZDJPY #SwingTrade #Forex #RiskManagement #TradingView
NZDJPY - bulls are exhausted! Hello TradingView Family / Fellow Traders. This is Richard, also known as theSignalyst.
📈NZDJPY has been overall bullish trading within the rising flat channel marked in blue and it is currently retesting the upper bound of it.
Moreover, the green zone is a strong structure.
🏹 Thus, the highlighted red circle is a strong area to look for sell setups as it is the intersection of the upper blue trendline and green structure.
📚 As per my trading style:
As #NZDJPY is hovering around the red circle zone, I will be looking for bearish reversal setups (like a double top pattern, trendline break , and so on...)
📚 Always follow your trading plan regarding entry, risk management, and trade management.
Good luck!
All Strategies Are Good; If Managed Properly!
~Rich
Disclosure: I am part of Trade Nation's Influencer program and receive a monthly fee for using their TradingView charts in my analysis.

"Great selling opportunity"Hello. As you can see in the chart, the price is ready for a strong downward move. The stop loss and take profit levels are clearly defined. Enjoy it!

NZD/JPY: Bearish Wedge Before RBNZ CatalystThis is a high-conviction trade idea for NZD/JPY , where a perfect storm of technical and fundamental factors is aligning for a significant short opportunity. The setup is clean, the reasoning is strong, and we have a clear catalyst on the horizon. 🚀
Fundamental Analysis 🌪️
The macro picture is the primary driver here, creating a powerful bearish case.
1️⃣ Monetary Policy Divergence (🇳🇿 vs 🇯🇵): This is the core engine of the trade. The Reserve Bank of New Zealand (RBNZ) is dovish, signaling rate cuts amid a fragile domestic economy. In stark contrast, the Bank of Japan (BoJ) is hawkish, having started a historic policy normalization to combat persistent inflation. This fundamental clash is strongly bearish for NZD/JPY.
2️⃣ Risk-Off Catalyst (🇺🇸): The market is nervous ahead of the July 9th US tariff deadline . This uncertainty is creating a classic "risk-off" environment, which typically strengthens the safe-haven JPY and weakens risk-sensitive currencies like the NZD.
3️⃣ The RBNZ Decision (🏦): The main event on July 9. The market expects a "dovish hold," meaning even if rates are unchanged, the forward guidance will likely be very cautious, highlighting economic risks and signaling future cuts. This is the catalyst that could trigger the sell-off.
Technical Analysis 📉
The 4H chart provides crystal-clear confirmation of the fundamental weakness.
1️⃣ Bearish Rising Wedge: Price is being squeezed into a classic bearish reversal pattern. This shows that buying pressure is exhausted, and the market is preparing for a move to the downside.
2️⃣ Key Resistance Zone: The wedge is pushing directly into a heavy supply zone between 87.80 and 88.00 . This area has acted as a firm brick wall 🧱, rejecting multiple attempts to move higher.
3️⃣ RSI Momentum: The RSI below the chart confirms the weakening momentum. It's failing to show strong bullish power, which supports the price action and signals that the uptrend is running out of steam. 💨
The Trade Plan 🎯
Based on this analysis, the plan is to enter with a limit order to get an optimal entry price on a potential final spike into resistance.
Direction: Short (Sell) 📉
Order Type: Limit Sell
Entry: 87.80 📍
Stop Loss: 88.40 🛡️
Take Profit: 86.00 💰
Risk/Reward Ratio: 1:3 ⭐⭐⭐
This setup presents a rare confluence of fundamental divergence, technical weakness, and a clear catalyst.
Trade safe and manage your risk.


Buy NZDJPY Buy Opportunities on NZDJPY
ENTRY: 87.100
STOPLOSS: 86.900
TAKE PROFIT: 88.00
COMMENT YOUR OPINION
For fund management contact me on X @shajudeakinoba1
