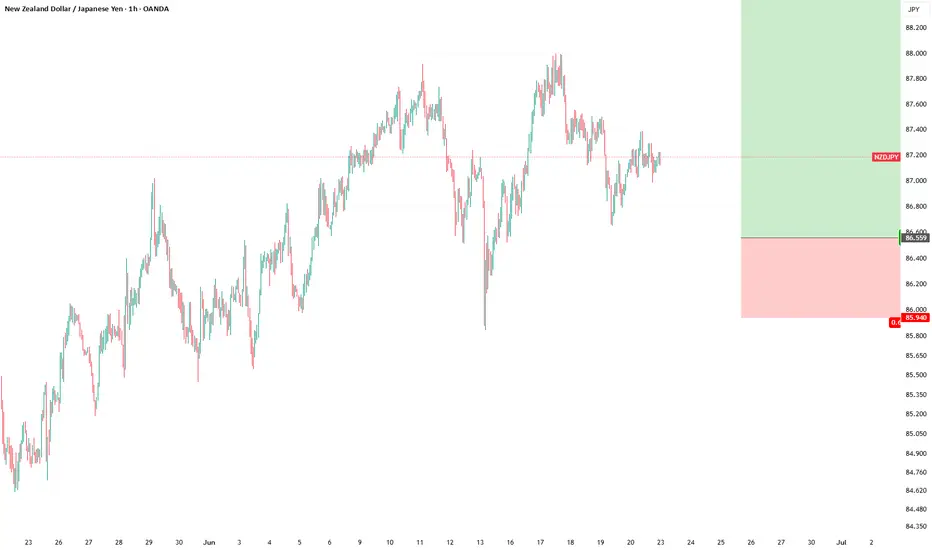
NZD/JPY - Triangle Breakout (23.06.2025)The NZD/JPY Pair on the H1 timeframe presents a Potential Selling Opportunity due to a recent Formation of a Triangle Breakout Pattern. This suggests a shift in momentum towards the downside in the coming hours.
Possible Short Trade:
Entry: Consider Entering A Short Position around Trendline Of The Pattern.
Target Levels:
1st Support – 86.35
2nd Support – 86.00
🎁 Please hit the like button and
🎁 Leave a comment to support for My Post !
Your likes and comments are incredibly motivating and will encourage me to share more analysis with you.
Best Regards, KABHI_TA_TRADING
Thank you.
Disclosure: I am part of Trade Nation's Influencer program and receive a monthly fee for using their TradingView charts in my analysis.
NZDJPY trade ideas

NZDJPY looks ready to breakoutThe area around 87.65 has been a solid resistance since early Feb. Time and again, price has been rejected there and recently the lows have become higher. The squeeze is on and I sense that another attempt to break out above will happen soon.
Will it succeed? I have no idea, we never do. But if there is a breakout and then a retest, I'll take the trade and take this as high as I can (within the limits of my discipline and patience) :)
This is not a trade recommendation; it’s merely my own analysis. Trading carries a high level of risk so carefully managing your capital and risk is important. If you like my idea, please give a “boost” and follow me to get even more.
It’s not whether you are right or wrong, but how much money you make when you are right and how much you lose when you are wrong – George Soros

NZD/JPY BEARS WILL DOMINATE THE MARKET|SHORT
NZD/JPY SIGNAL
Trade Direction: short
Entry Level: 87.077
Target Level: 84.490
Stop Loss: 88.805
RISK PROFILE
Risk level: medium
Suggested risk: 1%
Timeframe: 1D
Disclosure: I am part of Trade Nation's Influencer program and receive a monthly fee for using their TradingView charts in my analysis.
✅LIKE AND COMMENT MY IDEAS✅

Trade Idea: Long NZD/JPY (Short-Term Only) **📈 Trade Idea: Long NZD/JPY (Short-Term Only)**
**Bias:** 🎯 Slightly Bullish
**Timeframe:** 🕒 Short-Term (cautious entry)
**Key Zone:** Needs to stay above 94.50 — upside may fade around 96.00
---
### **💡 Why Consider NZD/JPY Long?**
**🇳🇿 New Zealand Dollar (NZD):**
* **Risk sentiment weak, China demand fading**
→ *🌧️ Not a strong backdrop — Kiwi is under pressure globally.*
* **RBNZ cut rates to 3.25%**
→ *🔻 Dovish tone continues. Market expecting more easing.*
* **GDP due June 23 — big wildcard**
→ *📅 Until then, NZD is stuck in limbo. Surprise = upside, disappointment = selloff.*
* **Dairy prices, China links still weighing**
→ *🐄🇨🇳 Old story, still relevant. No new tailwinds for the Kiwi.*
* **Overall sentiment: Bearish**
→ *📉 Most traders are expecting softer NZD data ahead.*
---
**🇯🇵 Japanese Yen (JPY):**
* **Supported by risk-off flows**
→ *🛡️ Investors run to JPY in fear — gives it short-term strength.*
* **BoJ still ultra-dovish**
→ *🎈 Monetary policy is soft. No tightening expected till late 2025.*
* **CPI is above target, but BoJ not reacting**
→ *📊 Data says tighten, but BoJ says no. That caps JPY strength.*
* **Risk-sensitive, but also used for funding**
→ *💸 Weak long-term, but can pop on fear-driven trades.*
---
### **🔍 Outlook:**
There’s a short-term case for upside **if** risk calms and NZ GDP surprises. But the bigger picture isn’t great — both currencies are weak for different reasons, and this pair is stuck between them.
---
**📌 Note:**
> *“Not a trade I’d take myself — feels like trying to pick a winner in a race where both runners are limping. If anything, this is a 'maybe-for-a-day' type of setup, not something I’d hold.”*
NZDJPY “Kiwi Poised to Fly as Japan Muddles ThroughNZDJPY shows a bullish breakout from a descending trendline, with bullish structure holding near 87.20–87.25.
Key resistance targets:
87.97 (Previous high)
88.64 (Next resistance / projected fib target)
Two upside scenarios are shown:
Conservative target: ~87.97
Aggressive swing: ~88.64
If 87.00–87.20 zone holds as support, expect bullish continuation.
🧩 Current Bias: Bullish
📌 Key Fundamentals Driving NZDJPY
NZD Side (Strengthening):
RBNZ hawkish hold: RBNZ recently kept rates at 5.50% and warned that inflation remains persistent, requiring prolonged tight policy.
Resilient NZ GDP: Stronger-than-expected GDP print signals economic resilience.
Terms of trade improvement: Commodity exports holding firm, China consumption rebound showing hints of demand recovery (see recent 618 festival sales data).
AUD correlation: AUD and NZD are moving together; if AUD strengthens, NZD often follows.
JPY Side (Weakening):
BoJ remains ultra-dovish: Despite inflation trends, BoJ is hesitant to tighten further, preferring gradual tapering.
Yen under pressure from yield differentials: Global central banks (like RBNZ, Fed) remain hawkish while BoJ is not.
Geopolitical funding flows: JPY used as a funding currency amid global volatility (carry trade boost for NZDJPY).
⚠️ Risks That May Reverse the Trend
BoJ surprise tightening rhetoric (e.g. bond purchase taper announcement).
China data deterioration, hurting Kiwi sentiment.
Sharp equity sell-off and geopolitical escalation (Yen safe-haven reversal).
📅 Important News to Watch
🇳🇿 NZ Trade Balance (upcoming)
🇯🇵 Tokyo Core CPI (Jun 28) – Critical for BoJ policy speculation.
RBNZ or BoJ member speeches (hawkish or dovish shifts)
Fed tone shift or US dollar strength spillover
🏁 Who Leads the Move?
NZDJPY could lead among yen crosses due to the RBNZ’s clear inflation fight versus BoJ’s passive stance. NZDJPY is also more responsive to commodity and global risk-on flows than EURJPY or USDJPY.

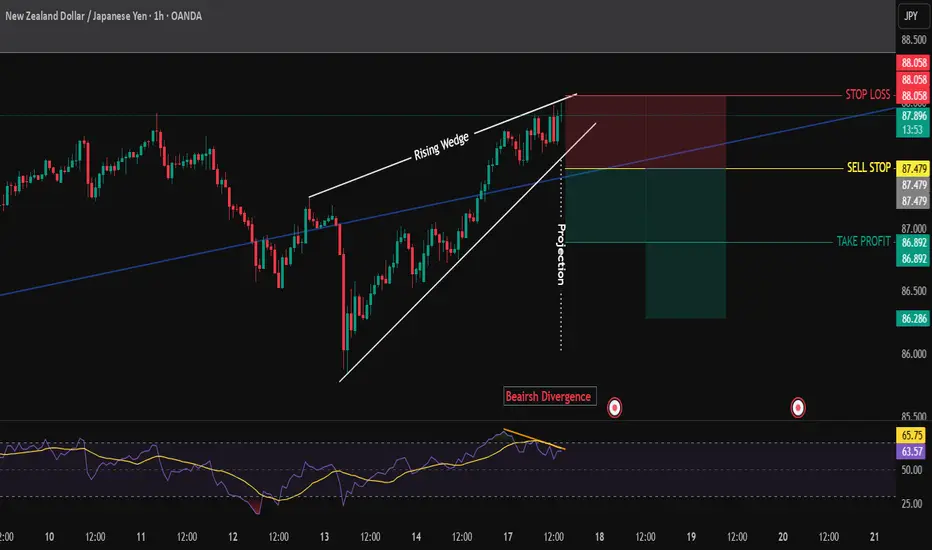
NZDJPY BEARISH SETUPNZDJPY has been a bullish trend.
At rsi bearish divergence formed and also rising wedge reversal pattern formed.
I took short trade with sell stop order.
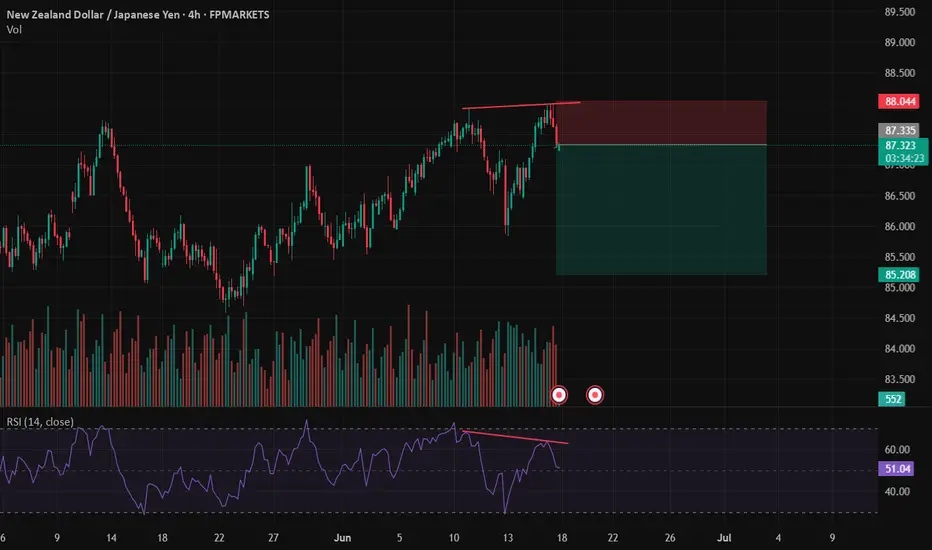
Double TopAnother double top with divergency on the oscillator. The divergency didn't quite start at the overbought zone but will give it a go.


NZDJPY TECHNICALS AND FUNDAMENTALS DETAILED ANALYSISNZDJPY is currently trading around the 87.00 handle and has just bounced strongly from a well-respected support zone. The pair is now showing clear signs of recovery after a brief corrective dip, and price action on the 8H chart confirms a bullish reversal structure. The support held firmly, and we’ve already seen a solid rejection wick forming the foundation of this new impulsive leg up. With this momentum in play, I’m targeting the 90.00 zone in the coming sessions.
On the macro front, the New Zealand dollar is benefiting from a relatively hawkish RBNZ stance. Inflation pressures remain sticky in New Zealand, and the central bank has reiterated its cautious approach toward rate cuts. Meanwhile, the Japanese yen remains under persistent selling pressure due to the Bank of Japan's ultra-loose policy and intervention uncertainty. These diverging central bank outlooks are fueling continued upside in NZDJPY as carry trade flows remain in favor of the kiwi.
From a technical perspective, the market structure remains bullish. After retesting a previous higher low, price is climbing within a clean channel and has broken minor resistance levels convincingly. This aligns well with a swing continuation pattern toward the 90.00 mark. Momentum is supported by increasing bullish volume, and as long as we remain above 86.00, the bulls are firmly in control.
In my analysis, this is a textbook setup. We’re seeing higher lows, strong trend continuation, and a macro-backed directional bias. I’m long from 87.00 with a bullish outlook into 90.00. I’ll reassess price action as we approach major resistance levels, but until then, I remain confidently positioned with a clear technical and fundamental confluence.

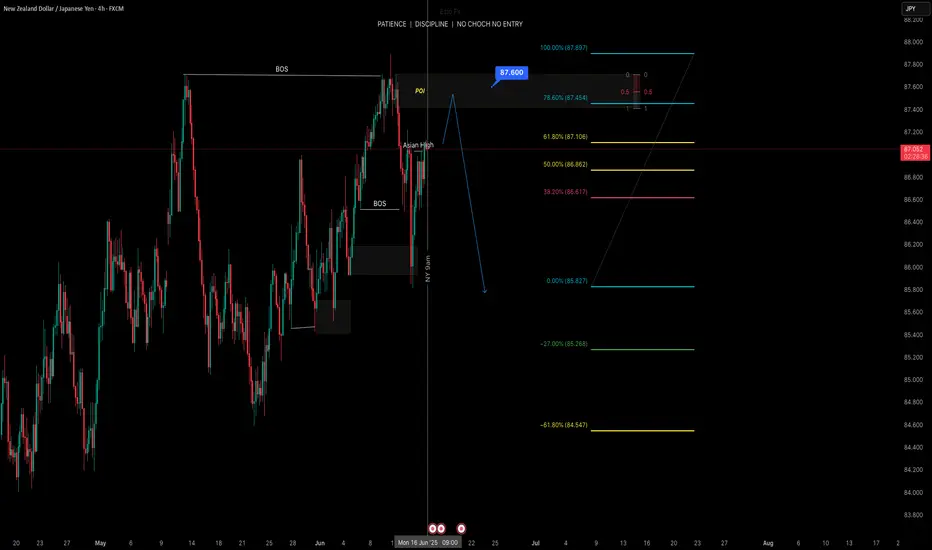
Idea on a chartNZDJPY great chart 78.6 fib is where i will look at rejections on H1 and M30.
Have you been paying attention to commodities?
People are talking about the next ‘commodity supercycle’.
That’s a fun word for all commodity prices going up a lot. The theory goes that it started in 2020 in the aftermath of the pandemic but it’s really only been gold that has been rising since then. Now the other commodities are starting to wake up..
In last week’s report (week 23), we talked about the EPIC breakout in silver.
Gold and silver have now potentially been joined by the ‘big boss’ of commodities - oil.
Regular readers will remember we talked about oil in our final report of 2024 asking whether it will be ‘Top trade of 2025’. Well it still might be - just not in the way we expected. More on that in a minute.
NZD/JPY BEARS WILL DOMINATE THE MARKET|SHORT
Hello, Friends!
NZD/JPY pair is trading in a local uptrend which we know by looking at the previous 1W candle which is green. On the 1D timeframe the pair is going up too. The pair is overbought because the price is close to the upper band of the BB indicator. So we are looking to sell the pair with the upper BB line acting as resistance. The next target is 84.431 area.
Disclosure: I am part of Trade Nation's Influencer program and receive a monthly fee for using their TradingView charts in my analysis.
✅LIKE AND COMMENT MY IDEAS✅

NZDJPY Set To Grow! BUY!
My dear friends,
Please, find my technical outlook for NZDJPY below:
The instrument tests an important psychological level 86.740
Bias - Bullish
Technical Indicators: Supper Trend gives a precise Bullish signal, while Pivot Point HL predicts price changes and potential reversals in the market.
Target - 87.156
About Used Indicators:
Super-trend indicator is more useful in trending markets where there are clear uptrends and downtrends in price.
Disclosure: I am part of Trade Nation's Influencer program and receive a monthly fee for using their TradingView charts in my analysis.
———————————
WISH YOU ALL LUCK

NZDJPY Breakdown Setup Alert | Technical AnalysisThe NZDJPY pair has broken the bullish trendline, signaling a possible shift in momentum.
Key Observations:
Price rejected the 87.720 resistance level
Clear break and close below the trendline
Pullback expected before continuation down
Targets:
📉 First support: 84.232
📉 Final support: 80.039
🔄 A retest of the broken trendline or horizontal resistance could offer a clean short entry opportunity.
Bearish Bias remains valid unless price reclaims and closes above 87.720.
💬 What do you think? Is this the start of a deeper correction for NZDJPY?
📈 Drop your thoughts and let’s discuss!
#NZDJPY #Forex #PriceAction #TrendlineBreak #TechnicalAnalysis #TradingView

If you decided to listen to me you welcome It respected resistance and went straight down like I expected

NZD_JPY WILL KEEP GROWING|LONG|
✅NZD_JPY is trading along
The rising support line
And as the pair is going up now
After the retest of the line
I am expecting the price to keep growing
To retest the supply levels above at 87.429
LONG🚀
✅Like and subscribe to never miss a new idea!✅
Disclosure: I am part of Trade Nation's Influencer program and receive a monthly fee for using their TradingView charts in my analysis.

NZDJPY BUY TRADE PLAN
📅 Date: June 12, 2025
📌 Plan Type: Tactical Intraday Plan
📈
Bias: Bullish Rebound — potential continuation after clean corrective leg
Execution Style: Market order — confirmation-based entry on retest
🔍 Multi-Timeframe Structure Breakdown:
* Weekly:
Price printing higher lows after bottoming in Q1 2025. Currently challenging a prior multi-week resistance shelf (87.00–87.50). Momentum is building but needs confirmation of acceptance above 87.20 for clean continuation.
* Daily:
Mid-range continuation. Structure is bullish with recent pullback finding demand near 86.50. Current D1 candle shows rejection wick + body close green — price holding inside a bullish continuation leg.
* 4H:
Bullish engulfing candle just closed after retracement into previous demand (~86.50). Price rebounding with strength. Break of minor bearish trendline — new impulsive phase could be underway.
* 1H:
Sharp reversal from 86.50s with three strong bull candles and a short rejection wick. Current price has pulled into minor supply (87.15–87.25) but momentum favors upside continuation.
🎯 Trade Strategy:
🔹 Primary Trade Idea: Buy on Retest of Breakout Structure
Setup Type: Pullback + Continuation
Order Style: 🔶 Market (confirmation-based after retest candle)
* 📥 Entry Zone: 86.95–87.05 (pullback into H1 structure + imbalance area)
* 🛡️ Stop Loss: 86.48 (below 4H demand and engulfing candle low)
* 🎯 TP1: 87.50 (supply edge)
* 🎯 TP2: 87.95 (weekly resistance area)
* 🎯 TP3 (Extended): 88.30 (D1 extension zone / last swing high)
🧠 ForexGPT Elite Forecast Bias:
Direction Probability Reason
🔵 Bullish 78% MTF alignment, engulfing reversal from structure, no bearish rejection yet
🔴 Bearish Rejection 22% Only valid if price closes below 86.50 (HTF invalidation)
🧭 Trade Context Summary:
* Momentum building from higher timeframe structure.
* Volume candles (1H–4H) show acceleration, not exhaustion.
* Risk/reward favorable — clean invalidation and tight SL.
* Perfect tactical setup to trade NY continuation (if volume steps in).
🔁 Execution Notes:
* 💡 Wait for a bullish M15–H1 confirmation (e.g., wick rejection, inside bar break) from 86.95–87.05 zone before entry.
* 🧨 If price breaks above 87.25 without retest, then consider FOMO breakout continuation only if momentum candle breaks 87.30 with body close.
* ❌ Invalidation if price closes below 86.50 on H1/H4 candle.
📌 Summary:
NZDJPY offers a high-probability bullish continuation play. After a clean 4H pullback, price has resumed upward flow. Buy the dip into 86.95–87.05 with a tight stop, targeting 87.50+ intraday, scaling to 88.30 if momentum holds. This is a professional-grade play — let it confirm, manage risk with discipline.

Potentially sell back down Currently price touching resistance. If it don’t break or have false breakouts, I expect it to keep going down


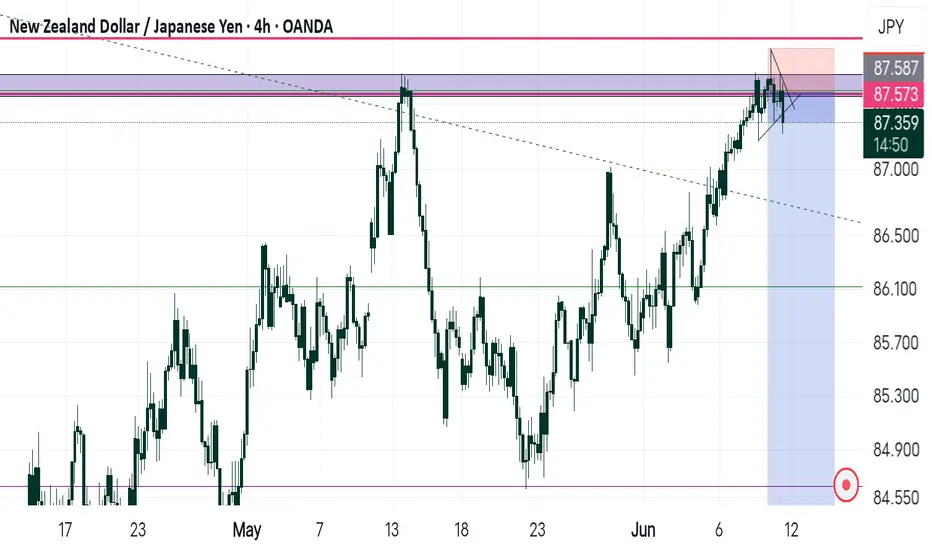
NZDJPY - ShortNZD/JPY – 4H Short Setup at 87.334
The pair is approaching a key resistance level at 87.334, which aligns with a previous supply zone and the upper boundary of a descending channel. Price action has shown multiple rejection wicks near this level, suggesting weakening bullish momentum.
A short entry at 87.334 targets a rejection move toward the next demand zone around 86.500, with invalidation above the recent high. This setup offers a favorable risk-to-reward ratio if the bearish structure continues to hold.
Risk Management:
If entering short at 87.334, it’s crucial to place a tight stop-loss just above recent highs (e.g., 87.50–87.60 zone) to limit exposure in case of a breakout. Only risk 1–2% of your capital on this trade and consider reducing position size if volatility increases. Targeting the 86.50 zone offers a solid risk-reward ratio, but always adapt based on live price action.

NZDJPY SHORTSNzdjpy is about to drop in my opinion to atleast another 200 pips and i entered quite early tho so i might either just watch and scale in as it drops but it already tested previous supply and formed head and shoulder pattern and broke my inverted trendline confirming drop...an it might take a couple weeks to fulfil so lets see... Follow @IAMWHITELIONFX for more analysis....
NZDJPY Potential UpsidesHey Traders, in today's trading session we are monitoring NZDJPY for a buying opportunity around 87.350 zone, NZDJPY is trading in an uptrend and currently is in a correction phase in which it is approaching the trend at 87.350 support and resistance area.
Trade safe, Joe.

