NZDUSD is Nearing an Important SupportHey Traders, in today's trading session we are monitoring NZDUSD for a buying opportunity around 0.59100 zone, NZDUSD is trading in an uptrend and currently is in a correction phase in which it is approaching the trend at 0.59100 support and resistance area.
Trade safe, Joe.
NZDUSD trade ideas
NZD/USD Ready to Explode? The Smart Money Is Making a MoveBias: Bullish Bounce from Key Demand Zone
NZD/USD is testing a strong confluence zone:
Long-term ascending trendline support
Weekly demand area between 0.5890 and 0.5940
Bullish RSI divergence near oversold conditions
The triple rejection wicks signal strong demand around 0.5900, suggesting a possible reversal toward the 0.6020–0.6050 resistance area.
🧠 COT Insight:
NZD: Non-commercial traders added +669 long contracts and reduced shorts by -102 → net bullish shift
USD: Net short exposure increases; total non-commercial shorts now exceed longs by ~4000 contracts
Implication: institutions are rotating into NZD while trimming USD exposure
📊 Sentiment:
86% of retail traders are long NZD/USD → retail sentiment is heavily skewed
This could delay or limit upside as smart money often moves counter to retail positions
📅 Seasonality (July):
July has historically been a bullish month for NZD/USD across all reference windows (20Y, 15Y, 10Y, 5Y, 2Y)
Average July return consistently positive → adds conviction to bullish thesis
🗺 Outlook:
If the zone at 0.5880–0.5920 holds, price may bounce toward 0.6020–0.6050.
Break below would invalidate structure and expose 0.5850 and then 0.5780.
NZDUSD is bullishThe price just tapped into a valid order block.
This suggests a potential long (buy) opportunity.
We may see bullish momentum from this zone.
Watch for confirmation like bullish engulfing or BOS.
Place stop loss just below the order block.
Target the next resistance or liquidity zone.
Wait for entry confirmation on lower timeframes.
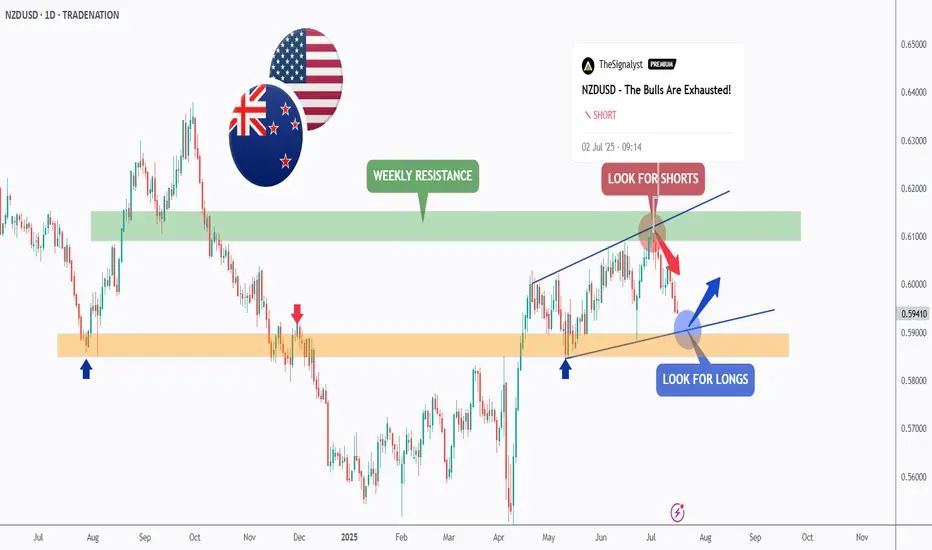
NZDUSD - It is Time!Hello TradingView Family / Fellow Traders. This is Richard, also known as theSignalyst.
As per our last NZDUSD analysis, attached on the chart, it rejected the upper bound of the blue wedge pattern and traded lower.
📈This week, NZDUSD is retesting the lower bound of the wedge.
Moreover, the orange zone is a strong weekly support.
🏹 Thus, the highlighted blue circle is a strong area to look for buy setups as it is the intersection of the lower blue trendline and orange support.
📚 As per my trading style:
As #NZDUSD approaches the blue circle zone, I will be looking for bullish reversal setups (like a double bottom pattern, trendline break , and so on...)
📚 Always follow your trading plan regarding entry, risk management, and trade management.
Good luck!
All Strategies Are Good; If Managed Properly!
~Rich
Disclosure: I am part of Trade Nation's Influencer program and receive a monthly fee for using their TradingView charts in my analysis.
NZDUSD to turnaround?NZDUSD - 24h expiry
The correction lower is assessed as being complete.
We expect a reversal in this move.
Risk/Reward would be poor to call a buy from current levels.
A move through 0.5925 will confirm the bullish momentum.
The measured move target is 0.5975.
We look to Buy at 0.5900 (stop at 0.5875)
Our profit targets will be 0.5950 and 0.5975
Resistance: 0.5925 / 0.5950 / 0.5975
Support: 0.5900 / 0.5875 / 0.5850
Risk Disclaimer
The trade ideas beyond this page are for informational purposes only and do not constitute investment advice or a solicitation to trade. This information is provided by Signal Centre, a third-party unaffiliated with OANDA, and is intended for general circulation only. OANDA does not guarantee the accuracy of this information and assumes no responsibilities for the information provided by the third party. The information does not take into account the specific investment objectives, financial situation, or particular needs of any particular person. You should take into account your specific investment objectives, financial situation, and particular needs before making a commitment to trade, including seeking advice from an independent financial adviser regarding the suitability of the investment, under a separate engagement, as you deem fit.
You accept that you assume all risks in independently viewing the contents and selecting a chosen strategy.
Where the research is distributed in Singapore to a person who is not an Accredited Investor, Expert Investor or an Institutional Investor, Oanda Asia Pacific Pte Ltd (“OAP“) accepts legal responsibility for the contents of the report to such persons only to the extent required by law. Singapore customers should contact OAP at 6579 8289 for matters arising from, or in connection with, the information/research distributed.
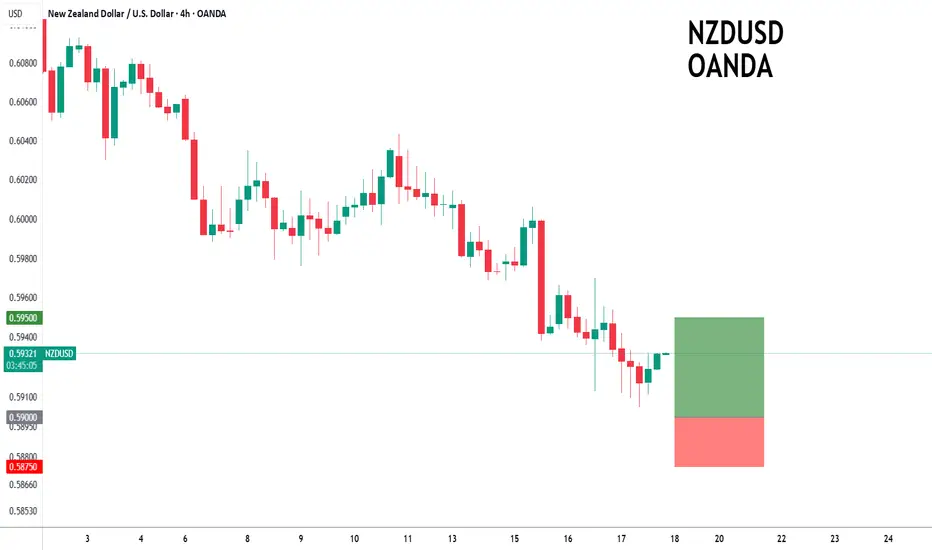
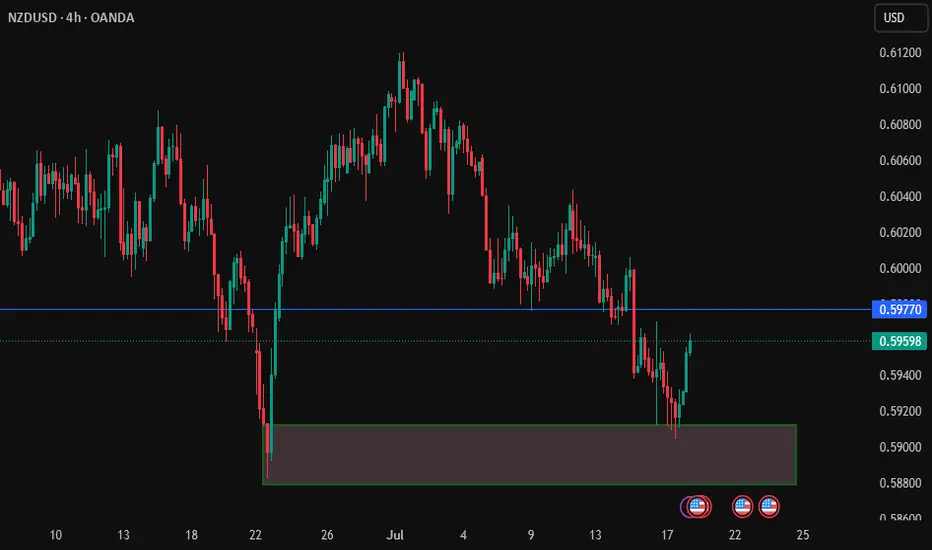
NZD/USD (4H time frame)..NZD/USD (4H time frame), here's the analysis:
---
📉 Chart Analysis Summary:
Price has broken below the trendline and is currently below the Ichimoku cloud, indicating bearish momentum.
A bearish move is likely continuing toward a strong support zone.
A rebound is drawn on my analysis suggesting a possible bounce after reaching a key demand zone.
---
🎯 Target Levels:
🔻 Bearish Move (Primary Setup):
Sell from: Current zone around 0.59400
Target 1: 0.59000
Target 2 (Main Support Zone): 0.58600
Stop Loss: Above the red horizontal resistance — around 0.60000
---
🔁 Possible Bounce Scenario (Secondary Setup):
If price hits the 0.58600 zone and shows reversal signs:
Buy from: 0.58600 – 0.58800
Target: 0.59800 – 0.60000
---
⚠ Key Zones:
🔴 Resistance: 0.60000 – 0.60200
🟢 Support: 0.58600 – 0.58800
NZDUSD H4 I Bearish Reversal Based on the H4 chart, the price is approaching our sell entry level at 0.5965, a pullback resistance that aligns with the 61.8% Fib retracement.
Our take profit is set at 0.5923, a pullback support.
The stop loss is set at 0.6004, a swing high resistance.
High Risk Investment Warning
Trading Forex/CFDs on margin carries a high level of risk and may not be suitable for all investors. Leverage can work against you.
Stratos Markets Limited (tradu.com ):
CFDs are complex instruments and come with a high risk of losing money rapidly due to leverage. 66% of retail investor accounts lose money when trading CFDs with this provider. You should consider whether you understand how CFDs work and whether you can afford to take the high risk of losing your money.
Stratos Europe Ltd (tradu.com ):
CFDs are complex instruments and come with a high risk of losing money rapidly due to leverage. 66% of retail investor accounts lose money when trading CFDs with this provider. You should consider whether you understand how CFDs work and whether you can afford to take the high risk of losing your money.
Stratos Global LLC (tradu.com ):
Losses can exceed deposits.
Please be advised that the information presented on TradingView is provided to Tradu (‘Company’, ‘we’) by a third-party provider (‘TFA Global Pte Ltd’). Please be reminded that you are solely responsible for the trading decisions on your account. There is a very high degree of risk involved in trading. Any information and/or content is intended entirely for research, educational and informational purposes only and does not constitute investment or consultation advice or investment strategy. The information is not tailored to the investment needs of any specific person and therefore does not involve a consideration of any of the investment objectives, financial situation or needs of any viewer that may receive it. Kindly also note that past performance is not a reliable indicator of future results. Actual results may differ materially from those anticipated in forward-looking or past performance statements. We assume no liability as to the accuracy or completeness of any of the information and/or content provided herein and the Company cannot be held responsible for any omission, mistake nor for any loss or damage including without limitation to any loss of profit which may arise from reliance on any information supplied by TFA Global Pte Ltd.
The speaker(s) is neither an employee, agent nor representative of Tradu and is therefore acting independently. The opinions given are their own, constitute general market commentary, and do not constitute the opinion or advice of Tradu or any form of personal or investment advice. Tradu neither endorses nor guarantees offerings of third-party speakers, nor is Tradu responsible for the content, veracity or opinions of third-party speakers, presenters or participants.

NZDUSD Sell Stop SetupNZDUSD is in a clear downtrend, forming lower highs and lower lows. A sell stop is placed below the recent support to confirm bearish continuation.
Sell Stop: 0.59
Stop Loss (SL): 0.60
Take Profit 1 (TP1): 0.58
Take Profit 2 (TP2): 0.57
Waiting for price activation to validate the setup.

NZDUSD Bearish towards .5925!1). Wave 5 drop needs a completion lower! 2). Risk is selling off! 3). Volume is falling! 4). Price appears to be heading towards lower market sentiment! 5). Trump is imposing more Tariffs, which is likely causing deeper corrections!

NZD/USD 1-Target 0.59900 2- Target 0.59328Monday's target no. 1, then target no. 2, meaning continued weakening of the NZD against the USD.
Tools:
- real volume (proper interpretation)
- Fibonacci expansion ABC
- Fibonacci retracement
- volume support and resistance levels
- oversold/overbought index
- candlestick patterns

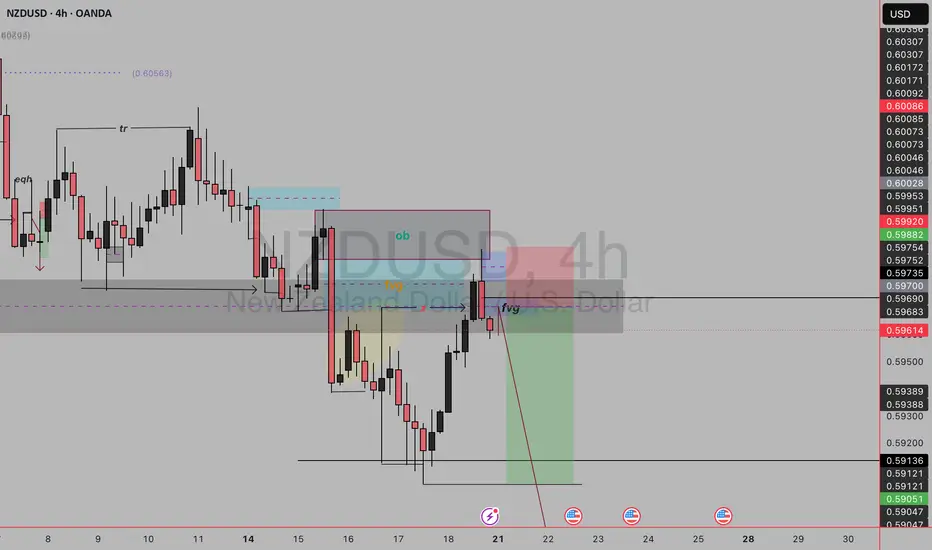
NZDUSD SELL SETUP✅Market Structure: Bearish.
Clear lower highs and lower lows.
Price retraced into a premium zone after the last strong sell-off.
✅Key Elements in the Setup
1.OB (Order Block) – Blue zone:
This is the last bullish candle before a strong bearish move.
Acts as a supply zone.
Price tapped into it before reacting.
2.FVG (Fair Value Gap) – Highlighted (yellow & blue):
Imbalance in price action (inefficient movement).
You marked this as confluence — price filled the FVG and rejected.
3.Liquidity Grab (EQH):
Equal highs were taken out — classic liquidity sweep.
This hints at a manipulation before the real move.
✅Entry Trigger:
Price pushed into the OB + FVG zone.
Rejection candle + break of structure on the lower timeframe.
You entered after that shift.
✅Trade Components
Entry: After price rejects OB + FVG area.
Stop Loss: Above OB and liquidity sweep (~0.60086).
Take Profit: Into previous low (~0.59047) or a bit lower for extended target.
Risk:Reward: Very healthy, above 1:4.
✅ Confluences Supporting the Sell
Premium pricing (above 50% of swing range).
Price filled FVG + tapped OB.
Liquidity above EQH taken.
Sharp rejection from that zone.
FVG left behind on the way down = price likely to seek lower inefficiencies.
NZDUSD BEARISH 16-7-2025trend : bearish
divergence : n/a
reversal : n/a
continuation : lhs & lls
harmonics : n/a
bias : bearish

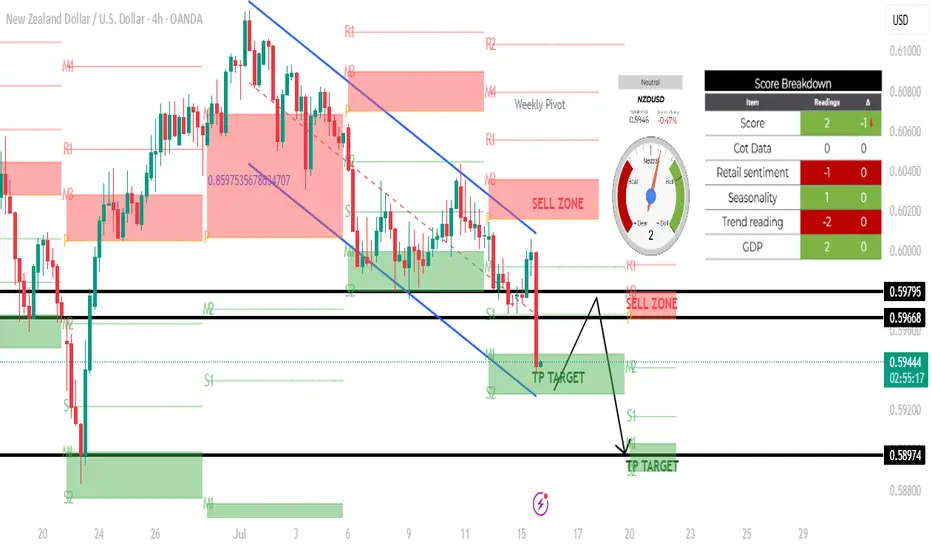
NZDUSD H4 SHORT SETUP: 15 JULY 2025Based on the 4-hour chart of NZD/USD, here's a technical analysis of the current setup:
\---
🕒 Timeframe: 4H
💱 Pair: NZD/USD
📉 Current Price: Around 0.59430
---
🔍 Chart Structure and Analysis:
🔻 Trend:
The market is in a clear downtrend, as indicated by the descending channel and the strong bearish candle that broke below the previous support zone.
Sellers are currently in control.
---
📍 Key Zones:
🔴 Sell Zones (Supply):
0.59668 – 0.59795: Marked as a supply/sell zone.
Price previously reacted here and dropped sharply. Expect selling pressure if price retests this zone.
---
🟢 Take Profit (TP) Targets / Demand Zones:
1. TP Target 1: Around 0.59430 – 0.59300 — Already hit; slight bounce seen.
2. TP Target 2: 0.58974 — This is the next key target/support zone, which aligns with a prior low.
---
🔁 Possible Scenarios:
✅ Scenario 1: Continuation Bearish
If price fails to break back above the 0.59668 resistance, it will likely:
Consolidate below,
Retest and reject again,
Then head lower toward 0.58974 (TP2).
⚠ Scenario 2: Short-Term Retracement
If there's a bounce (as seen by the current candle's wick), price may retest the sell zone at 0.59668–0.59795.
This could present another short entry opportunity with a target at 0.58974.
---
📊 Confluences:
Weekly Pivot + Structure Resistance near 0.59668: Strengthens the sell zone.
Strong Bearish Momentum Candle: Signals potential for continuation.
TP Zone overlaps with S2 level: Providing possible support/bounce area.
NZDUSD SHORT SELLING # NZDUSD SHORT SELLING
Market IN monthly SIBI in Daily TF MSS , in Daily SIBI Going to LTF after Valid MSS with Run on Stop either Engage dose not Matter . entry with Tight SL and LONG Target Open
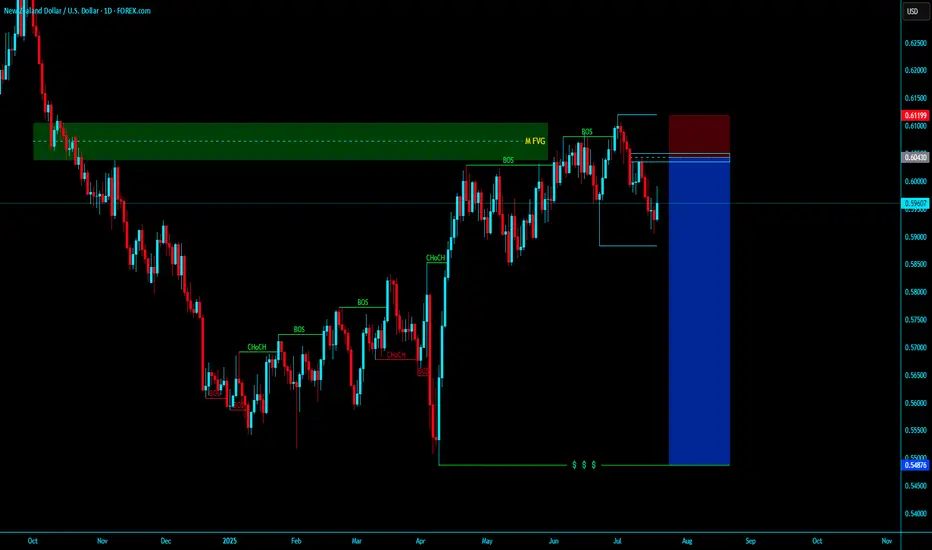
NZDUSD Faces Further Downside Amid Renewed Tariff ConcernsNZDUSD Faces Further Downside Amid Renewed Tariff Concerns
In July, NZDUSD created a false breakout after printing a new higher high.
Initially, the pair appeared set for further gains, but the U.S. dollar regained strength following stronger-than-expected Non-Farm Payrolls (NFP) data.
Today, market sentiment remains fragile as anticipation builds around President Trump's upcoming remarks on tariffs.
Our analysis suggests that the broader outlook remains unchanged—NZDUSD is still positioned for further downside.
You may find more details in the chart!
Thank you and Good Luck!
❤️PS: Please support with a like or comment if you find this analysis useful for your trading day❤️
Disclosure: I am part of Trade Nation's Influencer program and receive a monthly fee for using their TradingView charts in my analysis.

July 13, Forex Outlook : This Week’s Blueprint to Profit!Welcome back, traders!
In today’s video, we’ll be conducting a Forex Weekly Outlook, analyzing multiple currency pairs from a top-down perspective—starting from the higher timeframes and working our way down to the lower timeframes.
Currency Pairs:
EURUSD
USDCAD
AUDUSD
EURGBP
EURJPY
GBPCHF
USDCHF
NZDCHF
NZDUSD
EURNZD
Our focus will be on identifying high-probability price action scenarios using clear market structure, institutional order flow, and key confirmation levels. This detailed breakdown is designed to give you a strategic edge and help you navigate this week’s trading opportunities with confidence.
📊 What to Expect in This Video:
1. Higher timeframe trend analysis
2. Key zones of interest and potential setups
3. High-precision confirmations on lower timeframes
4. Institutional insight into where price is likely to go next
Stay tuned, take notes, and be sure to like, comment, and subscribe so you don’t miss future trading insights!
Have a great week ahead, God bless you!
The Architect 🏛️📉


NZDUSD - Elliott Wave: High-Probability Reversal Zone Ahead!NZDUSD – Elliott Wave Roadmap
3Day Chart
Every move has been unfolding with precision — true to Elliott Wave Theory.
We're in the final leg of a massive A-B-C correction:
- Wave A and the complex Wave B (WXY) are complete.
- Wave C is now in play, targeting the highs of Wave A.
We’ve just seen a clean 5-wave advance (wave 1 leading diagonal).
Now expecting a classic ABC correction for wave 2, into our reversal zone (38.2–61.8% Fib).
🔍 Once price enters this zone, we’ll drop to lower timeframes and:
- Look for bullish confirmations (BOS, trendline break)
- Set entries with stops below corrective lows
- Targets: 0.63 (500 pips) and 0.65 (700 pips)
📌 Why is the buy zone so big?
It’s a higher timeframe zone. Once price enters, we zoom into lower timeframes for precise entries. The zone simply tells us when to focus, not where to blindly buy.
This is the Wave 3 generation point — and that’s where the real move begins.
Plan your trade. Watch for the setup. Execute with confidence.
Goodluck and as always, Trade Safe!
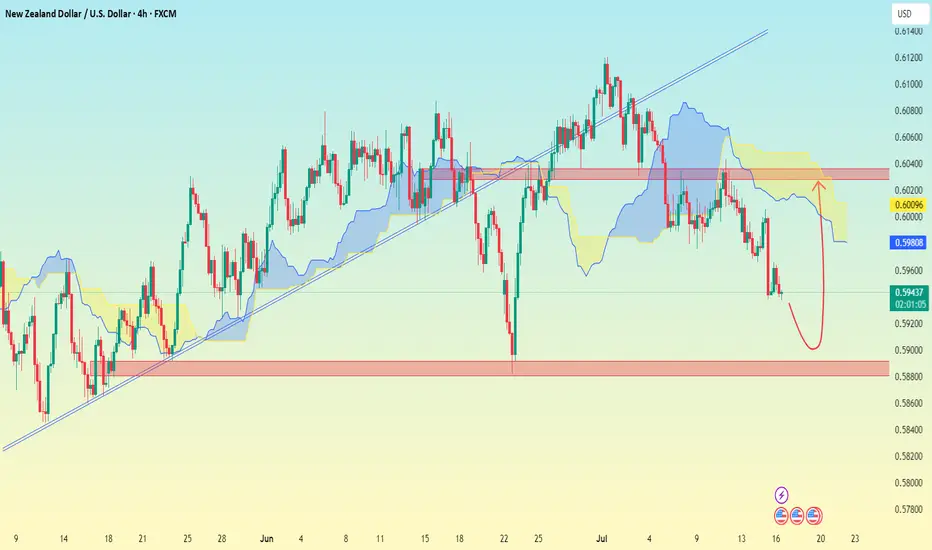
NZDUSD 12H Chart - Looking for this ABC correction for wave 2

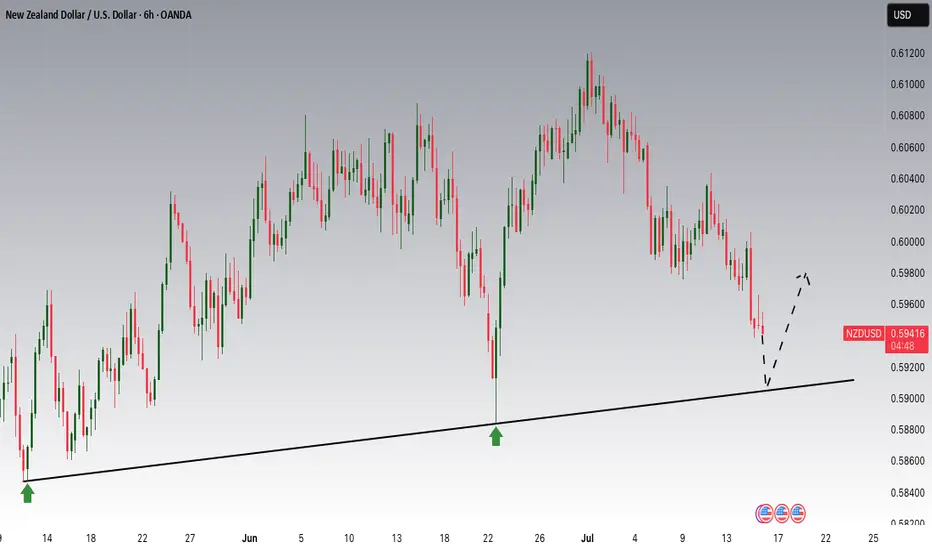
NZDUSD Excellent buy opportunity on the Channel Up bottom.Last time we looked at the NDUSD pair (May 27, see chart below), we gave a buy signal that in a few days hit our 0.60900 Target:
This time the price is trading exactly at the bottom of a 3-month Channel Up, with the 1D RSI entering its Support Zone. The true Support might be a little lower on the 1D MA200 (orange trend-line) and as long as it holds, the trend will remain bullish, but this is the first strong buy signal of the chart.
Our Target is 0.61450, which will be a +4.10% rise, exactly the same as both previous Bullish Legs.
-------------------------------------------------------------------------------
** Please LIKE 👍, FOLLOW ✅, SHARE 🙌 and COMMENT ✍ if you enjoy this idea! Also share your ideas and charts in the comments section below! This is best way to keep it relevant, support us, keep the content here free and allow the idea to reach as many people as possible. **
-------------------------------------------------------------------------------
Disclosure: I am part of Trade Nation's Influencer program and receive a monthly fee for using their TradingView charts in my analysis.
💸💸💸💸💸💸
👇 👇 👇 👇 👇 👇

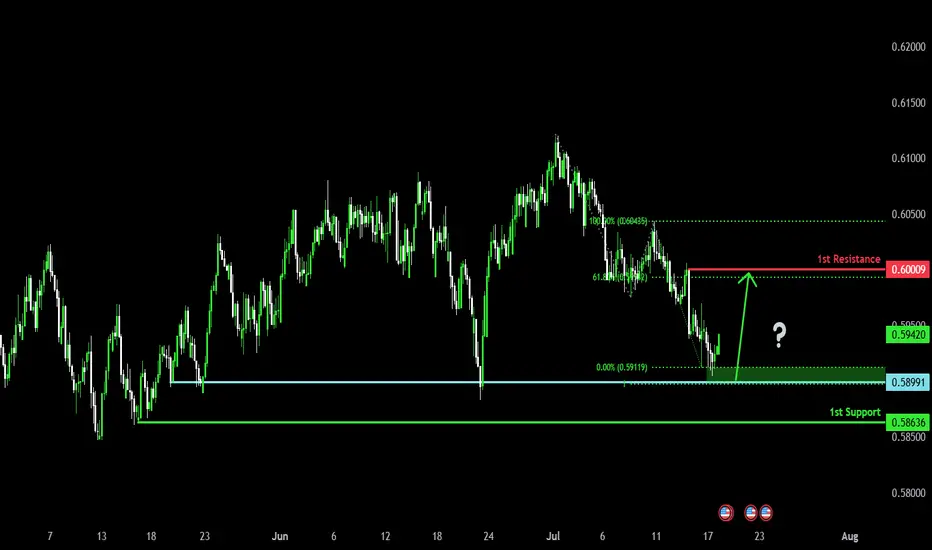
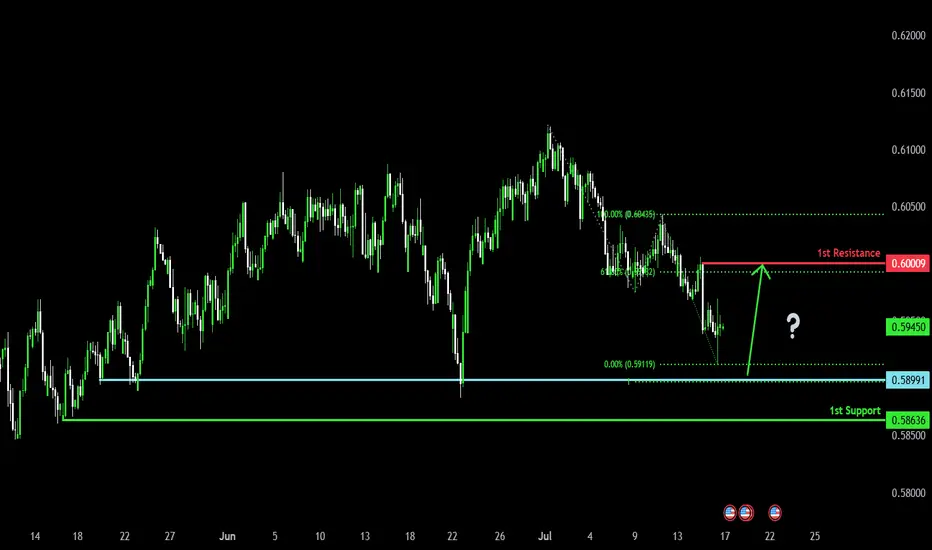
Bullish bounce?The Kiwi (NZD/USD) is falling towards the pivot and could bounce to the 1st resistance.
Pivot: 0.5899
1st Support: 0.5863
1st Resistance: 0.6000
Risk Warning:
Trading Forex and CFDs carries a high level of risk to your capital and you should only trade with money you can afford to lose. Trading Forex and CFDs may not be suitable for all investors, so please ensure that you fully understand the risks involved and seek independent advice if necessary.
Disclaimer:
The above opinions given constitute general market commentary, and do not constitute the opinion or advice of IC Markets or any form of personal or investment advice.
Any opinions, news, research, analyses, prices, other information, or links to third-party sites contained on this website are provided on an "as-is" basis, are intended only to be informative, is not an advice nor a recommendation, nor research, or a record of our trading prices, or an offer of, or solicitation for a transaction in any financial instrument and thus should not be treated as such. The information provided does not involve any specific investment objectives, financial situation and needs of any specific person who may receive it. Please be aware, that past performance is not a reliable indicator of future performance and/or results. Past Performance or Forward-looking scenarios based upon the reasonable beliefs of the third-party provider are not a guarantee of future performance. Actual results may differ materially from those anticipated in forward-looking or past performance statements. IC Markets makes no representation or warranty and assumes no liability as to the accuracy or completeness of the information provided, nor any loss arising from any investment based on a recommendation, forecast or any information supplied by any third-party.
NZDUSD TRADE SETUPWait for retest the entry level and bearish momentum then take a trade for Sell otherwise skip this setup

NZDUSDNZDUSD price is near the support zone 0.59197-0.58790. If the price cannot break through the 0.58790 level, it is expected that the price will rebound. Consider buying the red zone.
🔥Trading futures, forex, CFDs and stocks carries a risk of loss.
Please consider carefully whether such trading is suitable for you.
>>GooD Luck 😊
❤️ Like and subscribe to never miss a new idea!

Bullish bounce for the Kiwi?The price has bounced off the pivot which acts as a pullback support and could rise to the 61.8% Fibonacci resistance.
Pivot: 0.5899
1st Support: 0.5863
1st Resistance: 0.6000
Risk Warning:
Trading Forex and CFDs carries a high level of risk to your capital and you should only trade with money you can afford to lose. Trading Forex and CFDs may not be suitable for all investors, so please ensure that you fully understand the risks involved and seek independent advice if necessary.
Disclaimer:
The above opinions given constitute general market commentary, and do not constitute the opinion or advice of IC Markets or any form of personal or investment advice.
Any opinions, news, research, analyses, prices, other information, or links to third-party sites contained on this website are provided on an "as-is" basis, are intended only to be informative, is not an advice nor a recommendation, nor research, or a record of our trading prices, or an offer of, or solicitation for a transaction in any financial instrument and thus should not be treated as such. The information provided does not involve any specific investment objectives, financial situation and needs of any specific person who may receive it. Please be aware, that past performance is not a reliable indicator of future performance and/or results. Past Performance or Forward-looking scenarios based upon the reasonable beliefs of the third-party provider are not a guarantee of future performance. Actual results may differ materially from those anticipated in forward-looking or past performance statements. IC Markets makes no representation or warranty and assumes no liability as to the accuracy or completeness of the information provided, nor any loss arising from any investment based on a recommendation, forecast or any information supplied by any third-party.