NZDUSD is Nearing an Important Support Area!!Hey Traders, in today's trading session we are monitoring NZDUSD for a buying opportunity around 0.59300 zone, NZDUSD is trading in an uptrend and currently is in a correction phase in which it is approaching the trend at 0.59300 support and resistance area.
Trade safe, Joe.
NZDUSD trade ideas

NZDUSD: More Growth Ahead Next Week 🇳🇿🇺🇸
NZDUSD may continue rising next week after a confirmed bullish
trap that occurred following a text of a key daily horizontal support.
A local consequent Change of Character CHoCH indicates
a strength of the buyers and a highly probable growth.
Next resistance - 0.6
❤️Please, support my work with like, thank you!❤️
I am part of Trade Nation's Influencer program and receive a monthly fee for using their TradingView charts in my analysis.

NZDUSD Potential UpsidesHey Traders, in today's trading session we are monitoring NZDUSD for a buying opportunity around 0.59050 zone, NZDUSD is trading in an uptrend and currently is in a correction phase in which it is approaching the trend at 0.59050 support and resistance area.
Trade safe, Joe.

NZDUSD Long Setup: Watching 0.59308 Support ZoneI’m currently watching NZDUSD for a potential buy opportunity.
My anticipation is for price to pull back to the 0.59308 level a zone that aligns with previous structure support and potential bullish reaction.
Why This Level Matters
Previous Support Zone – 0.59308 has acted as a reaction point in recent sessions, indicating buyer interest.
Pullback Play – Waiting for price to retrace into value before looking for bullish confirmation.
Trend Context – On the higher timeframes (W1/D1), price is holding above key swing lows, suggesting buyers may defend this area.
Trading Plan
Wait for Pullback – Price to approach 0.59308.
Look for Confirmation – Bullish candlestick patterns (engulfing, pin bar) or rejection wicks.
Entry – Only after confirmation.
Stop Loss – Below recent swing low / invalidation zone.
Targets – First target near recent swing high, with partial profits taken along the way.
Risk Management Reminder
This is not financial advice — always manage your risk, as market conditions can change quickly.

$NZDUSD CPI Week Bullish ContinuationPEPPERSTONE:NZDUSD retraced slightly on the weekly chart into a weekly Imbalance and price rejected. My outlook is to see if we can drop into that Daily Imbalance that was formed and shot higher towards that Daily Balanced Price Range.
My first target is that 4H Balanced Price Range.

Ready to Rob the Kiwi? NZD/USD Bullish Breakout Plan🥝💚 NZD/USD Bullish Breakout Heist Plan 🟢💰 (Thief Trader Style)
🎭 Robbery Mission Activated – Code: Kiwi Uprising 💣📈
💥 Asset: NZD/USD
📍 Entry: 0.59400 (Breakout confirmed – the vault door’s open!)
🔐 Stop Loss: 0.58300 (Thief exit point – avoid the trap zone)
🎯 Target: 0.60500 (Cash-out point – grab the bags and vanish!)
🧠 Strategy: Layered Limit Orders a.k.a “Precision DCA Infiltration”
🧤 The Thief Trader is sneaking into the forex vaults once again — this time with eyes locked on Kiwi (NZD/USD). The bulls are loading up, and the breakout zone is showing green flags 🟢 — time to strike hard and clean 💰
🔥 Operation Details:
We’re stacking multiple limit orders like a pro thief would place decoys – distraction + precision = execution! Entry at 0.59400 is our main gate breach. Orders set in layers to trap liquidity zones below.
🚨 Stop Loss @ 0.58300 – tight enough to avoid getting caught, but wide enough to dodge fake traps.
🏆 Target: 0.60500 – that’s where the loot vault is sitting. Clean exit once we’re loaded with profits!
👀 Swingers & Scalpers Alert!
Only look LONG – no short robbing here!
🔁 Use trailing SL once in profit – protect your gold like a pro.
💡If cash is low – no panic, join the swing gang and glide in with patience & alerts. Smart robbers wait 🧠💼
📣 News Risk ⚠️
Avoid jumping during major news blast-offs.
Lock profits with trailing SL.
No panic entries — only sniper moves.🕵️♂️💥
❤️ Smash That BOOST Button 💥💪
Support the squad! More boosts = more heist plans, more clean money from the market streets 🚀📈
🎭 Stay sharp, rob smart — see you in the next plan, robbers 🤑🐱👤🎯
~ Thief Trader

Bullish forecast for nzd/usd nowGiven the key level and the currency reaction, expect a return to the specified level.

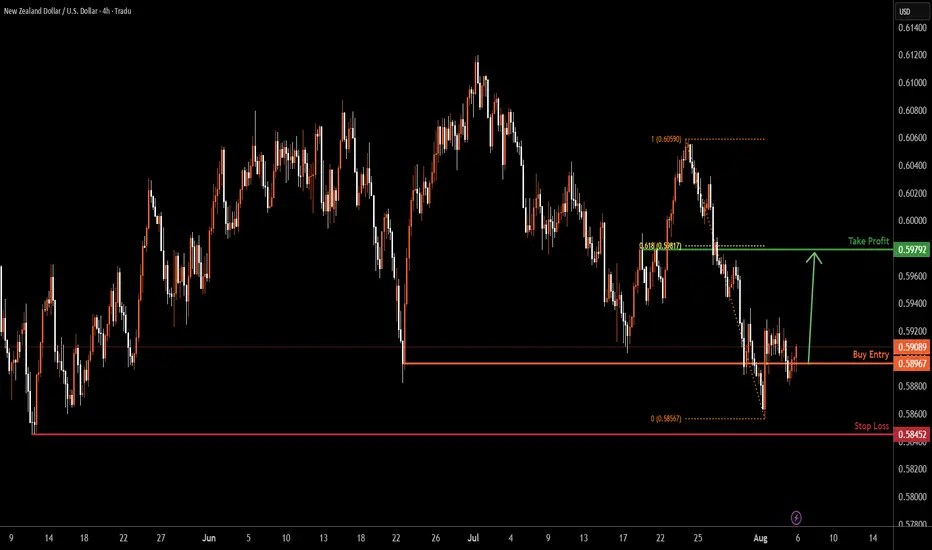
NZDUSD H4 | Bullish reversal for the KiwiBased on the H4 chart analysis, we can see that the price has bounced off the buy entry, which is a pullback support and could rise from this level to the take profit which aligns with the 61.8% Fibonacci retracement.
Buy entry is at 0.5896, which is a pullback support.
Stop loss is at 0.5845, which is a swing low support.
Take profit is at 0.5979, which is a pullback resistance that lines up with the 61.8% Fibonacci retracement.
High Risk Investment Warning
Trading Forex/CFDs on margin carries a high level of risk and may not be suitable for all investors. Leverage can work against you.
Stratos Markets Limited (tradu.com ):
CFDs are complex instruments and come with a high risk of losing money rapidly due to leverage. 65% of retail investor accounts lose money when trading CFDs with this provider. You should consider whether you understand how CFDs work and whether you can afford to take the high risk of losing your money.
Stratos Europe Ltd (tradu.com ):
CFDs are complex instruments and come with a high risk of losing money rapidly due to leverage. 66% of retail investor accounts lose money when trading CFDs with this provider. You should consider whether you understand how CFDs work and whether you can afford to take the high risk of losing your money.
Stratos Global LLC (tradu.com ):
Losses can exceed deposits.
Please be advised that the information presented on TradingView is provided to Tradu (‘Company’, ‘we’) by a third-party provider (‘TFA Global Pte Ltd’). Please be reminded that you are solely responsible for the trading decisions on your account. There is a very high degree of risk involved in trading. Any information and/or content is intended entirely for research, educational and informational purposes only and does not constitute investment or consultation advice or investment strategy. The information is not tailored to the investment needs of any specific person and therefore does not involve a consideration of any of the investment objectives, financial situation or needs of any viewer that may receive it. Kindly also note that past performance is not a reliable indicator of future results. Actual results may differ materially from those anticipated in forward-looking or past performance statements. We assume no liability as to the accuracy or completeness of any of the information and/or content provided herein and the Company cannot be held responsible for any omission, mistake nor for any loss or damage including without limitation to any loss of profit which may arise from reliance on any information supplied by TFA Global Pte Ltd.
The speaker(s) is neither an employee, agent nor representative of Tradu and is therefore acting independently. The opinions given are their own, constitute general market commentary, and do not constitute the opinion or advice of Tradu or any form of personal or investment advice. Tradu neither endorses nor guarantees offerings of third-party speakers, nor is Tradu responsible for the content, veracity or opinions of third-party speakers, presenters or participants.
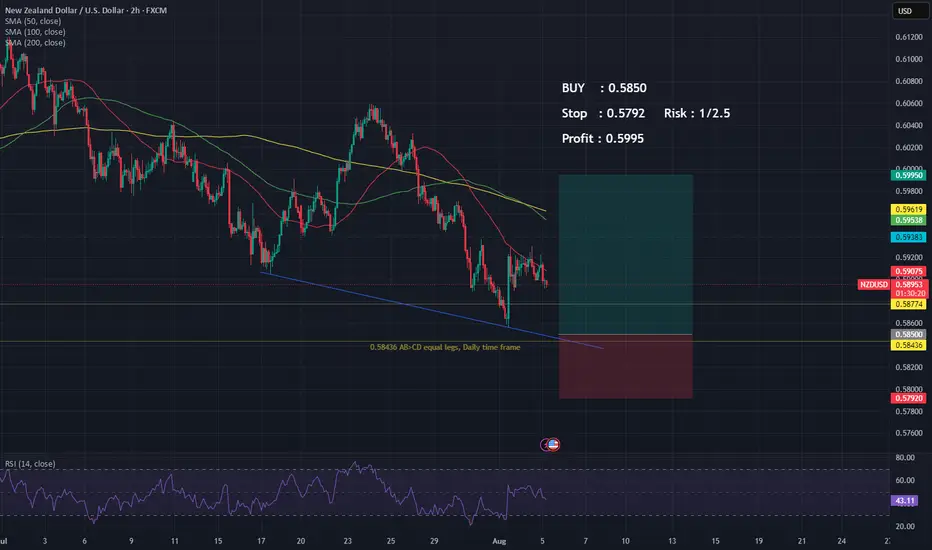
BUY : NZD/USD ( 3 wave pullback ) to continue the trend higher.I cancelled my last NZD/USD trade ( 5 pips profit ) due to NO follow through after NFP.
Another great chance to buy at better entry due to Daily AB=CD equal legs at 0.58436 and lower trend line also acts as resistance.
Buy : 0.5850
Stop : 0.5792
Profit : 0.5995 ( just before 78.6% Fib retracement )
Risk : 1/2.5
NZDUSD to find sellers at current market price?NZDUSD - 24h expiry
The bearish engulfing candle on the weekly chart is negative for sentiment.
Daily signals are mildly bearish.
20 1day EMA is at 0.5956.
Offers ample risk/reward to sell at the market.
The sequence for trading is lower lows and highs.
We look to Sell at 0.5959 (stop at 0.5984)
Our profit targets will be 0.5885 and 0.5875
Resistance: 0.5967 / 0.5986 / 0.6000
Support: 0.5943 / 0.5920 / 0.5900
Risk Disclaimer
The trade ideas beyond this page are for informational purposes only and do not constitute investment advice or a solicitation to trade. This information is provided by Signal Centre, a third-party unaffiliated with OANDA, and is intended for general circulation only. OANDA does not guarantee the accuracy of this information and assumes no responsibilities for the information provided by the third party. The information does not take into account the specific investment objectives, financial situation, or particular needs of any particular person. You should take into account your specific investment objectives, financial situation, and particular needs before making a commitment to trade, including seeking, under a separate engagement, as you deem fit.
You accept that you assume all risks in independently viewing the contents and selecting a chosen strategy.
Where the research is distributed in Singapore to a person who is not an Accredited Investor, Expert Investor or an Institutional Investor, Oanda Asia Pacific Pte Ltd (“OAP“) accepts legal responsibility for the contents of the report to such persons only to the extent required by law. Singapore customers should contact OAP at 6579 8289 for matters arising from, or in connection with, the information/research distributed.

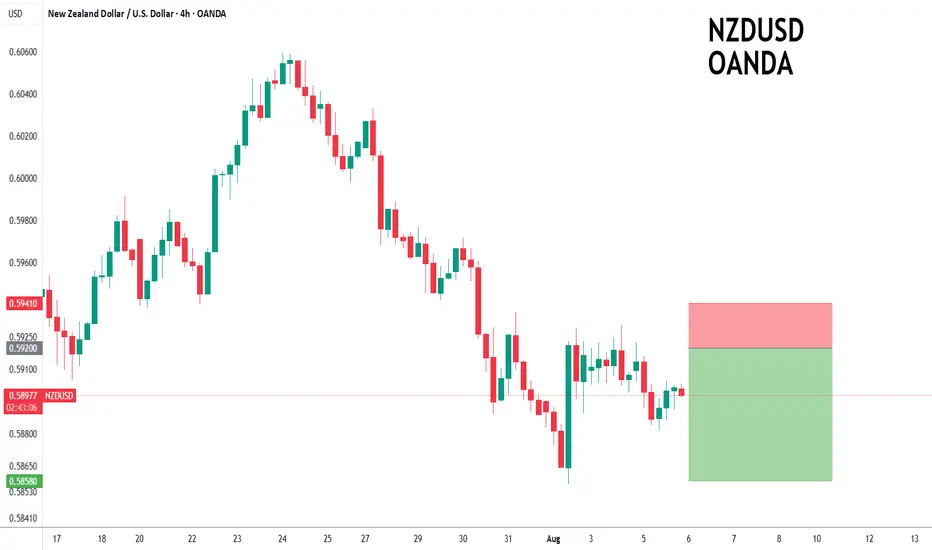
NZDUSD to continue in the downward move?NZDUSD - 24h expiry
There is no clear indication that the downward move is coming to an end.
Our short term bias remains negative.
50 4hour EMA is at 0.5931.
We look for a temporary move higher.
Risk/Reward would be poor to call a sell from current levels.
We look to Sell at 0.5920 (stop at 0.5941)
Our profit targets will be 0.5858 and 0.5848
Resistance: 0.5905 / 0.5930 / 0.5950
Support: 0.5881 / 0.5857 / 0.5830
Risk Disclaimer
The trade ideas beyond this page are for informational purposes only and do not constitute investment advice or a solicitation to trade. This information is provided by Signal Centre, a third-party unaffiliated with OANDA, and is intended for general circulation only. OANDA does not guarantee the accuracy of this information and assumes no responsibilities for the information provided by the third party. The information does not take into account the specific investment objectives, financial situation, or particular needs of any particular person. You should take into account your specific investment objectives, financial situation, and particular needs before making a commitment to trade, including seeking, under a separate engagement, as you deem fit.
You accept that you assume all risks in independently viewing the contents and selecting a chosen strategy.
Where the research is distributed in Singapore to a person who is not an Accredited Investor, Expert Investor or an Institutional Investor, Oanda Asia Pacific Pte Ltd (“OAP“) accepts legal responsibility for the contents of the report to such persons only to the extent required by law. Singapore customers should contact OAP at 6579 8289 for matters arising from, or in connection with, the information/research distributed.
Market Analysis: NZD/USD Much Higher—Uptrend Shows StrengthMarket Analysis: NZD/USD Much Higher—Uptrend Shows Strength
NZD/USD is also rising and might aim for more gains above 0.5970.
Important Takeaways for NZD/USD Analysis Today
- NZD/USD is consolidating gains above the 0.5940 zone.
- There is a short-term declining channel forming with resistance at 0.5960 on the hourly chart of NZD/USD.
NZD/USD Technical Analysis
On the hourly chart of NZD/USD on FXOpen, the pair started a steady increase from the 0.5880 zone. The New Zealand Dollar broke the 0.5925 resistance to start the recent increase against the US Dollar.
The pair settled above 0.5940 and the 50-hour simple moving average. It tested the 0.5970 zone and is currently consolidating gains. There was a move below the 23.6% Fib retracement level of the upward move from the 0.5881 swing low to the 0.5971 high.
The NZD/USD chart suggests that the RSI is stable above 50. On the upside, the pair might struggle near 0.5960. There is also a short-term declining channel forming with resistance at 0.5960.
The next major resistance is near the 0.5970 level. A clear move above the 0.5970 level might even push the pair toward the 0.6000 level. Any more gains might clear the path for a move toward the 0.6020 resistance zone in the coming days.
On the downside, immediate support is near the 0.5940 level. The first key support is near the 0.5925 level. It is close to the 50% Fib retracement level of the upward move from the 0.5881 swing low to the 0.5971 high.
The next major support is near the 0.5900 level. If there is a downside break below it, the pair might slide toward 0.5880. Any more losses could lead NZD/USD to 0.5820.
This article represents the opinion of the Companies operating under the FXOpen brand only. It is not to be construed as an offer, solicitation, or recommendation with respect to products and services provided by the Companies operating under the FXOpen brand, nor is it to be considered financial advice.

Bullish bounce for the Kiwi?The price is falling towards the support level, which is a pullback support that aligns with the 38.2% Fibonacci retracement and could bounce from this level to our take profit.
Entry: 0.5927
Why we like it:
There is a pullback support that lines up with the 38.2% Fibonacci retracement.
Stop loss: 0.5865
Why we like it:
There is a swing low support.
Take profit: 0.5999
Why we like it:
There is a pullback resistance that lines up witht he 71% Fibonacci retracement.
Enjoying your TradingView experience? Review us!
Please be advised that the information presented on TradingView is provided to Vantage (‘Vantage Global Limited’, ‘we’) by a third-party provider (‘Everest Fortune Group’). Please be reminded that you are solely responsible for the trading decisions on your account. There is a very high degree of risk involved in trading. Any information and/or content is intended entirely for research, educational and informational purposes only and does not constitute investment or consultation advice or investment strategy. The information is not tailored to the investment needs of any specific person and therefore does not involve a consideration of any of the investment objectives, financial situation or needs of any viewer that may receive it. Kindly also note that past performance is not a reliable indicator of future results. Actual results may differ materially from those anticipated in forward-looking or past performance statements. We assume no liability as to the accuracy or completeness of any of the information and/or content provided herein and the Company cannot be held responsible for any omission, mistake nor for any loss or damage including without limitation to any loss of profit which may arise from reliance on any information supplied by Everest Fortune Group.

short on nzdusdprice break a trend line and pullback to trend line and have a resistance and rsi is overbought too...
NZDUSD: Amid 15% Tariffs & Rate Cuts Looming, Time To Sell?Welcome back to the Weekly Forex Forecast for the week of Aug 11 - 15.
In this video, we will analyze the following FX market: NZDUSD
NZDUSD is dealing with new 15% tariffs from the US and signs of a rate cut coming in the next RBNZ meeting. Not to mention price mad a bearish impulsive move, and correcting into a bearish FVG. This would be the perfect premium array for the retracement to end, and the establishment of a lower high, followed by the start of the new bearish leg.
Enjoy!
May profits be upon you.
Leave any questions or comments in the comment section.
I appreciate any feedback from my viewers!
Like and/or subscribe if you want more accurate analysis.
Thank you so much!
Disclaimer:
I do not provide personal investment advice and I am not a qualified licensed investment advisor.
All information found here, including any ideas, opinions, views, predictions, forecasts, commentaries, suggestions, expressed or implied herein, are for informational, entertainment or educational purposes only and should not be construed as personal investment advice. While the information provided is believed to be accurate, it may include errors or inaccuracies.
I will not and cannot be held liable for any actions you take as a result of anything you read here.
Conduct your own due diligence, or consult a licensed financial advisor or broker before making any and all investment decisions. Any investments, trades, speculations, or decisions made on the basis of any information found on this channel, expressed or implied herein, are committed at your own risk, financial or otherwise.

Bearish drop for the Kiwi?The price is rising towards the pivot and could reverse to the 1st support, which is an overlap support.
Pivot: 0.5988
1st Support: 0.5853
1st Resistance: 0.6071
Risk Warning:
Trading Forex and CFDs carries a high level of risk to your capital and you should only trade with money you can afford to lose. Trading Forex and CFDs may not be suitable for all investors, so please ensure that you fully understand the risks involved and seek independent advice if necessary.
Disclaimer:
The above opinions given constitute general market commentary, and do not constitute the opinion or advice of IC Markets or any form of personal or investment advice.
Any opinions, news, research, analyses, prices, other information, or links to third-party sites contained on this website are provided on an "as-is" basis, are intended only to be informative, is not an advice nor a recommendation, nor research, or a record of our trading prices, or an offer of, or solicitation for a transaction in any financial instrument and thus should not be treated as such. The information provided does not involve any specific investment objectives, financial situation and needs of any specific person who may receive it. Please be aware, that past performance is not a reliable indicator of future performance and/or results. Past Performance or Forward-looking scenarios based upon the reasonable beliefs of the third-party provider are not a guarantee of future performance. Actual results may differ materially from those anticipated in forward-looking or past performance statements. IC Markets makes no representation or warranty and assumes no liability as to the accuracy or completeness of the information provided, nor any loss arising from any investment based on a recommendation, forecast or any information supplied by any third-party.

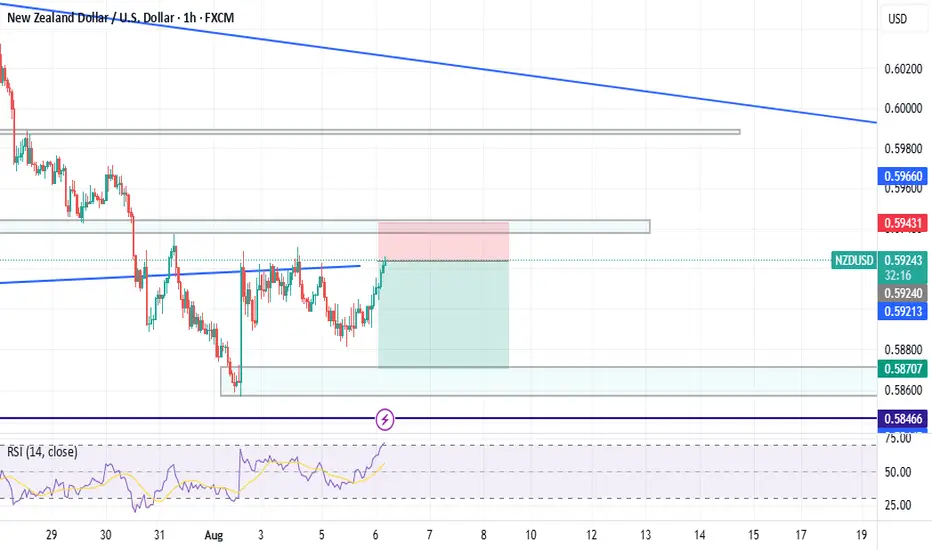
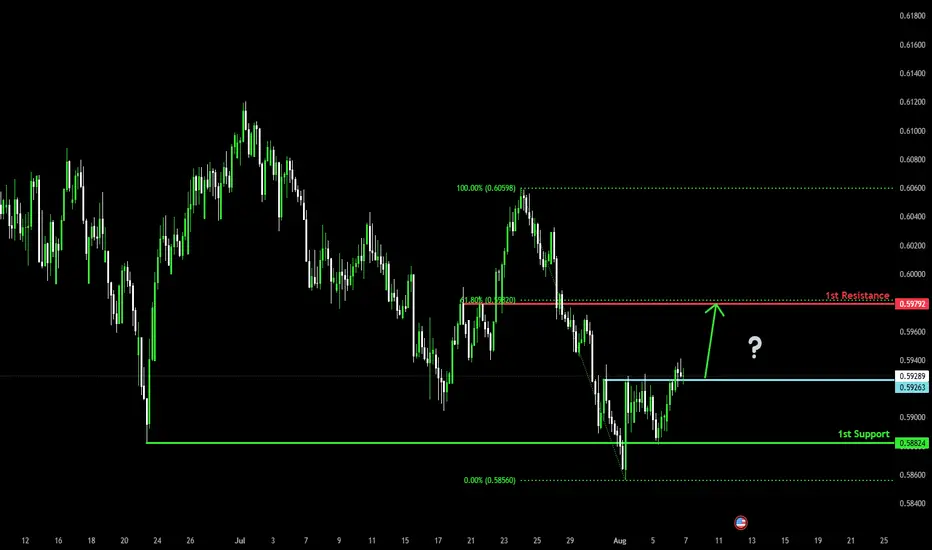
Could the Kiwi bounce from here?The price is falling towards the pivot, which is a pullback support and could potentially rise to the 1st resistance which aligns with the 61.8% Fibonacci retracement.
Pivot: 0.5926
1st Support: 0.5882
1st Resistance: 0.5979
Risk Warning:
Trading Forex and CFDs carries a high level of risk to your capital and you should only trade with money you can afford to lose. Trading Forex and CFDs may not be suitable for all investors, so please ensure that you fully understand the risks involved and seek independent advice if necessary.
Disclaimer:
The above opinions given constitute general market commentary, and do not constitute the opinion or advice of IC Markets or any form of personal or investment advice.
Any opinions, news, research, analyses, prices, other information, or links to third-party sites contained on this website are provided on an "as-is" basis, are intended only to be informative, is not an advice nor a recommendation, nor research, or a record of our trading prices, or an offer of, or solicitation for a transaction in any financial instrument and thus should not be treated as such. The information provided does not involve any specific investment objectives, financial situation and needs of any specific person who may receive it. Please be aware, that past performance is not a reliable indicator of future performance and/or results. Past Performance or Forward-looking scenarios based upon the reasonable beliefs of the third-party provider are not a guarantee of future performance. Actual results may differ materially from those anticipated in forward-looking or past performance statements. IC Markets makes no representation or warranty and assumes no liability as to the accuracy or completeness of the information provided, nor any loss arising from any investment based on a recommendation, forecast or any information supplied by any third-party.
NZD/USD - Double Bottom Breakout | Eyes on 0.6012 ResistanceNZD/USD is forming a classic double bottom reversal pattern, suggesting a shift in momentum after a sustained bearish trend. Price has recently broken structure (ChoCH) and is now pushing higher with a clear bullish market structure.
Key insights:
✅ Double Bottom confirmed with BOTTOM 1 and BOTTOM 2
✅ Clean break of structure (BOS) and bullish momentum emerging
🔼 Price is approaching a resistance zone near 0.6000 – 0.6012
🔁 Potential retest of the support zone around 0.5880 – 0.5900
🎯 Targeting the 0.6012 level if bullish structure holds
📈 Short-term bias: Bullish
📉 Watch for: Retest entries or signs of rejection at resistance

NZD/USD Faces Resistance at Daily Supply Zone Amid Rising Short On the daily chart, the NZD/USD pair has approached and responded to a significant supply zone. Notably, there has been a marked increase in short positions among non-commercial traders. These initial short entries were established in July, and current market dynamics suggest a potential continuation of the bearish trend. If, throughout this week, the Dollar Index gains momentum and sees an increase in long positions, it could further drive the NZD downward.
✅ Please share your thoughts about NZDUSD in the comments section below and HIT LIKE if you appreciate my analysis. Don't forget to FOLLOW ME; you will help us a lot with this small contribution.

NZD/USD edges higher, NZ inflation expectations inch lowerThe New Zealand dollar showed some strong gains earlier but couldn't consolidate. After rising as much as 0.50%, NZD/USD has retracted and is trading at 0.5939 in the North American session, up 0.17% on the day.
New Zealand's inflation expectations for the next two years ticked lower in the third quarter, falling to 2.28% from 2.29% in Q2. As well, one-year inflation expecations dipped to 2.37% from 2.41%.
These are not large decreases by any stretch, but the updated figures indicate that businesses expect inflation to ease slightly. The readings are within the Reserve Bank of New Zealand's inflation target band of 1%-3%.
Actual inflation rose by 2.7% in the second quarter, up from 2.5% in Q1. Again, this level is within the central bank's target band, where it has remained for a fourth consecutive quarter. Inflation may be a bit high for the Reserve Bank's liking, but it has made clear that it plans to continue lowering rates. The RBNZ held the benchmark rate at 3.25% last month but this was a "dovish hold" as the central bank said it expected to loosen policy if medium-term inflation continued to ease as expected.
NZD/USD tested resistance at 0.5950. Next, there is resistance at 0.5971
0.5921 and 0.5900 are providing support

New Zealand's unemployment rate rises to 4½ high, Kiwi pushes hiThe New Zealand dollar continues to have a quiet week. In the European session, NZD/USD is trading at 0.5923, up 0.37% on the day. The kiwi has been under pressure, falling 3.4% against the US dollar in July.
New Zealand's employment report for Q2 was pretty much as expected, but the news wasn't good. The unemployment rate rose to 5.2% from 5.1% in Q1, below the consensus of 5.3%. This marked the highest unemployment rate since Q3 2020. Employment Change declined by 0.1%, down from a 0.1% gain in Q1 and matching the consensus. This was the third decline in four quarters.
The weak figures point to growing slack in the labor market as the economy continues to struggle. Global trade tensions remain high and New Zealand's export-reliant economy has taken a hit from softer global demand.
The Reserve Bank of New Zealand will be paying close attention to the weak job numbers, which support a rate cut in order to provide a boost to the economy. The RBNZ maintained rates in July after lowering rates at six consecutive meetings. The conditions for a rate cut at the Aug. 20 meeting seem ripe and the markets have priced in a quarter-point reduction at around 85%.
We'll get an updated look at the inflation picture on Thursday. Inflation Expectations rose to 2.3% in the second quarter, the highest in a year. This is the final tier-1 release prior to the August rate meeting.
Three FOMC members will speak later today and investors will be hoping for some insights regarding the Federal Reserve's rate plans. The Fed hasn't lowered rates since December but is widely expected to hit the rate trigger at the September meeting.

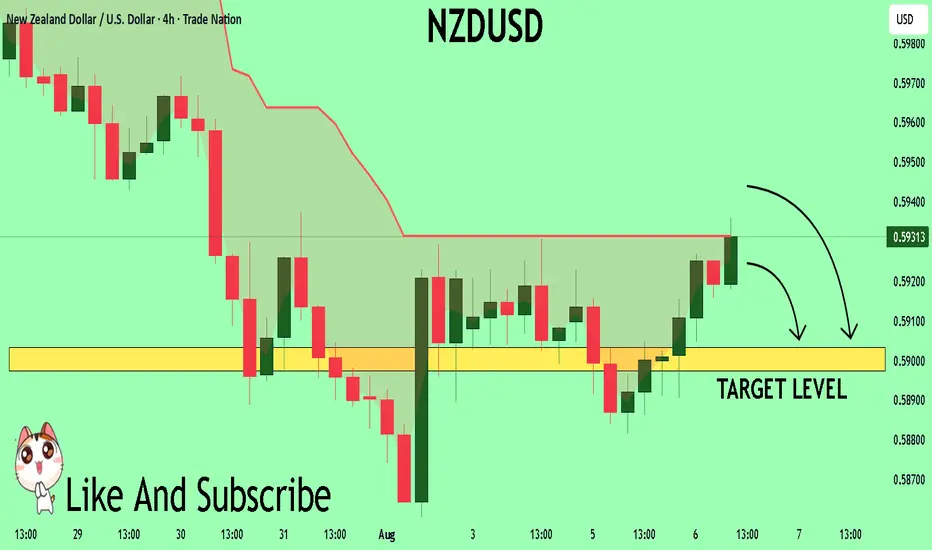
NZDUSD The Target Is DOWN! SELL!
My dear friends,
NZDUSD looks like it will make a good move, and here are the details:
The market is trading on 0.5932 pivot level.
Bias - Bearish
Technical Indicators: Supper Trend generates a clear short signal while Pivot Point HL is currently determining the overall Bearish trend of the market.
Goal - 0.5903
About Used Indicators:
Pivot points are a great way to identify areas of support and resistance, but they work best when combined with other kinds of technical analysis
Disclosure: I am part of Trade Nation's Influencer program and receive a monthly fee for using their TradingView charts in my analysis.
———————————
WISH YOU ALL LUCK
NZDUSD corrective pullback support at 0.5887The NZDUSD remains in a bullish trend, with recent price action showing signs of a corrective pullback within the broader uptrend.
Support Zone: 0.5887 – a key level from previous consolidation. Price is currently testing or approaching this level.
A bullish rebound from 0.5887 would confirm ongoing upside momentum, with potential targets at:
0.6020 – initial resistance
0.6040 – psychological and structural level
0.6056 – extended resistance on the longer-term chart
Bearish Scenario:
A confirmed break and daily close below 0.5887 would weaken the bullish outlook and suggest deeper downside risk toward:
0.5865 – minor support
0.5840 – stronger support and potential demand zone
Outlook:
Bullish bias remains intact while the NZDUSD holds above 0.5887 A sustained break below this level could shift momentum to the downside in the short term.
This communication is for informational purposes only and should not be viewed as any form of recommendation as to a particular course of action or as investment advice. It is not intended as an offer or solicitation for the purchase or sale of any financial instrument or as an official confirmation of any transaction. Opinions, estimates and assumptions expressed herein are made as of the date of this communication and are subject to change without notice. This communication has been prepared based upon information, including market prices, data and other information, believed to be reliable; however, Trade Nation does not warrant its completeness or accuracy. All market prices and market data contained in or attached to this communication are indicative and subject to change without notice.
