Kiwi H1 | Heading into a swing-high resistanceThe Kiwi (NZD/USD) is rising towards a swing-high resistance and could potentially reverse off this level to drop lower.
Sell entry is at 0.6092 which is a swing-high resistance that aligns with the 78.6% Fibonacci retracement.
Stop loss is at 0.6115 which is a level that sits above a swing-high resistance.
Take profit is at 0.6043 which is an overlap support.
High Risk Investment Warning
Trading Forex/CFDs on margin carries a high level of risk and may not be suitable for all investors. Leverage can work against you.
Stratos Markets Limited (tradu.com ):
CFDs are complex instruments and come with a high risk of losing money rapidly due to leverage. 63% of retail investor accounts lose money when trading CFDs with this provider. You should consider whether you understand how CFDs work and whether you can afford to take the high risk of losing your money.
Stratos Europe Ltd (tradu.com ):
CFDs are complex instruments and come with a high risk of losing money rapidly due to leverage. 63% of retail investor accounts lose money when trading CFDs with this provider. You should consider whether you understand how CFDs work and whether you can afford to take the high risk of losing your money.
Stratos Global LLC (tradu.com ):
Losses can exceed deposits.
Please be advised that the information presented on TradingView is provided to Tradu (‘Company’, ‘we’) by a third-party provider (‘TFA Global Pte Ltd’). Please be reminded that you are solely responsible for the trading decisions on your account. There is a very high degree of risk involved in trading. Any information and/or content is intended entirely for research, educational and informational purposes only and does not constitute investment or consultation advice or investment strategy. The information is not tailored to the investment needs of any specific person and therefore does not involve a consideration of any of the investment objectives, financial situation or needs of any viewer that may receive it. Kindly also note that past performance is not a reliable indicator of future results. Actual results may differ materially from those anticipated in forward-looking or past performance statements. We assume no liability as to the accuracy or completeness of any of the information and/or content provided herein and the Company cannot be held responsible for any omission, mistake nor for any loss or damage including without limitation to any loss of profit which may arise from reliance on any information supplied by TFA Global Pte Ltd.
The speaker(s) is neither an employee, agent nor representative of Tradu and is therefore acting independently. The opinions given are their own, constitute general market commentary, and do not constitute the opinion or advice of Tradu or any form of personal or investment advice. Tradu neither endorses nor guarantees offerings of third-party speakers, nor is Tradu responsible for the content, veracity or opinions of third-party speakers, presenters or participants.
NZDUSD trade ideas

NZDUSD LONG Market structure bullish on HTFs DW
Entry at both Daily and Weekly AOi
Weekly Rejection at AOi
Previous Weekly Structure Point
Daily Rejection at AOi
Previous Daily Structure Point
Around Psychological Level 0.60000
H4 Candlestick rejection
Levels 3.07
Entry 95%
REMEMBER : Trading is a Game Of Probability
: Manage Your Risk
: Be Patient
: Every Moment Is Unique
: Rinse, Wash, Repeat!
: Christ is King.

NZDUSD SELL IDEAPreparing for another day
Possible sell incoming
Proper risk management is advised
Pip full days ahead

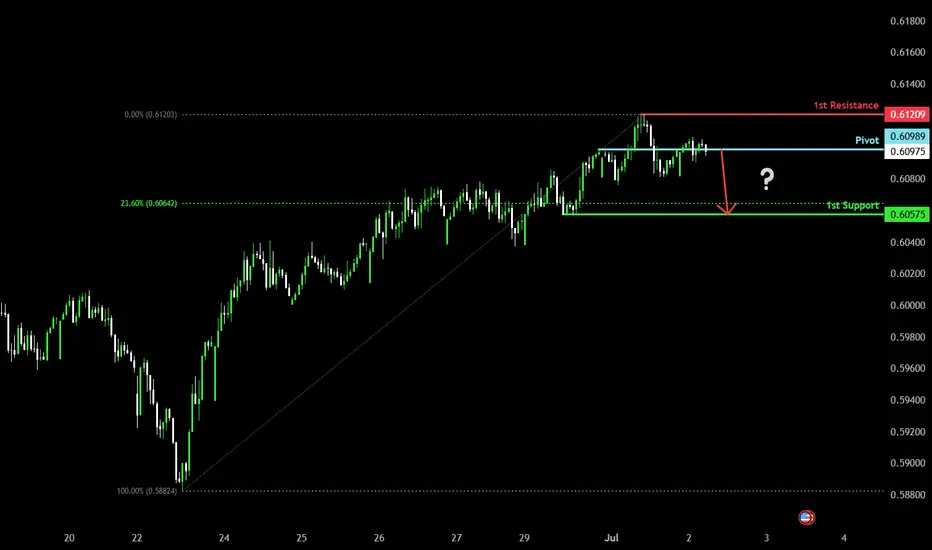
Heading into pullback resistance?The Kiwi (NZD/USD) is rising towards the pivot which is a pullback resistance and could reverse to the 1st support.
Pivot: 0.6103
1st Support: 0.6057
1st Resistance: 0.6120
Risk Warning:
Trading Forex and CFDs carries a high level of risk to your capital and you should only trade with money you can afford to lose. Trading Forex and CFDs may not be suitable for all investors, so please ensure that you fully understand the risks involved and seek independent advice if necessary.
Disclaimer:
The above opinions given constitute general market commentary, and do not constitute the opinion or advice of IC Markets or any form of personal or investment advice.
Any opinions, news, research, analyses, prices, other information, or links to third-party sites contained on this website are provided on an "as-is" basis, are intended only to be informative, is not an advice nor a recommendation, nor research, or a record of our trading prices, or an offer of, or solicitation for a transaction in any financial instrument and thus should not be treated as such. The information provided does not involve any specific investment objectives, financial situation and needs of any specific person who may receive it. Please be aware, that past performance is not a reliable indicator of future performance and/or results. Past Performance or Forward-looking scenarios based upon the reasonable beliefs of the third-party provider are not a guarantee of future performance. Actual results may differ materially from those anticipated in forward-looking or past performance statements. IC Markets makes no representation or warranty and assumes no liability as to the accuracy or completeness of the information provided, nor any loss arising from any investment based on a recommendation, forecast or any information supplied by any third-party.

NZD/USD Pulls Back to Snap Bullish Price SeriesNZD/USD snaps the recent series of higher highs and lows as it pulls back from a fresh yearly high (0.6120), and lack of momentum to hold above the 0.6040 (61.8% Fibonacci retracement) to 0.6070 (61.8% Fibonacci extension) zone may push the exchange rate toward the June low (0.5883).
Failure to defend the May low (0.5847) may lead to a test of 0.5830 (38.2% Fibonacci retracement), but NZD/USD may further retrace the decline from last year should it continue to close above the 0.6040 (61.8% Fibonacci retracement) to 0.6070 (61.8% Fibonacci extension) zone.
Need a move/close above the 0.6170 (50% Fibonacci extension) to 0.6190 (78.6% Fibonacci retracement) region brings the 0.6230 (50% Fibonacci extension) to 0.6260 (38.2% Fibonacci extension) zone on the radar, with the next area of interest coming in around the October high (0.6351).
--- Written by David Song, Senior Strategist at FOREX.com

NZDUSD sell idea Sellers are actively selling
price has given us a BOS
To the downside
Possible sell from our supply
A pair to watch out 😁
Happy trading

Potential bearish drop?The Kiwi (NZD/USD) is reacting off the pivot which is a pullback resistance and could drop to the 1st support.
Pivot: 0.6098
1st Support: 0.6057
1st Resistance: 0.6120
Risk Warning:
Trading Forex and CFDs carries a high level of risk to your capital and you should only trade with money you can afford to lose. Trading Forex and CFDs may not be suitable for all investors, so please ensure that you fully understand the risks involved and seek independent advice if necessary.
Disclaimer:
The above opinions given constitute general market commentary, and do not constitute the opinion or advice of IC Markets or any form of personal or investment advice.
Any opinions, news, research, analyses, prices, other information, or links to third-party sites contained on this website are provided on an "as-is" basis, are intended only to be informative, is not an advice nor a recommendation, nor research, or a record of our trading prices, or an offer of, or solicitation for a transaction in any financial instrument and thus should not be treated as such. The information provided does not involve any specific investment objectives, financial situation and needs of any specific person who may receive it. Please be aware, that past performance is not a reliable indicator of future performance and/or results. Past Performance or Forward-looking scenarios based upon the reasonable beliefs of the third-party provider are not a guarantee of future performance. Actual results may differ materially from those anticipated in forward-looking or past performance statements. IC Markets makes no representation or warranty and assumes no liability as to the accuracy or completeness of the information provided, nor any loss arising from any investment based on a recommendation, forecast or any information supplied by any third-party.
SELL NZDUSDNZDUSD price has been gradually moving up this channel and price has reached a resistance. Signs of a possible reversal are there, enter now and on the break of the trend line

NZDUSD to continue in the upward move?NZDUSD - 24h expiry
There is no clear indication that the upward move is coming to an end.
Although we remain bullish overall, a correction is possible with plenty of room to move lower without impacting the trend higher.
Risk/Reward would be poor to call a buy from current levels.
A move through 0.6100 will confirm the bullish momentum.
The measured move target is 0.6130.
We look to Buy at 0.6075 (stop at 0.6050)
Our profit targets will be 0.6125 and 0.6130
Resistance: 0.6100 / 0.6125 / 0.6130
Support: 0.6075 / 0.6060 / 0.6050
Risk Disclaimer
The trade ideas beyond this page are for informational purposes only and do not constitute investment advice or a solicitation to trade. This information is provided by Signal Centre, a third-party unaffiliated with OANDA, and is intended for general circulation only. OANDA does not guarantee the accuracy of this information and assumes no responsibilities for the information provided by the third party. The information does not take into account the specific investment objectives, financial situation, or particular needs of any particular person. You should take into account your specific investment objectives, financial situation, and particular needs before making a commitment to trade, including seeking advice from an independent financial adviser regarding the suitability of the investment, under a separate engagement, as you deem fit.
You accept that you assume all risks in independently viewing the contents and selecting a chosen strategy.
Where the research is distributed in Singapore to a person who is not an Accredited Investor, Expert Investor or an Institutional Investor, Oanda Asia Pacific Pte Ltd (“OAP“) accepts legal responsibility for the contents of the report to such persons only to the extent required by law. Singapore customers should contact OAP at 6579 8289 for matters arising from, or in connection with, the information/research distributed.

NZDUSD Breakout Needs to GrowthNZD/USD Technical Outlook
NZD/USD shows early signs of a potential shift from distribution to accumulation, indicating a possible bullish breakout. This setup is forming against the backdrop of a weakened U.S. Dollar, which continues to trend downward, providing fundamental support to NZD strength.
The pair has been consolidating within a distribution pattern, but current chart signals suggest a buildup in bullish pressure. If the pair breaks above the consolidation range, it may trigger a rally supported by dollar weakness and renewed buying interest in risk-sensitive assets like the Kiwi.
Key Levels to Watch:
Resistance: 0.61500 / 0.6260
You may find more details in the chart Ps Support with like and comments for more analysis.

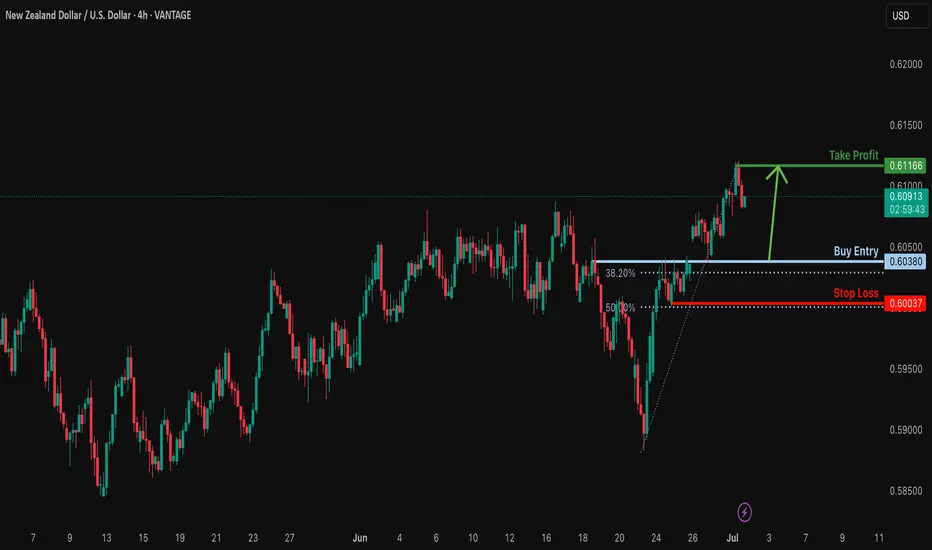
Bullish bounce?NZD/USD is falling towards the support level which is an overlap support that is slightly above the 38.2% Fibonacci retracement and could bounce from this level to our take profit.
Entry: 0.6038
Why we like it:
There is an overlap support that is slightly above the 38.2% Fibonacci retracement.
Stop loss: 0.6038
Why we like it:
There is a pullback support that aligns with the 50% Fibonacci retracement.
Take profit: 0.6116
Why we like it:
There is a pullback resistance.
Enjoying your TradingView experience? Review us!
Please be advised that the information presented on TradingView is provided to Vantage (‘Vantage Global Limited’, ‘we’) by a third-party provider (‘Everest Fortune Group’). Please be reminded that you are solely responsible for the trading decisions on your account. There is a very high degree of risk involved in trading. Any information and/or content is intended entirely for research, educational and informational purposes only and does not constitute investment or consultation advice or investment strategy. The information is not tailored to the investment needs of any specific person and therefore does not involve a consideration of any of the investment objectives, financial situation or needs of any viewer that may receive it. Kindly also note that past performance is not a reliable indicator of future results. Actual results may differ materially from those anticipated in forward-looking or past performance statements. We assume no liability as to the accuracy or completeness of any of the information and/or content provided herein and the Company cannot be held responsible for any omission, mistake nor for any loss or damage including without limitation to any loss of profit which may arise from reliance on any information supplied by Everest Fortune Group.
NZDUSD OVERVIEWI am bullish on NZDUSD,I am looking for more Demands.Price touched my 15minute Demand during Asia and has been pushing up

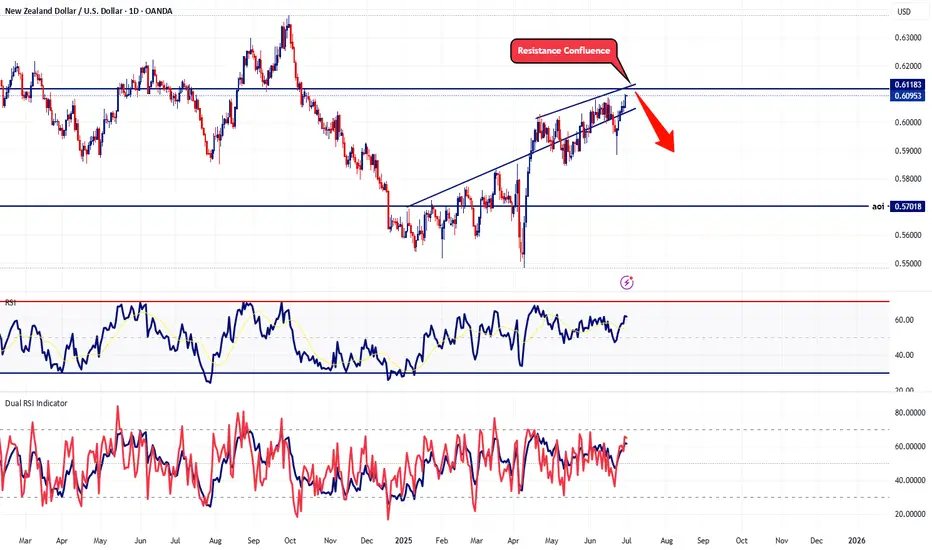
Preparing to Short Sell NZDUSD - Large LotsThis pair doesn't really get much attention but the fact is that the US is the strongest country of the majors while New Zealand is actually the weakest. When I pooled together all the economic data, these are the facts.
With that said, this pair is approaching a significant confluence resistance territory and it's highly unlikely to break above. Needless to say, I'm preparing to start scaling shorts with this pair. As I mentioned in the title, since this pair doesn't get much daily pip action, I'll be increasing my lot sizes to make up the difference.
That's it - That's all
Trade Safe
NZDUSD → Pre-breakout consolidation. One step away from a rallyFX:NZDUSD is consolidating, but the chart shows signs of readiness to shift to a distribution phase, which could lead to a rally.
Against the backdrop of a falling dollar, which is continuing its main trend, the NZD may break out of consolidation in a distribution pattern. Since the accumulation is quite large (taking into account the long squeeze), the trend may be strong.
A pre-breakout consolidation is forming relative to 0.6080, followed by the price breaking through the resistance of the global trading range. Consolidation above 0.6080 will confirm the breakdown of the structure, which could trigger distribution
Resistance levels: 0.6080, 0.612
Support levels: 0.6062, 0.604
The price may be supported by a bullish trend and a decline in the dollar. A breakout from the 4-month consolidation may be accompanied by a continuation of the uptrend until the intermediate high of 0.6355 is reached in the medium term.
Best regards, R. Linda!

Trading Recommendations for NZD/USDNZD/USD remain in a dominant bullish wave that began in April. Wave extremes from a "horizontal pennant" on the chart. The bearish phase since May 26 remains a part of internal correction. The bullish leg from June 23 has reversal potential.
Weekly Forecast:
The pair is likely to continue its upward movement for a few more days. A sideways trend and reversal conditions are expected near the resistance zone. Downward movement becomes more probable in the second half of week.
Potential Reversal Zones
Resistance: 0.6070 / 0.6120
Support: / 0.5940 / 0.5890
Recommendations:
Selling: Low potential and potentially risky.
Buying: Can be considered if reversal signals appear near the support zone.

NZDUSD bullish momentum resistance at 0.6100Trend Overview:
The NZDUSD currency price remains in a bullish trend, characterised by higher highs and higher lows. The recent intraday price action is forming a continuation consolidation pattern, suggesting a potential pause before a renewed move higher.
Key Technical Levels:
Support: 0.6000 (primary pivot), followed by 0.5985 and 0.5950
Resistance: 0.6100 (initial), then 0.6140 and 0.6180
Technical Outlook:
A pullback to the 0.6000 level, which aligns with the previous consolidation zone, could act as a platform for renewed buying interest. A confirmed bounce from this support may trigger a continuation toward the next resistance levels at 0.6100, 0.6140, and ultimately 0.6180.
Conversely, a daily close below 0.6000 would suggest weakening bullish momentum. This scenario would shift the bias to bearish in the short term, potentially targeting 0.5985 and 0.5950 as downside levels.
Conclusion:
NZDUSD maintains a bullish structure while trading above the 0.6000 support. A bounce from this level would validate the consolidation as a continuation pattern, with upside potential toward the 0.6100 area. A breakdown below 0.6000, however, would invalidate this view and suggest deeper corrective risk.
This communication is for informational purposes only and should not be viewed as any form of recommendation as to a particular course of action or as investment advice. It is not intended as an offer or solicitation for the purchase or sale of any financial instrument or as an official confirmation of any transaction. Opinions, estimates and assumptions expressed herein are made as of the date of this communication and are subject to change without notice. This communication has been prepared based upon information, including market prices, data and other information, believed to be reliable; however, Trade Nation does not warrant its completeness or accuracy. All market prices and market data contained in or attached to this communication are indicative and subject to change without notice.

NZDUSD Elliotwave Update: Is wave 2 complete?We have seen from our previous count price made a leading diagonal and have pulled back down with 3 waves. The question is whether the correction is complete and we have already resumed the bullish momentum. Us long us we are not taking the previous high then we should expect price to pullback down to complete wave 2 at 38.2 fib. If we are correct then we should expect price to drop in the coming days.

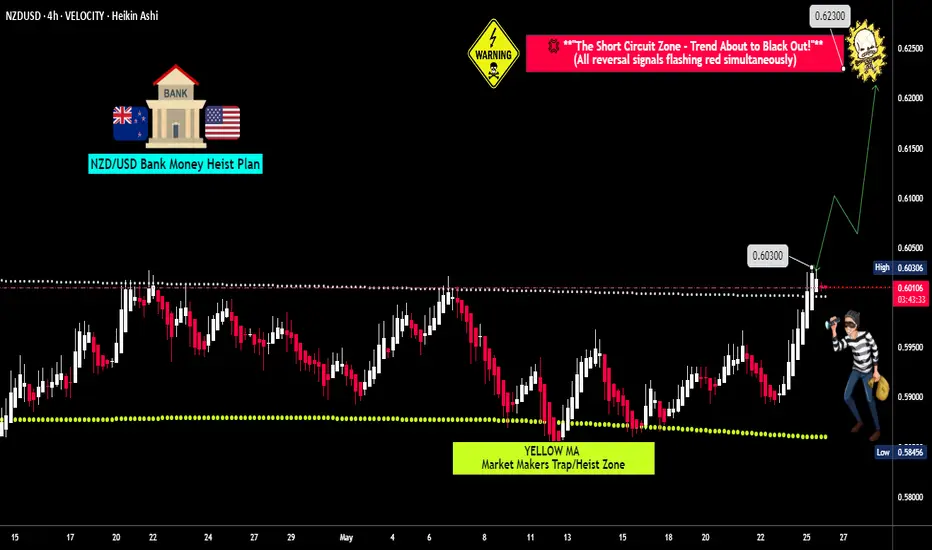
Is This the Next Big Heist? Thief Trader Eyes NZD/USD Long SetupThief Trader’s NZD/USD Heist Plan – Long Setup in Play!
🌍 **Hello Global Wealth Warriors!**
Hello, Bonjour, Ciao, Salut, Guten Tag, Ola!
📢 **Fellow Profit Pirates & Market Mavericks**, it’s time to set sail again! Get ready to loot the forex seas with our latest **Thief Trader Strategy** targeting the **NZD/USD (The Kiwi)** pair.
---
🔎 **Trade Overview**
💥 Setup: Long Entry Plan – Executing our cunning blueprint with Thief Trading's sharp technical & fundamental intel**.
🎯 Target: 0.62300 (or exit just before for safety).
⚠️ Danger Zone: Watch for traps at the RED Zone Level – signs of overbought conditions, consolidation, trend flips & bearish setups.
---
🟢 **Entry Signal** – *The Heist Begins!*
📈 **Primary Entry**:
> Breakout above **MA Line (0.60300)** = Bullish move → *Place a Buy Stop above ATR Line*
📉 **Pullback Option**:
> *Buy Limit* at recent swing low/high on **15 or 30-min TF**.
📌 **Pro Tip**:
Set an **Alert** on your chart to catch the breakout live. Timing is everything!
---
🛑 **Stop Loss – The Getaway Plan**
📍 **SL Recommendation**:
> Recent swing low on the **4H chart (0.59400)** for day/swing trades.
> 🎯 Customize your SL based on risk, lot size, and total orders.
---
🔐 **Scalpers vs. Swingers**
👀 **Scalpers**: Focus ONLY on long-side plays.
💰 Got deep pockets? Dive in.
😎 Otherwise, swing traders – this is your golden moment. Trail your SL to protect profits.
🌐 **Market Pulse** – Momentum Watch
📊 Kiwi is navigating a **MA Resistance Zone**, but bullish bias remains due to:
* **Fundamentals**
* **Macro Insights**
* **COT Reports**
* **Sentiment & Intermarket Trends**
* **Quant Analysis + Overall Score**
📎 Check the linkks for detailed breakdown.
📰 **News Warning!**
⚠️ Major releases ahead?
* Pause entries.
* Protect trades with **trailing SLs**.
---
🚨 **Join the Next Heist with Thief Trading!**
💥 Smash that **Boost** or **Like** to join our profit squad.
With **Thief Trader Style**, we dominate the markets DAILY.
Your support fuels our mission. ❤️💼
---
💸 Stay ready for the next move, money-makers.
🎯 Eyes on the chart – timing is profit.
Bearish bias on NZDUSD Double tops at key resistance
- lower highs and lower lows formation
- 50 ema cross and above price
- 50% - 61.8% fib level

NZD/USD Short Setup – Quick Play Ahead!🔻 NZD/USD Short Setup – Quick Play Ahead!
The Kiwi pair is showing signs of exhaustion near key resistance levels, and bearish momentum is building up.
I'm currently eyeing a short-term sell position with a target at 0.60180.
If price action confirms this setup, we could see a clean move toward that zone.
📉 Watch for rejection signals and manage risk wisely.
👉 Follow for more sharp entries, clean technicals, and daily FX setups!

NZDUSD BuY Now SETUPNZDUSD BuY Now SETUP based on Double bottom Pattern level appeared at Support Level Which is Potential Reversal Zone as per Recent History, Accoringly atleast 50% Target is expected to be acheived based on this Setup. :) what are your thoughts?

short nzdusdnzdusd should continue it's bearishness if price comes below the white line i have plotted. once it does, im expecting it to continue selling for the rest of today at least. if it doesn't cross the white line in the next few hours, STAY OUT

Kiwi H4 | Falling toward a pullback supportThe Kiwi (NZD/USD) is falling towards a pullback support and could potentially bounce off this level to climb higher.
Buy entry is at 0.6038 which is a pullback support.
Stop loss is at 0.5995 which is a level that lies underneath an overlap support and the 38.2% Fibonacci retracement.
Take profit is at 0.6079 which is a multi-swing-high resistance that aligns closely with the 161.8% Fibonacci extension.
High Risk Investment Warning
Trading Forex/CFDs on margin carries a high level of risk and may not be suitable for all investors. Leverage can work against you.
Stratos Markets Limited (tradu.com ):
CFDs are complex instruments and come with a high risk of losing money rapidly due to leverage. 63% of retail investor accounts lose money when trading CFDs with this provider. You should consider whether you understand how CFDs work and whether you can afford to take the high risk of losing your money.
Stratos Europe Ltd (tradu.com ):
CFDs are complex instruments and come with a high risk of losing money rapidly due to leverage. 63% of retail investor accounts lose money when trading CFDs with this provider. You should consider whether you understand how CFDs work and whether you can afford to take the high risk of losing your money.
Stratos Global LLC (tradu.com ):
Losses can exceed deposits.
Please be advised that the information presented on TradingView is provided to Tradu (‘Company’, ‘we’) by a third-party provider (‘TFA Global Pte Ltd’). Please be reminded that you are solely responsible for the trading decisions on your account. There is a very high degree of risk involved in trading. Any information and/or content is intended entirely for research, educational and informational purposes only and does not constitute investment or consultation advice or investment strategy. The information is not tailored to the investment needs of any specific person and therefore does not involve a consideration of any of the investment objectives, financial situation or needs of any viewer that may receive it. Kindly also note that past performance is not a reliable indicator of future results. Actual results may differ materially from those anticipated in forward-looking or past performance statements. We assume no liability as to the accuracy or completeness of any of the information and/or content provided herein and the Company cannot be held responsible for any omission, mistake nor for any loss or damage including without limitation to any loss of profit which may arise from reliance on any information supplied by TFA Global Pte Ltd.
The speaker(s) is neither an employee, agent nor representative of Tradu and is therefore acting independently. The opinions given are their own, constitute general market commentary, and do not constitute the opinion or advice of Tradu or any form of personal or investment advice. Tradu neither endorses nor guarantees offerings of third-party speakers, nor is Tradu responsible for the content, veracity or opinions of third-party speakers, presenters or participants.
