Short possibility in NZDUSDA confirmation in the FVG can create more bear interests
Watchout for this zone
NZDUSD trade ideas

NZDUSD BUY SETUP – GLOBAL HORNS 🇳🇿 NZDUSD BUY SETUP – GLOBAL HORNS
🕐 Timeframe: 1H
📈 Direction: BUY
📍 Entry: 0.6012 (active)
🎯 Target: 0.6033
📊 Context:
Price swept the lows and tapped into a prior structural zone. I’m positioned for a short-term rebound into the 0.6033 area, where liquidity likely sits from previous consolidations.
📌 As always, I manage these trades based on price action and time — not using traditional stops.
#GlobalHorns #NZDUSD #ForexTrade

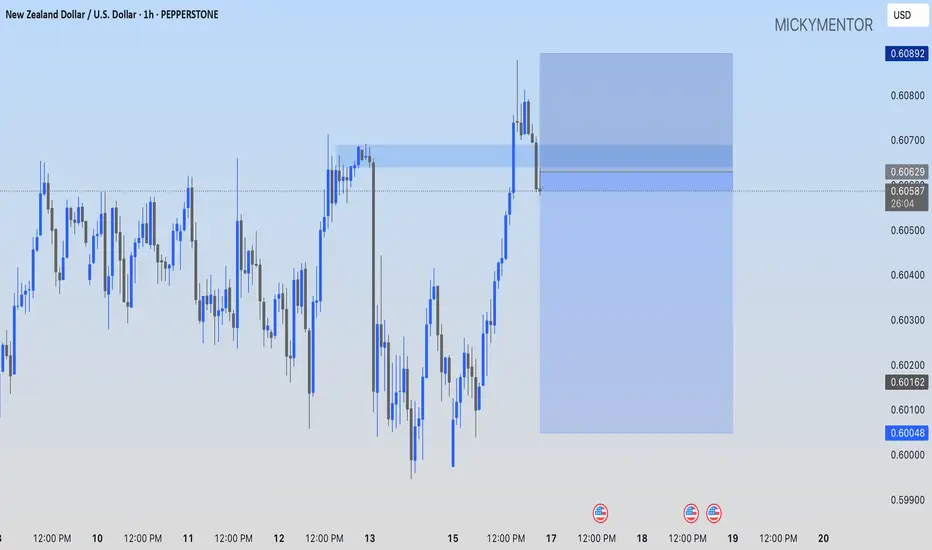
NZDUSD: A SELL TRADE IDEAPEPPERSTONE:NZDUSD I'm selling at current market price, targeting 0.60048 price level
NZDUSD SHORTMarket structure bearish on HTFs DW
Entry at both Weekly and Daily AOi
Weekly Rejection At AOi
Daily Rejection at AOi
Previous Structure point Daily
Around Psychological Level 0.59500
H4 EMA retest
H4 Candlestick rejection
Rejection from Previous structure
Levels 4.48
Entry 100%
REMEMBER : Trading is a Game Of Probability
: Manage Your Risk
: Be Patient
: Every Moment Is Unique
: Rinse, Wash, Repeat!
: Christ is King.

NZDUSD BUY OPPORTUNITY The Retest to the neckline of 0.58677 is completed! Therefore, I anticipate more bullish price action to continue. This further increases the bullish probability as we’ve transitioned from downtrend to uptrend. A buy opportunity is envisaged upon seeing a correction in intraday timeframe (H4)

NZDUSDSell. MArket Execution. trade 1:2. risk 0.50%
We are going in sell because of the market respecting que sellers zone.

Nzdusd update We still await the pullback to our fib levels. Let's see how it unfolds in the coming market sessions

Kiwi H1 | Potential bounce off an overlap supportThe Kiwi (NZD/USD) is falling towards an overlap support and could potentially bounce off this level to climb higher.
Buy entry is at 0.6051 which is an overlap support.
Stop loss is at 0.6025 which is a level that lies underneath a pullback support and the 61.8% Fibonacci retracement.
Take profit is at 0.6077 which is a swing-high resistance.
High Risk Investment Warning
Trading Forex/CFDs on margin carries a high level of risk and may not be suitable for all investors. Leverage can work against you.
Stratos Markets Limited (tradu.com ):
CFDs are complex instruments and come with a high risk of losing money rapidly due to leverage. 63% of retail investor accounts lose money when trading CFDs with this provider. You should consider whether you understand how CFDs work and whether you can afford to take the high risk of losing your money.
Stratos Europe Ltd (tradu.com ):
CFDs are complex instruments and come with a high risk of losing money rapidly due to leverage. 63% of retail investor accounts lose money when trading CFDs with this provider. You should consider whether you understand how CFDs work and whether you can afford to take the high risk of losing your money.
Stratos Global LLC (tradu.com ):
Losses can exceed deposits.
Please be advised that the information presented on TradingView is provided to Tradu (‘Company’, ‘we’) by a third-party provider (‘TFA Global Pte Ltd’). Please be reminded that you are solely responsible for the trading decisions on your account. There is a very high degree of risk involved in trading. Any information and/or content is intended entirely for research, educational and informational purposes only and does not constitute investment or consultation advice or investment strategy. The information is not tailored to the investment needs of any specific person and therefore does not involve a consideration of any of the investment objectives, financial situation or needs of any viewer that may receive it. Kindly also note that past performance is not a reliable indicator of future results. Actual results may differ materially from those anticipated in forward-looking or past performance statements. We assume no liability as to the accuracy or completeness of any of the information and/or content provided herein and the Company cannot be held responsible for any omission, mistake nor for any loss or damage including without limitation to any loss of profit which may arise from reliance on any information supplied by TFA Global Pte Ltd.
The speaker(s) is neither an employee, agent nor representative of Tradu and is therefore acting independently. The opinions given are their own, constitute general market commentary, and do not constitute the opinion or advice of Tradu or any form of personal or investment advice. Tradu neither endorses nor guarantees offerings of third-party speakers, nor is Tradu responsible for the content, veracity or opinions of third-party speakers, presenters or participants.

Bullish bounce?The Kiwi (NZD/USD) is falling towards the pivot and could bounce to the 127.2% Fibonacci resistance.
Pivot: 0.6036
1st Support: 0.6002
1st Resistance: 0.6093
Risk Warning:
Trading Forex and CFDs carries a high level of risk to your capital and you should only trade with money you can afford to lose. Trading Forex and CFDs may not be suitable for all investors, so please ensure that you fully understand the risks involved and seek independent advice if necessary.
Disclaimer:
The above opinions given constitute general market commentary, and do not constitute the opinion or advice of IC Markets or any form of personal or investment advice.
Any opinions, news, research, analyses, prices, other information, or links to third-party sites contained on this website are provided on an "as-is" basis, are intended only to be informative, is not an advice nor a recommendation, nor research, or a record of our trading prices, or an offer of, or solicitation for a transaction in any financial instrument and thus should not be treated as such. The information provided does not involve any specific investment objectives, financial situation and needs of any specific person who may receive it. Please be aware, that past performance is not a reliable indicator of future performance and/or results. Past Performance or Forward-looking scenarios based upon the reasonable beliefs of the third-party provider are not a guarantee of future performance. Actual results may differ materially from those anticipated in forward-looking or past performance statements. IC Markets makes no representation or warranty and assumes no liability as to the accuracy or completeness of the information provided, nor any loss arising from any investment based on a recommendation, forecast or any information supplied by any third-party.

NZDUSD - Trade Re-cap Take a look at the NZDUSD trade re-cap.
Here I explain exactly what I was looking for in getting this 1:10RR trade from start to finish.
Hope this helps

NZDUSD IDEAWe've gotten a new higher high/break of structure to the upside.
Waiting for a pullback to our Fibonacci level for a continuation to the upside

NZDUSD to continue in the upward move?NZDUSD - 24h expiry
There is no clear indication that the upward move is coming to an end.
Although we remain bullish overall, a correction is possible with plenty of room to move lower without impacting the trend higher.
Risk/Reward would be poor to call a buy from current levels.
A move through 0.6085 will confirm the bullish momentum.
The measured move target is 0.6125.
We look to Buy at 0.6050 (stop at 0.6025)
Our profit targets will be 0.6100 and 0.6125
Resistance: 0.6085 / 0.6100 / 0.6125
Support: 0.6060 / 0.6050 / 0.6025
Risk Disclaimer
The trade ideas beyond this page are for informational purposes only and do not constitute investment advice or a solicitation to trade. This information is provided by Signal Centre, a third-party unaffiliated with OANDA, and is intended for general circulation only. OANDA does not guarantee the accuracy of this information and assumes no responsibilities for the information provided by the third party. The information does not take into account the specific investment objectives, financial situation, or particular needs of any particular person. You should take into account your specific investment objectives, financial situation, and particular needs before making a commitment to trade, including seeking advice from an independent financial adviser regarding the suitability of the investment, under a separate engagement, as you deem fit.
You accept that you assume all risks in independently viewing the contents and selecting a chosen strategy.
Where the research is distributed in Singapore to a person who is not an Accredited Investor, Expert Investor or an Institutional Investor, Oanda Asia Pacific Pte Ltd (“OAP“) accepts legal responsibility for the contents of the report to such persons only to the extent required by law. Singapore customers should contact OAP at 6579 8289 for matters arising from, or in connection with, the information/research distributed.

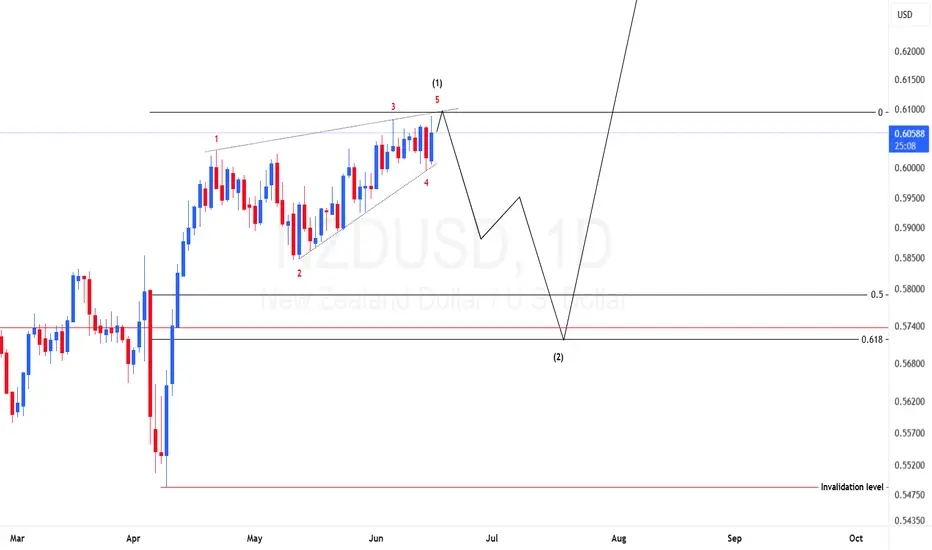
NZDUSD Elliotwaves CountPrice have unfolded the leading diagonal structure and we have seen signs of bullish weakness. If we are correct we should expect price to drop to at least the golden zone before resuming the bullish momentum.
NZDUSD → Correction and liquidity capture ahead of growthFX:NZDUSD , following a sharp decline during the Pacific-Asian session, is testing the support of the upward trend and the liquidity zone...
The dollar is correcting amid escalating tensions in the Middle East. This is a temporary move, and the market may return to its main trend. The currency pair is forming a false breakdown of support
Against the backdrop of an uptrend and a weak dollar, the currency pair is testing support at 0.6000. The reaction is weak at the moment, but there is a chance for growth if the price consolidates above 0.6020. I do not rule out a retest of the liquidity zone at 0.5989 before growth
Support levels: 0.6000, 0.5989
Resistance levels: 0.6068
The inability to continue falling and the formation of a local reversal structure relative to 0.6000 (price consolidation above 0.6020) may support the market. I do not rule out that the market may decline to the liquidity zone of 0.5989 before rising.
Best regards, R. Linda!

NZDUSD Expecting ahead of GrowthNZDUSD Market Outlook
NZD/USD experienced a sharp decline during the Pacific and Asian sessions and is now testing support along its established upward trendline. This downward move appears to be a temporary correction, occurring amid broader U.S. dollar weakness and escalating geopolitical tensions in the Middle East.
Resistance zone 0.61200
Support Level 0.59800
Despite the recent drop, the overall trend for NZD/USD remains bullish, with the pair likely to find support at key technical levels. The correction in the U.S. dollar could offer further upside potential for the New Zealand dollar if the broader trend persists.
you may find more details in the chart Ps Support with like and comments for modify Thanks.

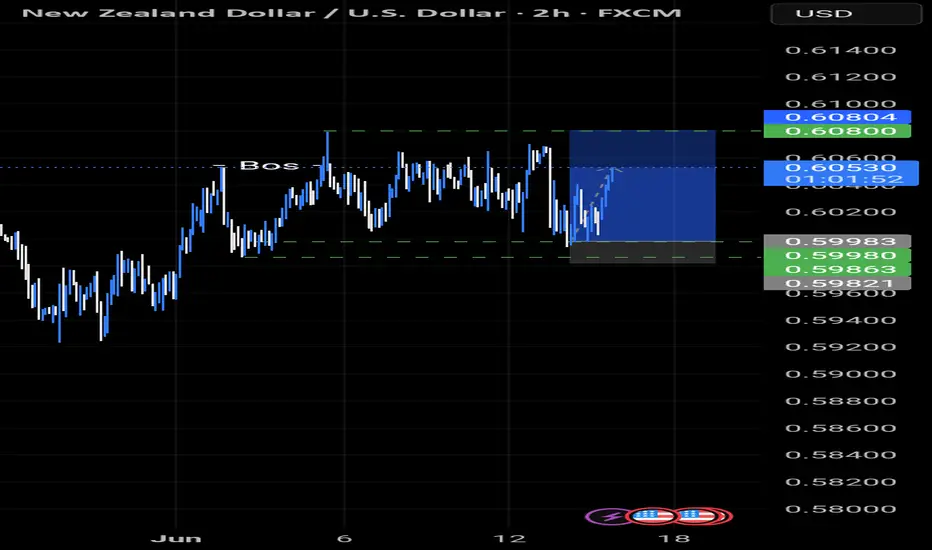
NZD/USD LongTechnical Analysis:
Initial Structure Shift: The chart reveals a significant low in late May, followed by a decisive break of structure (BOS) above a prior high (near the first green dot). This confirms a bullish market transition, indicating strong buying pressure.
Change of Character (CHOCH) Confirmation: The subsequent rally, marked by a sharp upward move, solidifies the change of character, with price sustaining above the BOS level. This reflects institutional intent to drive the market higher.
Resistance Zone Identification: Price has now approached a critical resistance level near 0.6090 (dashed line), where it has tested equal highs multiple times. This zone represents a potential pivot point for supply to emerge.
Momentum and Consolidation: The recent steep ascent, highlighted by the upward arrow, demonstrates robust momentum. However, the tightening of price action near resistance suggests a consolidation phase, offering a strategic entry opportunity.
Given the overall bullish trend, await a pullback to the 0.6070 support level. Enter the trade only after a bullish candle close confirms acceptance. Adjust your position size according to your risk parameters, and consider trailing your stop if momentum persists beyond 0.6090. Be prepared to exit if price rejects at resistance, indicating a potential shift.

NZDUSD: Market of Sellers
The analysis of the NZDUSD chart clearly shows us that the pair is finally about to tank due to the rising pressure from the sellers.
Disclosure: I am part of Trade Nation's Influencer program and receive a monthly fee for using their TradingView charts in my analysis.
❤️ Please, support our work with like & comment! ❤️

Nzdusd update (Price and Fibonacci)The trade on nzdusd just took us out on profit. T.P has been hit.
After proper analysis and patiently waiting for the market to come to us, we were able to capitalize on this move to the upside and we're out with some profit.

NZDUSD Bullish consolidation breakout supported at 0.6000Trend Overview:
The NZDUSD currency price remains in a bullish trend, characterised by higher highs and higher lows. The recent intraday price action is forming a continuation consolidation pattern, suggesting a potential pause before a renewed move higher.
Key Technical Levels:
Support: 0.6000 (primary pivot), followed by 0.5985 and 0.5950
Resistance: 0.6100 (initial), then 0.6140 and 0.6180
Technical Outlook:
A pullback to the 0.6000 level, which aligns with the previous consolidation zone, could act as a platform for renewed buying interest. A confirmed bounce from this support may trigger a continuation toward the next resistance levels at 0.6100, 0.6140, and ultimately 0.6180.
Conversely, a daily close below 0.6000 would suggest weakening bullish momentum. This scenario would shift the bias to bearish in the short term, potentially targeting 0.5985 and 0.5950 as downside levels.
Conclusion:
NZDUSD maintains a bullish structure while trading above the 0.6000 support. A bounce from this level would validate the consolidation as a continuation pattern, with upside potential toward the 0.6100 area. A breakdown below 0.6000, however, would invalidate this view and suggest deeper corrective risk.
This communication is for informational purposes only and should not be viewed as any form of recommendation as to a particular course of action or as investment advice. It is not intended as an offer or solicitation for the purchase or sale of any financial instrument or as an official confirmation of any transaction. Opinions, estimates and assumptions expressed herein are made as of the date of this communication and are subject to change without notice. This communication has been prepared based upon information, including market prices, data and other information, believed to be reliable; however, Trade Nation does not warrant its completeness or accuracy. All market prices and market data contained in or attached to this communication are indicative and subject to change without notice.

Long trade
1Hr TF
🟢 NZDUSD – Buyside Trade
Date: Monday, 16th June 2025
Session: London Session AM
Time: 5:00 AM
Entry Timeframe: 1Hr TF
Trade Parameters
Entry: 0.60429
Take Profit: 0.60684 (+0.42%)
Stop Loss: 0.60347 (−0.13%)
Risk-Reward Ratio (RR): 3.23
🧠 Trade Reasoning
The trade was initiated on a 1-hour bullish continuation setup, with price finding firm support around the 0.60350 level — a previously swept liquidity zone and minor structural demand.

NZDUSD - BULLISH MOVE !Hello Traders !
On Monday 9 June, The NZDUSD broke the resistance level (0.60380 - 0.60072).
This key level becomes new support !
So, I expect a bullish move🚀
_________________
TARGET: 0.61050🎯

Nzdusd update On nzdusd, we're clear to the upside.
Trade management is key to ensure profits are maximized properly
NZD/USD BEARS ARE STRONG HERE|SHORT
NZD/USD SIGNAL
Trade Direction: short
Entry Level: 0.605
Target Level: 0.602
Stop Loss: 0.606
RISK PROFILE
Risk level: medium
Suggested risk: 1%
Timeframe: 1h
Disclosure: I am part of Trade Nation's Influencer program and receive a monthly fee for using their TradingView charts in my analysis.
✅LIKE AND COMMENT MY IDEAS✅
