NZDUSD Wave Analysis – 3 June 2025
- NZDUSD reversed from the resistance zone
- Likely to fall to support level 0.5900
NZDUSD currency pair recently reversed down from the resistance zone between the resistance level 0.6030 (which has been reversing the price from November), the upper daily Bollinger Band and the 61.8% Fibonacci correction of the downward impulse from September.
The downward reversal from this resistance zone stopped the C-wave of the previous ABC correction (2).
Given the strength of the resistance level of 0.6030 and the bearish divergence on the daily Stochastic, the NZDUSD currency pair can be expected to fall to the next support level of 0.5900.
NZDUSD trade ideas

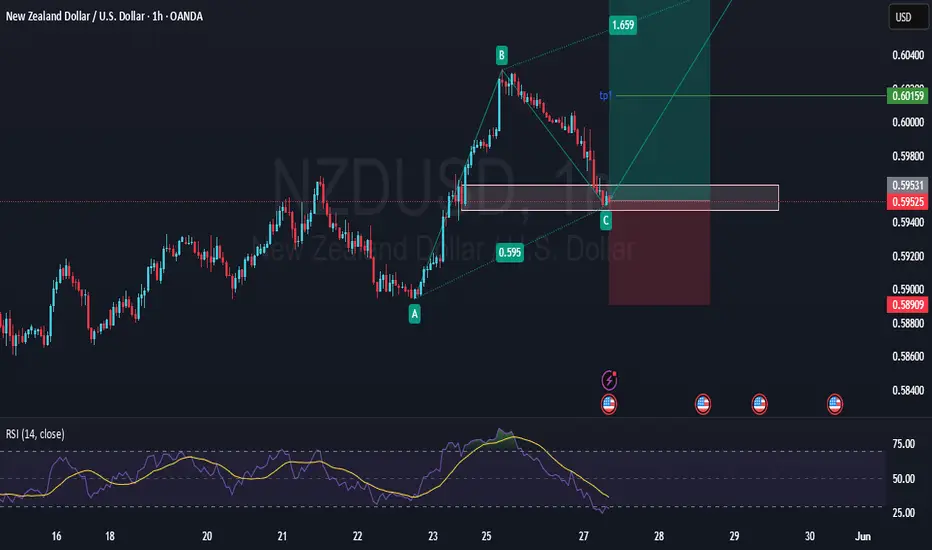
Potential bearish drop?NZD/USD is reacting off the resistance level which is a pullback resistance and could drop from this level to our take profit.
Entry: 0.6011
Why we like it:
There is a pullback resistance level.
Stop loss: 0.6051
Why we like it:
There is a pullback resistance level.
Take profit: 0.5950
Why we like it:
There is a pullback support level.
Enjoying your TradingView experience? Review us!
Please be advised that the information presented on TradingView is provided to Vantage (‘Vantage Global Limited’, ‘we’) by a third-party provider (‘Everest Fortune Group’). Please be reminded that you are solely responsible for the trading decisions on your account. There is a very high degree of risk involved in trading. Any information and/or content is intended entirely for research, educational and informational purposes only and does not constitute investment or consultation advice or investment strategy. The information is not tailored to the investment needs of any specific person and therefore does not involve a consideration of any of the investment objectives, financial situation or needs of any viewer that may receive it. Kindly also note that past performance is not a reliable indicator of future results. Actual results may differ materially from those anticipated in forward-looking or past performance statements. We assume no liability as to the accuracy or completeness of any of the information and/or content provided herein and the Company cannot be held responsible for any omission, mistake nor for any loss or damage including without limitation to any loss of profit which may arise from reliance on any information supplied by Everest Fortune Group.

NZD/USD – Short-Term Bearish OutlookNZD/USD – Short-Term Bearish Outlook
Price action suggests a potential pullback in the short term.
If momentum holds, I’m eyeing a short position with a target at 0.59760.
💡 Clean setup, tight risk, and solid reward potential.
📉 Watching for confirmation to enter. Follow for more intraday setups!

NZDUSD 4Hr. Wave 5 North Likely in progress towards .6075
1). Price has very likely completed wave C @ .5950! 2). Risk Assets are strong today on US$ weakness! 3). BANKS ARE BUYING! 4). Volume is increasing... 5). Trendline intersecting with target fib. level 72.8%. 6).US $ WEAKNESS AT THE MOMENT IS ALSO ADDING TO THE ANTICIPATED RISK ASSET UPWARD SCENARIO!

Waiting for a Short-Term Pullback Before the Next Bullish Leg? NZDUSD – Waiting for a Short-Term Pullback Before the Next Bullish Leg?
As global markets await the upcoming U.S. Non-Farm Payrolls (NFP) report later this week, NZDUSD is showing early signs of short-term weakness following a strong bullish rally from the 0.5905 low. While the broader structure remains bullish, a corrective move may be necessary to shake out weak hands and reload liquidity before a renewed surge.
🌐 Macro & Fundamental Outlook:
New Zealand: Recent economic releases from New Zealand have been lackluster, yet the RBNZ's hawkish policy stance (high interest rates) continues to support the Kiwi. However, pressure from China – New Zealand’s top trading partner – remains a drag.
United States: The U.S. Dollar remains under pressure due to rising expectations that the Fed will start cutting rates by Q3 2025, despite some hawkish tones from FOMC officials. This week’s NFP report will be a decisive factor.
Market Sentiment: After a ~150-pip rally, traders are beginning to take profits. The correction could offer a golden re-entry opportunity.
📊 Technical Analysis:
Trend Bias: The market structure is still in an uptrend, maintaining Higher Highs and Higher Lows.
Fibonacci Retracement: Price is currently pulling back toward the 0.5 – 0.618 Fibo zone (0.5992 – 0.5978), aligning with the H1 89 & 200 EMAs.
EMA Structure (13 – 34 – 89 – 200): Still bullish but currently signaling a short-term pullback.
🔑 Key Price Zones:
Resistance Levels: 0.6014 – 0.6052
Support Levels: 0.5973 – 0.5951 – 0.5932
🧭 Trade Plan
📌 Buy Setup (trend continuation):
BUY ZONE: 0.5951 – 0.5932
SL: 0.5900
TP: 0.5978 → 0.6014 → 0.6052
📌 Expecting a bullish bounce off the 61.8% Fibo + EMA 200 confluence ahead of NFP.
📌 Sell Setup (short-term countertrend scalp):
SELL ZONE: 0.6014 – 0.6025
SL: 0.6060
TP: 0.5978 → 0.5951
📌 Anticipating a reaction at a key resistance zone – ideal for intraday scalpers.
⚠️ Risk Management Notes:
Stay cautious ahead of high-impact U.S. data (ADP, Jobless Claims, NFP).
Favor buying the dip in line with the higher-timeframe trend.
Maintain discipline with tight SLs (30–35 pips max per setup).

NZDUSDNZDUSD
Sell. Market execution. trade 1:2. riesgo 0.50%
We entered Sell because the market is respecting the sellers' zone.

Kiwi H4 | Pullback support at 50% Fibonacci retracementThe Kiwi (NZD/USD) is falling towards a pullback support and could potentially bounce off this level to climb higher.
Buy entry is at 0.5987 which is a pullback support that aligns with the 50.0% Fibonacci retracement.
Stop loss is at 0.5915 which is a level that lies underneath a multi-swing-low support.
Take profit is at 0.6060 which is a resistance that aligns with the 127.2% Fibonacci extension.
High Risk Investment Warning
Trading Forex/CFDs on margin carries a high level of risk and may not be suitable for all investors. Leverage can work against you.
Stratos Markets Limited (tradu.com ):
CFDs are complex instruments and come with a high risk of losing money rapidly due to leverage. 63% of retail investor accounts lose money when trading CFDs with this provider. You should consider whether you understand how CFDs work and whether you can afford to take the high risk of losing your money.
Stratos Europe Ltd (tradu.com ):
CFDs are complex instruments and come with a high risk of losing money rapidly due to leverage. 63% of retail investor accounts lose money when trading CFDs with this provider. You should consider whether you understand how CFDs work and whether you can afford to take the high risk of losing your money.
Stratos Global LLC (tradu.com ):
Losses can exceed deposits.
Please be advised that the information presented on TradingView is provided to Tradu (‘Company’, ‘we’) by a third-party provider (‘TFA Global Pte Ltd’). Please be reminded that you are solely responsible for the trading decisions on your account. There is a very high degree of risk involved in trading. Any information and/or content is intended entirely for research, educational and informational purposes only and does not constitute investment or consultation advice or investment strategy. The information is not tailored to the investment needs of any specific person and therefore does not involve a consideration of any of the investment objectives, financial situation or needs of any viewer that may receive it. Kindly also note that past performance is not a reliable indicator of future results. Actual results may differ materially from those anticipated in forward-looking or past performance statements. We assume no liability as to the accuracy or completeness of any of the information and/or content provided herein and the Company cannot be held responsible for any omission, mistake nor for any loss or damage including without limitation to any loss of profit which may arise from reliance on any information supplied by TFA Global Pte Ltd.
The speaker(s) is neither an employee, agent nor representative of Tradu and is therefore acting independently. The opinions given are their own, constitute general market commentary, and do not constitute the opinion or advice of Tradu or any form of personal or investment advice. Tradu neither endorses nor guarantees offerings of third-party speakers, nor is Tradu responsible for the content, veracity or opinions of third-party speakers, presenters or participants.

Trade closed hit target! NZDUSD 4Hr. Wave 5 .604333 days ago
1). Price has very likely completed wave C @ .5950! 2). Risk Assets are strong today on US$ weakness! 3). BANKS ARE BUYING! 4). Volume is increasing... 5). Trendline intersecting with target fib. level 72.8%.

NZDUSD Potential UpsidesHey Traders, in today's trading we are monitoring NZDUSD for a buying opportunity around 0.59400 zone, NZDUSD is trading in an uptrend and currently is in a correction phase in which it is approaching the trend at 0.59400 support and resistance area.
Trade safe, Joe.

nzdusd sell signal. Don't forget about stop-loss.
Write in the comments all your questions and instruments analysis of which you want to see.
Friends, push the like button, write a comment, and share with your mates - that would be the best THANK YOU.
P.S. I personally will open entry if the price will show it according to my strategy.
Always make your analysis before a trade

NZDUSD: Bearish Continuation & Short Trade
NZDUSD
- Classic bearish setup
- Our team expects bearish continuation
SUGGESTED TRADE:
Swing Trade
Short NZDUSD
Entry Point - 0.6018
Stop Loss - 0.6051
Take Profit - 0.5952
Our Risk - 1%
Start protection of your profits from lower levels
Disclosure: I am part of Trade Nation's Influencer program and receive a monthly fee for using their TradingView charts in my analysis.
❤️ Please, support our work with like & comment! ❤️

NZDUSD BULLISH H1NZDUSD BULLISH H1
Printing HH & HL
ab=cd pattern to be formed
current price at 0.61% fib level
good for buy
US Dollar May Face a Major Downtrend — NZDUSD Full Case Study
One-sentence key takeaway:
"The coming dollar downtrend is unfolding—NZDUSD has already taken off! Catch the structural breakout; the next station may witness a major dollar reversal."
1. Key Breakout Trigger — May 13
Signal time: 2025-05-13 22:01
Trigger price: 0.58932
Insight: Multi-timeframe signal confluence on NZDUSD, 0.58932 marks a major bullish breakout.
Strategy: As long as price holds above 0.59, stay bullish and ride the trend from the start.
《NZD(纽元)大级别上涨启动点(05月13日)》
2. First Follow-up — May 20
Price remained above 0.59; signal confirmed
Conclusion: Signal fully respected, trend intact, stay long and patient.
《NZD(纽元)大级别上涨启动点 —— 跟踪篇(1)(05月20日)》
3. Temporary Resistance — May 26
Current price: 0.60206
Non-USD pairs facing resistance, some consolidation appearing.
Strategy: Any pullback is not a concern; watch the structure, the main trend is unchanged.
《NZD(纽元)大级别上涨启动点 —— 跟踪篇(2)(非美遇到阻力)(05月26日)》
4. Second Breakout — May 28
Current price: 0.59691
Non-USD currencies re-ignite; strong inflow and bullish momentum.
Strategy: Buy dips in line with the trend, bullish bias unchanged.
《https://cn.tradingview.com/chart/idea/hDlgFQsc/》
5. Latest Update — June 2
Current price: 0.6005
Dollar Index: 98.965, down 0.48% today
NZDUSD and other non-USD pairs remain strong, Dollar Index keeps weakening.
Conclusion: The major dollar downtrend is clearly in play; non-USD bullish momentum remains dominant.
My Bias
Strongly bearish on USD; looking to buy NZDUSD and other non-USD pairs on dips
As long as 0.59 holds, the main trend stands
Every correction is a new chance to get on the next leg up
"Only big signals. Only key inflection points—miss one, and you could miss an entire cycle of wealth!"

NZD/USD Trade IdeaThe NZD/USD pair appears to be forming an ascending triangle, a pattern that typically indicates increasing bullish momentum and buyer strength.
Should price break above the established resistance zone at 0.60300, I would wait for a confirmed retest of this area before considering a long position.
Potential take-profit targets are set at the next key resistance levels of 0.61215 and 0.63740, based on previous structure.

NZDUSD 2.06.2025NZDUSD
We see a horizontal level from above, which usually breaks through upwards.
In addition, ALL liquidity has been reached from below, and the remaining liquidity is above, and we are moving towards it.
Best regards EXACAVO
_____________________
Disclosure: I am part of Trade Nation's Influencer program and receive a monthly fee for using their TradingView charts in my analysis.

NZDUSD SHORTNZDUSD could possible short to complete a C leg of a possible expanded flat or running flat correction before the big buy

NZDUSD BUYSNZDUSD is expected to buy to complete the crab pattern around 0.61200 psychological level BOUNCING FROM A 1HR FVG(Fair value Gap). we saw an expected rate cut of NZD interest rate at 25 basis point(0.25%) was was a dovish stand by the central bank. with investment sentiment still high on risk-on assets, I expect nzd to bully the green-back which is struggling with low interest rate figures as a result of declining inflation figures nearing its 2024 inflation target of 2% and global trade wars.

NZD_USD RISKY SHORT FROM RESISTANCE|
✅NZD_USD has been growing recently
And the pair seems locally overbought
So as the pair is approaching a horizontal resistance of 0.6030
Price decline is to be expected
SHORT🔥
✅Like and subscribe to never miss a new idea!✅
Disclosure: I am part of Trade Nation's Influencer program and receive a monthly fee for using their TradingView charts in my analysis.

NZD/USD Setup – Smart Money Demand Zone ReactionPrice has been respecting a well-defined demand zone with multiple rejections and clear signs of accumulation. We're now seeing strong bullish intent building up, especially with the current weakness in the U.S. Dollar (DXY).
This trade idea is structured around:
🔹 A clean liquidity sweep below recent lows
🔹 Strong reaction from institutional demand
🔹 Favorable RRR and market structure support
🔹 Aligns with broader macro sentiment
Momentum is shifting — and this looks like the beginning of an expansion leg to the upside.
#nzdusd #forextrading #smartmoneyconcepts #priceaction #liquidityzone #supplyanddemand #forexsetup #tradingview #telegramsignals #forexcommunity
adm:I would like to apologize especially to EuroMotif, for breaking a rule and I am sure that this will not happen again. I am responding through the post because unfortunately the SMS does not arrive. I thank you in advance for the opportunity.

Bullish bounce?NZD/USD is has bounced off the support level which is a pullback support and could rise from this level to our take profit.
Entry: 0.5931
Why we like it:
There is a pullback support level.
Stop loss: 0.5898
Why we like it:
There is a pullback support level.
Take profit: 0.6017
Why we like it:
There is a pullback resistance level.
Enjoying your TradingView experience? Review us!
Please be advised that the information presented on TradingView is provided to Vantage (‘Vantage Global Limited’, ‘we’) by a third-party provider (‘Everest Fortune Group’). Please be reminded that you are solely responsible for the trading decisions on your account. There is a very high degree of risk involved in trading. Any information and/or content is intended entirely for research, educational and informational purposes only and does not constitute investment or consultation advice or investment strategy. The information is not tailored to the investment needs of any specific person and therefore does not involve a consideration of any of the investment objectives, financial situation or needs of any viewer that may receive it. Kindly also note that past performance is not a reliable indicator of future results. Actual results may differ materially from those anticipated in forward-looking or past performance statements. We assume no liability as to the accuracy or completeness of any of the information and/or content provided herein and the Company cannot be held responsible for any omission, mistake nor for any loss or damage including without limitation to any loss of profit which may arise from reliance on any information supplied by Everest Fortune Group.

INVERSE HEAD AND SHOULDER CHART PATTERN A break on the neckline gives us a chance for a continuation to the upside stay tuned as our update you on entry levels once the structure is achieved

NZDUSD: weekly overviewTraders, this is weekly view of the pair.
Our long-term TP is the 0.6300 but for now we have a strong trendline on our way! the only tradable zone for this week is 0.58497.
In case of bullish trades, from 0.60264 level. Please consider the trend line as mid-way TPS.
*******************************************************************
The indicated levels are determined based on the most reaction points and the assumption of approximately equal distance between the zones.
Some of these points can also be confirmed by the mathematical intervals of Murray.
You can enter with/without confirmation. IF you want to take confirmation you can use LTF analysis, Spike move confirmation, Trend Strength confirmation and ETC.
SL could be placed below the zone or regarding the LTF swings.
TP is the next zone or the nearest moving S&R, which are median and borders of the drawn channels.
*******************************************************************
Role of different zones:
GREEN: Just long trades allowed on them.
RED: Just Short trades allowed on them.
BLUE: both long and short trades allowed on them.
WHITE: No trades allowed on them! just use them as TP points

NZDUSD: Move Up Ahead 🇳🇿🇺🇸
Thursday's and Friday's sessions were bullish on NZDUSD.
After a test of a rising trend line, the price formed
a double bottom pattern on a 4H time frame and violated its neckline.
I think that the pair may rise next week and reach at least 0.6 level.
❤️Please, support my work with like, thank you!❤️
I am part of Trade Nation's Influencer program and receive a monthly fee for using their TradingView charts in my analysis.
