ENTRY NZDUSDDisclaimer:
This is merely a chart-based analytical trading idea and is not considered investment advice. Please manage your risks carefully and conduct your own research before making any trading decisions.
NZDUSD trade ideas
NZDUSD BUY SETUP LOOOONGLook in this photo
The price
The price on the four-hour frame has a strong upward momentum and is in a cheap area relative to the consolidation area it is in, but it should have broken the downtrend on the quarter-hour frame.

NZDUSD Expected bullish trend On the basis of trend line and price action there is expectation of bullish trend.

NZDUSD oversold bounce back support at 0.5887The NZDUSD remains in a bullish trend, with recent price action showing signs of a corrective pullback within the broader uptrend.
Support Zone: 0.5887 – a key level from previous consolidation. Price is currently testing or approaching this level.
A bullish rebound from 0.5887 would confirm ongoing upside momentum, with potential targets at:
0.6020 – initial resistance
0.6040 – psychological and structural level
0.6056 – extended resistance on the longer-term chart
Bearish Scenario:
A confirmed break and daily close below 0.5887 would weaken the bullish outlook and suggest deeper downside risk toward:
0.5865 – minor support
0.5840 – stronger support and potential demand zone
Outlook:
Bullish bias remains intact while the NZDUSD holds above 0.5887 A sustained break below this level could shift momentum to the downside in the short term.
This communication is for informational purposes only and should not be viewed as any form of recommendation as to a particular course of action or as investment advice. It is not intended as an offer or solicitation for the purchase or sale of any financial instrument or as an official confirmation of any transaction. Opinions, estimates and assumptions expressed herein are made as of the date of this communication and are subject to change without notice. This communication has been prepared based upon information, including market prices, data and other information, believed to be reliable; however, Trade Nation does not warrant its completeness or accuracy. All market prices and market data contained in or attached to this communication are indicative and subject to change without notice.

NZDUSD Will Go Higher! Long!
Here is our detailed technical review for NZDUSD.
Time Frame: 1D
Current Trend: Bullish
Sentiment: Oversold (based on 7-period RSI)
Forecast: Bullish
The market is testing a major horizontal structure 0.592.
Taking into consideration the structure & trend analysis, I believe that the market will reach 0.602 level soon.
P.S
Overbought describes a period of time where there has been a significant and consistent upward move in price over a period of time without much pullback.
Disclosure: I am part of Trade Nation's Influencer program and receive a monthly fee for using their TradingView charts in my analysis.
Like and subscribe and comment my ideas if you enjoy them!

NZDUSD – Breakout from Inverse Head & Shoulders + Trendline AreaNZDUSD is showing a bullish reversal setup on the 1-hour chart.
Price has broken above a long-standing descending trendline, indicating a potential shift in market structure.
A clear Inverse Head & Shoulders pattern has formed, suggesting a bullish reversal.
Price has broken above the neckline and the key resistance zone (highlighted in grey)
he 50 EMA has now been reclaimed, supporting the bullish bias

NZDUSD Trade idea.Being downtrend in the higher timeframes, we have been checking to short.
The current prices seems to be in our POI.
We took a low risk trade.
DISCLAIMER: This is not a financial advice, trade with caution.

NZDUSD | Bullish NZDUSD has strengthened its position after a short correction.ZXY is trying to continue its bullish momemtum

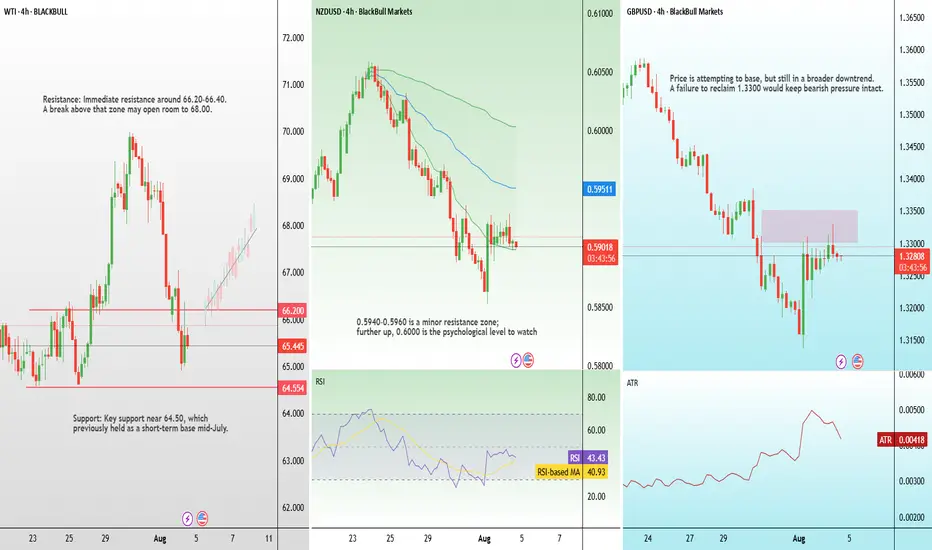
Tariffs, NZ unemployment, and rate cuts: Highlights for the weekAfter a packed calendar last week, this one looks lighter—but there are still key events across major economies likely to drive FX market movement.
India Tariffs and Oil Prices
U.S. President Donald Trump has announced plans to raise tariffs on Indian imports, citing India’s continued purchase and resale of Russian oil. The White House rightly claims this undermines sanctions and helps fund the war in Ukraine. India’s Ministry of External Affairs called the move “unjustified and unreasonable.”
New Zealand Jobs Data — Wednesday
New Zealand’s Q2 unemployment rate is expected to rise from 5.1% to 5.3%, the highest level since late 2015. With inflation back within the RBNZ’s 1–3% target range, a soft labour print could provide the final justification for a rate cut at the next policy meeting.
Bank of England Rate Decision — Thursday
The BoE is widely expected to cut its policy rate by 25 basis points this week, responding to slowing economic momentum despite ongoing inflation concerns. Traders will closely watch Governor Bailey’s remarks to gauge whether this marks the start of a broader easing cycle or a single adjustment.
NZD/USD SENDS CLEAR BEARISH SIGNALS|SHORT
NZD/USD SIGNAL
Trade Direction: short
Entry Level: 0.595
Target Level: 0.590
Stop Loss: 0.599
RISK PROFILE
Risk level: medium
Suggested risk: 1%
Timeframe: 6h
Disclosure: I am part of Trade Nation's Influencer program and receive a monthly fee for using their TradingView charts in my analysis.
✅LIKE AND COMMENT MY IDEAS✅

NZD_USD LOCAL SHORT|
✅NZD_USD is going up now
But a strong resistance level is ahead at 0.5950
Thus I am expecting a pullback
And a move down towards the target of 0.5920
SHORT🔥
✅Like and subscribe to never miss a new idea!✅

Pullback tradeThe price has broken out of a triangle pattern followed by a pullback and now the price has been rejected and now the bears look to be back in control
WE ONLY TRADE PULLBACKS

Choppy week NZDUSD BuyHello traders I hope you are doing well
As you can see the inverted head and shoulders.
Multiple touches on the top trendline.
Lets just be patient and let the market come to us.

NZDUSD Wave Analysis – 7 August 2025- NZDUSD reversed from the support area
- Likely to test resistance level 0.6050
NZDUSD currency pair recently reversed from the support area between the strong support level of 0.5880 (which has been reversing the price from May) and the lower daily Bollinger Band.
The upward reversal from this support area created a clear daily Japanese candlestick reversal pattern, the Hammer, which initiated active correction ii.
Given the strongly bearish US dollar sentiment seen today, NZDUSD currency pair can be expected to rise to the next resistance level 0.6050 (top of wave 2 from July).

Nzdusd We hv price on a down trend so we are expecting a retracment back to de zone and a change of structure on the 4h then I sell

NZDUSD longOn the NZD/USD chart, we see a bullish Gartley pattern aligning with an upward trendline. I expect the price to move higher.

Seeking the nearest Sell SideThe image speaks for itself
this is an ict concept idea and from experience work that I have done over 7yrs

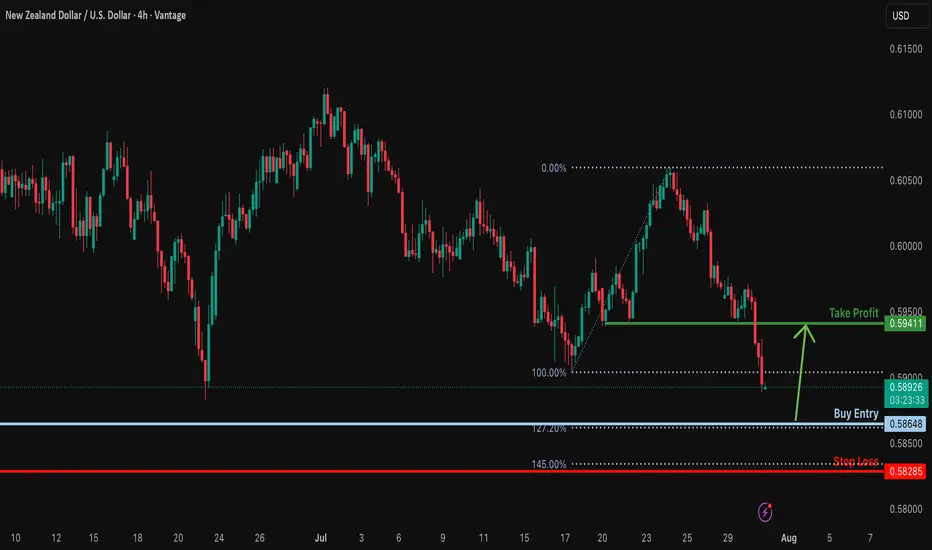
NZDUSD H4 | Bearish drop off 50% Fibonacci resistanceNZD/USD is rising towards the sell entry, which serves as a pullback resistance and could potentially reverse lower.
Sell entry is at 0.5941, which is a pullback resistance.
Stop loss is at 0.5978, which is a pullback resistance that lines up with the 50% Fibonacci retracement.
Take profit is at 0.5896, which is a swing low support.
High Risk Investment Warning
Trading Forex/CFDs on margin carries a high level of risk and may not be suitable for all investors. Leverage can work against you.
Stratos Markets Limited (tradu.com ):
CFDs are complex instruments and come with a high risk of losing money rapidly due to leverage. 65% of retail investor accounts lose money when trading CFDs with this provider. You should consider whether you understand how CFDs work and whether you can afford to take the high risk of losing your money.
Stratos Europe Ltd (tradu.com ):
CFDs are complex instruments and come with a high risk of losing money rapidly due to leverage. 66% of retail investor accounts lose money when trading CFDs with this provider. You should consider whether you understand how CFDs work and whether you can afford to take the high risk of losing your money.
Stratos Global LLC (tradu.com ):
Losses can exceed deposits.
Please be advised that the information presented on TradingView is provided to Tradu (‘Company’, ‘we’) by a third-party provider (‘TFA Global Pte Ltd’). Please be reminded that you are solely responsible for the trading decisions on your account. There is a very high degree of risk involved in trading. Any information and/or content is intended entirely for research, educational and informational purposes only and does not constitute investment or consultation advice or investment strategy. The information is not tailored to the investment needs of any specific person and therefore does not involve a consideration of any of the investment objectives, financial situation or needs of any viewer that may receive it. Kindly also note that past performance is not a reliable indicator of future results. Actual results may differ materially from those anticipated in forward-looking or past performance statements. We assume no liability as to the accuracy or completeness of any of the information and/or content provided herein and the Company cannot be held responsible for any omission, mistake nor for any loss or damage including without limitation to any loss of profit which may arise from reliance on any information supplied by TFA Global Pte Ltd.
The speaker(s) is neither an employee, agent nor representative of Tradu and is therefore acting independently. The opinions given are their own, constitute general market commentary, and do not constitute the opinion or advice of Tradu or any form of personal or investment advice. Tradu neither endorses nor guarantees offerings of third-party speakers, nor is Tradu responsible for the content, veracity or opinions of third-party speakers, presenters or participants.

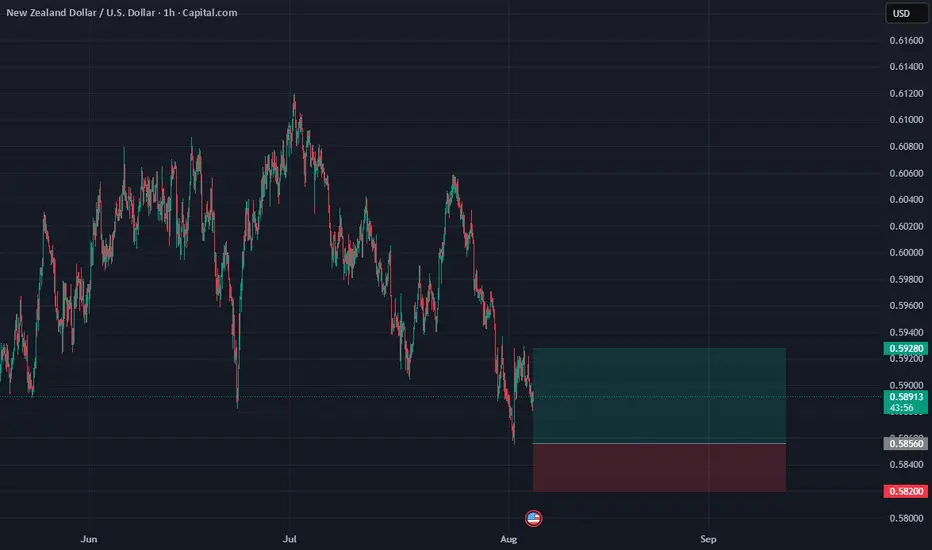
Bullish reversal?NZD/USD is falling towards the support level, which is a swing low support that lines up with the 127.2% Fibonacci extension. Could NZD/USD bounce from this level to our take profit?
Entry: 0.5864
Why we like it:
There is a swing low support that lines up with the 127.2% Fibonacci extension.
Stop loss: 0.5828
Why we like it:
There is a pullback support that lines up with the 145% Fibonacci extension.
Takeprofit: 0.5941
Why we like it:
There is a pullback resistance level.
Enjoying your TradingView experience? Review us!
Please be advised that the information presented on TradingView is provided to Vantage (‘Vantage Global Limited’, ‘we’) by a third-party provider (‘Everest Fortune Group’). Please be reminded that you are solely responsible for the trading decisions on your account. There is a very high degree of risk involved in trading. Any information and/or content is intended entirely for research, educational and informational purposes only and does not constitute investment or consultation advice or investment strategy. The information is not tailored to the investment needs of any specific person and therefore does not involve a consideration of any of the investment objectives, financial situation or needs of any viewer that may receive it. Kindly also note that past performance is not a reliable indicator of future results. Actual results may differ materially from those anticipated in forward-looking or past performance statements. We assume no liability as to the accuracy or completeness of any of the information and/or content provided herein and the Company cannot be held responsible for any omission, mistake nor for any loss or damage including without limitation to any loss of profit which may arise from reliance on any information supplied by Everest Fortune Group.
Heading into 50% Fibonacci resistance?The Kiwi (NZD/USD) is rising towards the pivot, which is an overlap resistance that lines up with the 50% Fibonacci retracement and could reverse to the 1st support.
Pivot: 0.5999
1st Support: 0.5941
1st Resistance: 0.6030
Risk Warning:
Trading Forex and CFDs carries a high level of risk to your capital and you should only trade with money you can afford to lose. Trading Forex and CFDs may not be suitable for all investors, so please ensure that you fully understand the risks involved and seek independent advice if necessary.
Disclaimer:
The above opinions given constitute general market commentary, and do not constitute the opinion or advice of IC Markets or any form of personal or investment advice.
Any opinions, news, research, analyses, prices, other information, or links to third-party sites contained on this website are provided on an "as-is" basis, are intended only to be informative, is not an advice nor a recommendation, nor research, or a record of our trading prices, or an offer of, or solicitation for a transaction in any financial instrument and thus should not be treated as such. The information provided does not involve any specific investment objectives, financial situation and needs of any specific person who may receive it. Please be aware, that past performance is not a reliable indicator of future performance and/or results. Past Performance or Forward-looking scenarios based upon the reasonable beliefs of the third-party provider are not a guarantee of future performance. Actual results may differ materially from those anticipated in forward-looking or past performance statements. IC Markets makes no representation or warranty and assumes no liability as to the accuracy or completeness of the information provided, nor any loss arising from any investment based on a recommendation, forecast or any information supplied by any third-party.

NZDUSD Potential UpsidesHey Traders, in today's trading session we are monitoring NZDUSD for a buying opportunity around 0.59200 zone, NZDUSD is trading in an uptrend and currently is in a correction phase in which it is approaching the trend at 0.59200 support and resistance area.
Trade safe, Joe.

US dollar getting strongerwith this HD- which is shows the weakness in buyers, and the price is near the downtrend and also us dollar index getting stronger, i believe NZDUSD can goes down at least until the 0.52521.

NZDUSD BUY SETUP LOOOOOOOONGHELLO
we have demand and ascending channel 4h
and low time frame the price make engulfing candle on 30m 15m on support zone
and can't make lower low so i will buy it
