NzdUsd Trade IdeaWith NU still trading between 59450 and 58895 I'll be personally waiting on smaller time frames to either create bearish structures below 59459 to confirm a range continuation or wait for bullish structures to form above 59450 before executing any longs. I'll be looking for a 1:2.5 - 1:3rr for both set ups.
NZDUSD trade ideas

Buy Nzdusd if break the level of Trend lineBuy Nzdusd if break the level of Trend line
* due to usd Week in this week

NZDUSD Potential DownsidesHey Traders, in today's trading session we are monitoring NZDUSD for a selling opportunity around 0.59650 zone, NZDUSD is trading in a downtrend and currently is in a correction phase in which it is approaching the trend at 0.59650 support and resistance area.
Trade safe, Joe.

NZD/USD For Bullishwait for pull-back near by entry point and then go long
general trend is up trend
have fun :)

Kiwi H1 | Rising into an overlap resistanceThe Kiwi (NZD/USD) is rising towards an overlap resistance and could potentially reverse off this level to drop lower.
Sell entry is at 0.5946 which is an overlap resistance that aligns with the 38.2% Fibonacci retracement.
Stop loss is at 0.5995 which is a level that sits above the 61.8% Fibonacci retracement and a multi-swing-high resistance.
Take profit is at 0.5897 which is a multi-swing-low support.
High Risk Investment Warning
Trading Forex/CFDs on margin carries a high level of risk and may not be suitable for all investors. Leverage can work against you.
Stratos Markets Limited (tradu.com):
CFDs are complex instruments and come with a high risk of losing money rapidly due to leverage. 63% of retail investor accounts lose money when trading CFDs with this provider. You should consider whether you understand how CFDs work and whether you can afford to take the high risk of losing your money.
Stratos Europe Ltd (tradu.com):
CFDs are complex instruments and come with a high risk of losing money rapidly due to leverage. 63% of retail investor accounts lose money when trading CFDs with this provider. You should consider whether you understand how CFDs work and whether you can afford to take the high risk of losing your money.
Stratos Global LLC (tradu.com):
Losses can exceed deposits.
Please be advised that the information presented on TradingView is provided to Tradu (‘Company’, ‘we’) by a third-party provider (‘TFA Global Pte Ltd’). Please be reminded that you are solely responsible for the trading decisions on your account. There is a very high degree of risk involved in trading. Any information and/or content is intended entirely for research, educational and informational purposes only and does not constitute investment or consultation advice or investment strategy. The information is not tailored to the investment needs of any specific person and therefore does not involve a consideration of any of the investment objectives, financial situation or needs of any viewer that may receive it. Kindly also note that past performance is not a reliable indicator of future results. Actual results may differ materially from those anticipated in forward-looking or past performance statements. We assume no liability as to the accuracy or completeness of any of the information and/or content provided herein and the Company cannot be held responsible for any omission, mistake nor for any loss or damage including without limitation to any loss of profit which may arise from reliance on any information supplied by TFA Global Pte Ltd.
The speaker(s) is neither an employee, agent nor representative of Tradu and is therefore acting independently. The opinions given are their own, constitute general market commentary, and do not constitute the opinion or advice of Tradu or any form of personal or investment advice. Tradu neither endorses nor guarantees offerings of third-party speakers, nor is Tradu responsible for the content, veracity or opinions of third-party speakers, presenters or participants.

The #1 Step To Risk ManagementRisk management is very important for you to understand.
Because this will help you become a professional trader.
But i need to share something personal about me before
we dive into the "The #1 Step To Risk Management".
One thing about me is that i love being a leader.
Even looking for people that enjoy being leaders is what i like.
Sometimes i look at certain friends of mine.This particular person
i am thinking about was a good friend.
Now the problem is that this friend of mine never grew up
to like leadership.If you want to be my friend you
have to love leadership.
Because once you become a leader you wont
be scared to keep people accountable.
I was reading a book on real estate AMEX:IYR
And the writer said he hired his elder brother to collect rent.
Listen if you need help collecting rent - then you
are sacred to keep people accountable.Now in some situations
you will to be in a position of insurance.This means you have
to screen the tenant before you rent out the property.
==
When you look at this forex pair OANDA:NZDUSD
Notice that it does not follow the rocket booster strategy
at all.But its in a trending position.
This means it is a good dip buy.Coming from a "multi-day runner" .
To enter this trade reset your simulation trading account
and then put a margin level of ONLY X10 for forex
trading.
Place you buy position then see what happens.
Your #1 Step To Risk management is to not risk too much.
Do not risk more than 10% on your down payment for the margin.
Also learn the right strategy.
Using the MACD to confirm the trade.I will do a demonstration
video on how to do that for now enter a trade in the simulation account.
==
Rocket boost this content to learn more.
Disclaimer:Trading is risky please learn risk management and
profit taking strategies.Also feel free to use a simulation
trading account before you trade with real money.

Descending TriangleThe price has broken out of the descending channel and made a sharp pullback in the form of a trendline, and now we have a smaller pullback, this is clear confirmation of a bearish impulse
Time to go short
WE ONLY TRADE PULLBACKS

Fri 2nd May 2025 NZD/USD Daily Forex Chart Sell SetupGood morning fellow traders. On my Daily Forex charts using the High Probability & Divergence trading methods from my books, I have identified a new trade setup this morning. As usual, you can read my notes on the chart for my thoughts on this setup. The trade being a NZD/USD Sell. Enjoy the day all. Cheers. Jim

Potential bearish drop?NZD/USD is rising towards the resistance level which is an overlap resistance and could drop from this level to our take profit.
Entry: 0.5936
Why we like it:
There is an overlap resistance level.
Stop loss: 0.5997
Why we like it:
There is a pullback resistance level.
Take profit: 0.5829
Why we like it:
There is a pullback support level that aligns with the 38.2% Fibonacci retracement.
Enjoying your TradingView experience? Review us!
Please be advised that the information presented on TradingView is provided to Vantage (‘Vantage Global Limited’, ‘we’) by a third-party provider (‘Everest Fortune Group’). Please be reminded that you are solely responsible for the trading decisions on your account. There is a very high degree of risk involved in trading. Any information and/or content is intended entirely for research, educational and informational purposes only and does not constitute investment or consultation advice or investment strategy. The information is not tailored to the investment needs of any specific person and therefore does not involve a consideration of any of the investment objectives, financial situation or needs of any viewer that may receive it. Kindly also note that past performance is not a reliable indicator of future results. Actual results may differ materially from those anticipated in forward-looking or past performance statements. We assume no liability as to the accuracy or completeness of any of the information and/or content provided herein and the Company cannot be held responsible for any omission, mistake nor for any loss or damage including without limitation to any loss of profit which may arise from reliance on any information supplied by Everest Fortune Group.

Ping pong long play for nzdusd Looking at a nice retracement into a good discount buy zone
So as of now looking at sells until alert gets hit
Stay patient , stay disciplined
Use proper risk

NZDUSD: Market of Buyers
The analysis of the NZDUSD chart clearly shows us that the pair is finally about to go up due to the rising pressure from the buyers.
Disclosure: I am part of Trade Nation's Influencer program and receive a monthly fee for using their TradingView charts in my analysis.
❤️ Please, support our work with like & comment! ❤️

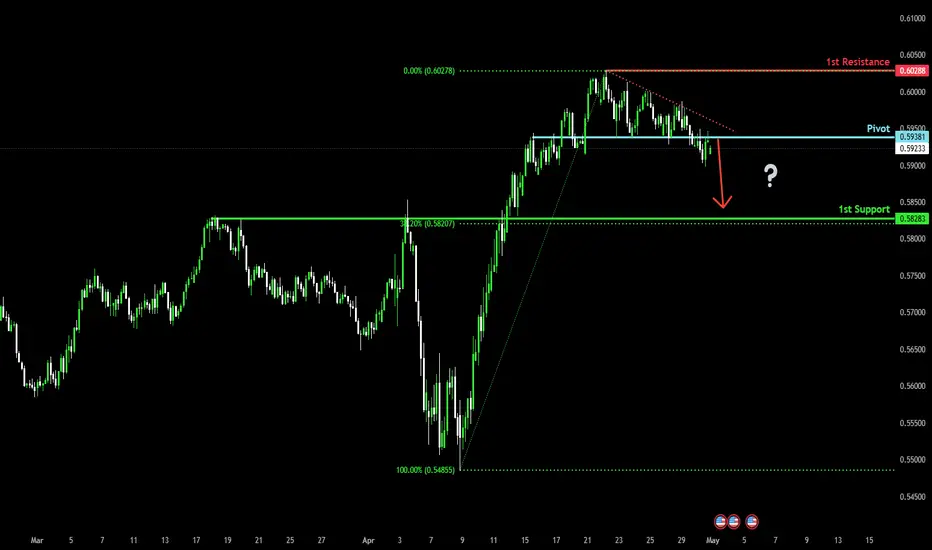
Bearish drop for the Kiwi?The price is reacting off the pivot and could drop to the 1st support which is a pullback support.
Pivot: 0.5938
1st Support: 0.5828
1st Resistance: 0.6028
Risk Warning:
Trading Forex and CFDs carries a high level of risk to your capital and you should only trade with money you can afford to lose. Trading Forex and CFDs may not be suitable for all investors, so please ensure that you fully understand the risks involved and seek independent advice if necessary.
Disclaimer:
The above opinions given constitute general market commentary, and do not constitute the opinion or advice of IC Markets or any form of personal or investment advice.
Any opinions, news, research, analyses, prices, other information, or links to third-party sites contained on this website are provided on an "as-is" basis, are intended only to be informative, is not an advice nor a recommendation, nor research, or a record of our trading prices, or an offer of, or solicitation for a transaction in any financial instrument and thus should not be treated as such. The information provided does not involve any specific investment objectives, financial situation and needs of any specific person who may receive it. Please be aware, that past performance is not a reliable indicator of future performance and/or results. Past Performance or Forward-looking scenarios based upon the reasonable beliefs of the third-party provider are not a guarantee of future performance. Actual results may differ materially from those anticipated in forward-looking or past performance statements. IC Markets makes no representation or warranty and assumes no liability as to the accuracy or completeness of the information provided, nor any loss arising from any investment based on a recommendation, forecast or any information supplied by any third-party.
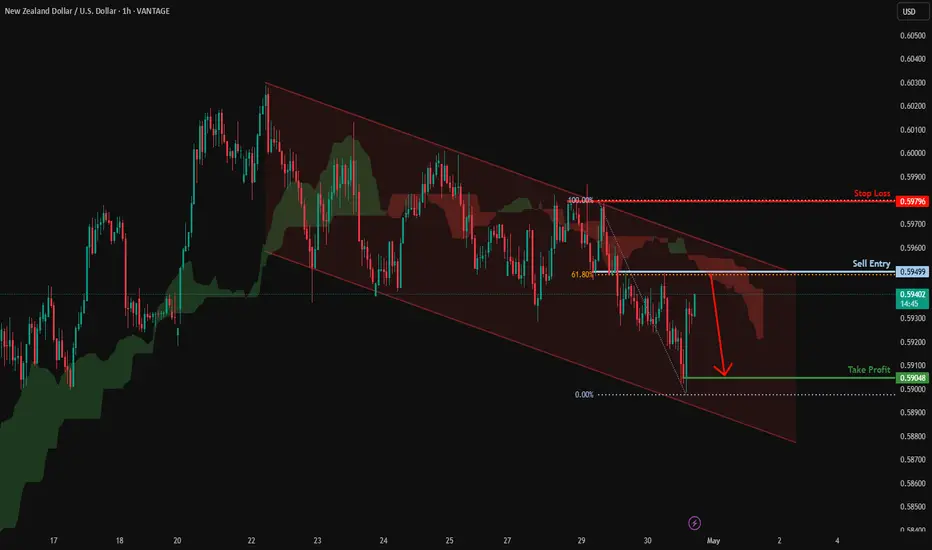
Bearish reversal off 61.8% Fibonacci resistance?NZD/USD is rising towards the resistance level which is an overlap resistance that lines up with the 61.8% Fibonacci retracement and could reverse from this level to our take profit.
Entry: 0.5949
Why we like it:
There is an overlap resistance that lines up with the 61.8% Fibonacci retracement.
Stop loss: 0.5979
Why we like it:
There is a pullback resistance level.
Take profit: 0.5904
Why we like it:
There is a pullback support level.
Enjoying your TradingView experience? Review us!
Please be advised that the information presented on TradingView is provided to Vantage (‘Vantage Global Limited’, ‘we’) by a third-party provider (‘Everest Fortune Group’). Please be reminded that you are solely responsible for the trading decisions on your account. There is a very high degree of risk involved in trading. Any information and/or content is intended entirely for research, educational and informational purposes only and does not constitute investment or consultation advice or investment strategy. The information is not tailored to the investment needs of any specific person and therefore does not involve a consideration of any of the investment objectives, financial situation or needs of any viewer that may receive it. Kindly also note that past performance is not a reliable indicator of future results. Actual results may differ materially from those anticipated in forward-looking or past performance statements. We assume no liability as to the accuracy or completeness of any of the information and/or content provided herein and the Company cannot be held responsible for any omission, mistake nor for any loss or damage including without limitation to any loss of profit which may arise from reliance on any information supplied by Everest Fortune Group.
NZDUSD Continues to Trade Under the Pressure of a Strong DollarHey Traders, in today's trading session we are monitoring NZDUSD for a selling opportunity around 0.59400 zone, NZDUSD is trading in a downtrend and currently is in a correction phase in which it is approaching the trend at 0.59400 support and resistance area.
Trade safe, Joe.

NZDUSD Wave Analysis – 30 April 2025
- NZDUSD reversed from the resistance level 0.6020
- Likely to fall to support level 0.5800
NZDUSD currency pair recently reversed down from the pivotal resistance level 0.6020 (former top of wave 2 from November) intersecting with the 61.8% Fibonacci correction of the downward impulse from September.
The downward reversal from the resistance level 0.6020 started the active intermediate impulse wave (3).
Given the overbought daily Stochastic, NZDUSD currency pair can be expected to fall to the next support level 0.5800, the former resistance from March and the target for the completion of the active impulse wave 1.

NZDUSD is preparing to reverse and fall....There is a risk of reversal and growth of course, as we have important news ahead.
But for the moment I will focus on technical analysis.
We had a rally and a stop earlier.
There is no continuation of growth, the price is facing pressure and breaking the consolidation support....
A retest of the previously broken consolidation support is possible, but if the price consolidates below 0.5925, then we can expect a fall to 0.583.
Scenario: breakdown and consolidation of the price in the selling zone. Further fall to 0.583. If the price continues to fall and consolidates below 0.583, then the medium-term scenario is a downward movement to 0.5668.

NZD/USD Sell Trade Analysis – 4H Timeframe📉 Pair: NZD/USD
🕒 Timeframe: 4-Hour
📥 Entry Price: 0.59267
🎯 Take Profit (TP): 0.58265
🛑 Stop Loss (SL): 0.59893
🔍 Trade Setup Explanation:
Trendline Rejection: Price has respected a descending trendline, confirming it as dynamic resistance. The recent candle shows rejection from this trendline, signaling a potential move downward.
Horizontal Resistance Level: 0.59274 has acted as a strong horizontal resistance level where the market has previously failed to break higher.
Bearish Market Structure: The market is forming lower highs and lower lows, indicating a continued bearish trend.
RSI Confirmation: RSI is at 41.81 and trending below its moving average (48.65), suggesting bearish momentum is still in play and sellers are in control.
💡 Summary: This setup shows confluence from both the trendline rejection and horizontal resistance zone, supported by bearish RSI momentum. The risk-to-reward ratio is favorable, making this a high-probability short trade setup.

NZDUSD Will Go Down From Resistance! Short!
Here is our detailed technical review for NZDUSD.
Time Frame: 1D
Current Trend: Bearish
Sentiment: Overbought (based on 7-period RSI)
Forecast: Bearish
The market is trading around a solid horizontal structure 0.592.
The above observations make me that the market will inevitably achieve 0.580 level.
P.S
Please, note that an oversold/overbought condition can last for a long time, and therefore being oversold/overbought doesn't mean a price rally will come soon, or at all.
Disclosure: I am part of Trade Nation's Influencer program and receive a monthly fee for using their TradingView charts in my analysis.
Like and subscribe and comment my ideas if you enjoy them!

Kiwi in Trouble? Momentum Turns as NZD/USD Tests SupportTraders should be alert to a potential downside break in NZD/USD.
Sitting in a descending triangle and having printed a bearish engulfing candle on Tuesday, a clean break below .5930 would generate a setup where shorts could be established with a stop above the level for protection. The 200-day moving average screens as an initial target, with .5854 another after that.
Bullish momentum is waning with RSI (14) trending lower while MACD is curling lower. The momentum signal is therefore more neutral than bullish, putting increased emphasis on price action near-term.
Good luck!
DS

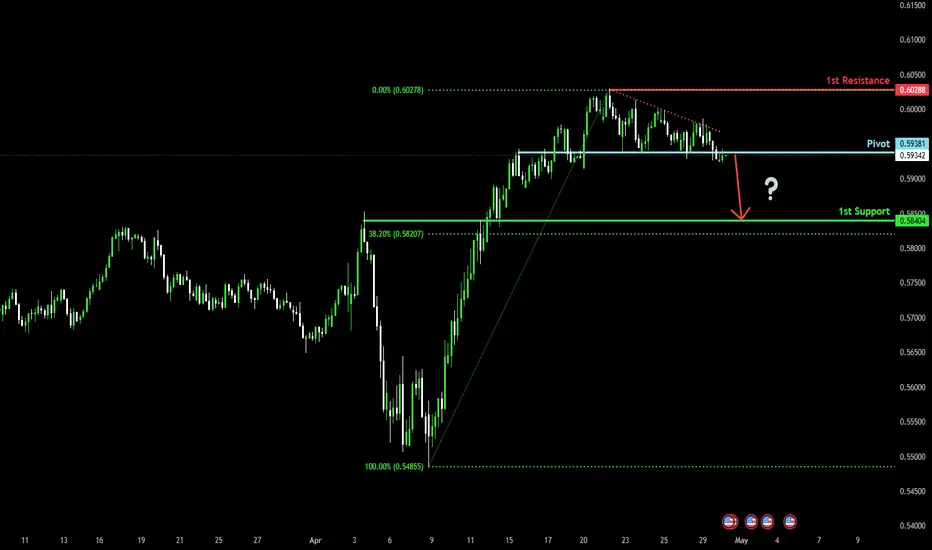
Potential bearish drop?The Kiwi (NZD/USD) is reacting off the pivot which is a pullback resistance and could drop to the 1st support which acts as a pullback support.
Pivot: 0.5938
1st Support: 0.5840
1st Resistance: 0.6028
Risk Warning:
Trading Forex and CFDs carries a high level of risk to your capital and you should only trade with money you can afford to lose. Trading Forex and CFDs may not be suitable for all investors, so please ensure that you fully understand the risks involved and seek independent advice if necessary.
Disclaimer:
The above opinions given constitute general market commentary, and do not constitute the opinion or advice of IC Markets or any form of personal or investment advice.
Any opinions, news, research, analyses, prices, other information, or links to third-party sites contained on this website are provided on an "as-is" basis, are intended only to be informative, is not an advice nor a recommendation, nor research, or a record of our trading prices, or an offer of, or solicitation for a transaction in any financial instrument and thus should not be treated as such. The information provided does not involve any specific investment objectives, financial situation and needs of any specific person who may receive it. Please be aware, that past performance is not a reliable indicator of future performance and/or results. Past Performance or Forward-looking scenarios based upon the reasonable beliefs of the third-party provider are not a guarantee of future performance. Actual results may differ materially from those anticipated in forward-looking or past performance statements. IC Markets makes no representation or warranty and assumes no liability as to the accuracy or completeness of the information provided, nor any loss arising from any investment based on a recommendation, forecast or any information supplied by any third-party.
WHY you MUST analyze 28 CURRENCY PAIRS for added confluenceAll the information you need to find a high probability trade are in front of you on the charts so build your trading decisions on 'the facts' of the chart NOT what you think or what you want to happen or even what you heard will happen. If you have enough facts telling you to trade in a certain direction and therefore enough confluence to take a trade, then this is how you will gain consistency in you trading and build confidence. Check out my trade idea!!
www.tradingview.com

NZD_USD REBOUND AHEAD|LONG|
✅NZD_USD is trading in an
Uptrend and the pair is making
A local correction in a way
Which also resembles a bullish
Wedge so after the retest of the
Horizontal support around 0.5917
A local bullish rebound
Is to be expected
LONG🚀
✅Like and subscribe to never miss a new idea!✅
Disclosure: I am part of Trade Nation's Influencer program and receive a monthly fee for using their TradingView charts in my analysis.

NZD-USD Long From Support! Buy!
Hello,Traders!
NZD-USD is making a local
Bearish correction but will
Soon hit a horizontal support
Around 0.5915 from where
We will be expecting a
Local bullish rebound
Buy!
Comment and subscribe to help us grow!
Check out other forecasts below too!
Disclosure: I am part of Trade Nation's Influencer program and receive a monthly fee for using their TradingView charts in my analysis.
