very nice long set up presentingafter making 2 sets of 3 pushes down its now showing signs of going up for a bit.
Trading false break reversal.
NZDUSD trade ideas

#NZDUSD:DXY Gaining Its Strength Back, Is it end for the Bulls? The OANDA:NZDUSD DXY index shows a change in price character and momentum, indicating a possible price reversal for the shorter term. This aligns with our fundamental analysis, as there’s a likelihood of a China-US trade deal that could significantly influence the demand for the DXY.
There are two possible selling entries, allowing you to choose between a riskier or safer approach. Alongside these entries, we’ve set targets accordingly to your chosen entry.
Good luck and trade safely!
Thank you for your unwavering support! 😊
If you’d like to contribute, here are a few ways you can help us:
- Like our ideas
- Comment on our ideas
- Share our ideas
Team Setupsfx_
❤️🚀

Buy nzdusd Strong buy momentum continues
Still following the monthly chart and brekinh all fresh highs

NZDUSD Potential DownsidesHey Traders, in today's trading session we are monitoring NZDUSD for a selling opportunity around 0.60000 zone, NZDUSD is trading in a downtrend and currently is in a correction phase in which it is approaching the trend at 0.60000 support and resistance area.
Trade safe, Joe.

The result of the previous analysisNZD/USD It fell to the range specified in the first stage (1), then it was supported by the same limit and went up (2). It is still in the middle of the upward path and any exit or stay in the matter is up to you.

[NZDUSD] Trade ideaTrendline break anticipation but correct reversal pattern on the chart.
Targeting the fibonacci levels on this one, but can be too much to look for.
Great Trade !

NZD/USD | Mid-Term Recovery in MotionThis 12D chart is beginning to tell a bold story…
🔻 After bouncing off a long-term low near 0.5520, price has pushed up and is now resting near the 0.618 Fibonacci level — historically a pivot zone for big decisions.
🔄 The rounded base forming is catching serious structure. If this holds, we may be looking at a climb toward 0.64685, a key retest level.
🧠 Psychology in play: Above 0.66 unlocks a path back to 0.7465+ — previous highs and liquidity-rich territory.
📌 Still early — confirmation needed — but signs of exhaustion below and renewed structure above are stacking up.

NZDUSD Swing LongJust set and forget on this one. Once this initial hype of Trump's policies dies down, the Dollar will depreciate hard, because if you know anything about Trump, you'd know that he has supported the concept of a weak Dollar for quite a long time.

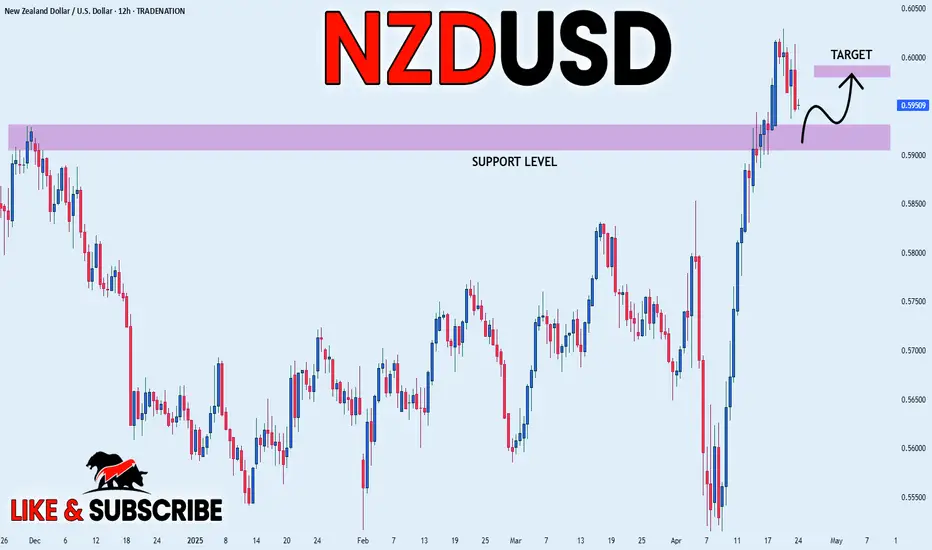
NZDUSD INTRADAY sideways consolidation supported at 0.5923NZDUSD maintains a bullish bias, supported by the prevailing upward trend. Recent intraday movement indicates a Bullish breakout above the consolidation zone, offering a potential setup for trend continuation.
Key Support Level: 0.5920 – previous consolidation range and pivotal support
Upside Targets:
0.6080 – initial resistance
0.6150 and 0.6180 – extended bullish targets on higher timeframes
A bullish reversal from 0.5920 would suggest continuation of the uptrend, confirming buying momentum.
However, a decisive break and daily close below 0.5920 would invalidate the bullish structure, opening the door for further retracement toward 0.5870, with additional support at 0.5830 and 0.5770.
Conclusion
NZDUSD remains bullish above 0.5920. A bounce from this level supports further gains. Traders should watch for confirmation signals before positioning for the next move.
This communication is for informational purposes only and should not be viewed as any form of recommendation as to a particular course of action or as investment advice. It is not intended as an offer or solicitation for the purchase or sale of any financial instrument or as an official confirmation of any transaction. Opinions, estimates and assumptions expressed herein are made as of the date of this communication and are subject to change without notice. This communication has been prepared based upon information, including market prices, data and other information, believed to be reliable; however, Trade Nation does not warrant its completeness or accuracy. All market prices and market data contained in or attached to this communication are indicative and subject to change without notice.

NZD/USD For Bearishyou can go short now
or
wait for pull-back near by entry point and then go short
general trend is up trend
current phase is pull-back until target 3
have fun :)

NZDUSD Is Going Down! Short!
Take a look at our analysis for NZDUSD.
Time Frame: 9h
Current Trend: Bearish
Sentiment: Overbought (based on 7-period RSI)
Forecast: Bearish
The market is on a crucial zone of supply 0.596.
The above-mentioned technicals clearly indicate the dominance of sellers on the market. I recommend shorting the instrument, aiming at 0.585 level.
P.S
Please, note that an oversold/overbought condition can last for a long time, and therefore being oversold/overbought doesn't mean a price rally will come soon, or at all.
Disclosure: I am part of Trade Nation's Influencer program and receive a monthly fee for using their TradingView charts in my analysis.
Like and subscribe and comment my ideas if you enjoy them!

NZD/USD 4h chart NZD/USD in supply zone
just looking for breakdown for the stucutre to continue down

Lingrid | NZDUSD Consolidation PHASE Following Bullish RunPYTH:NZDUSD market is consolidating following the recent bullish run. Price action appears to be creating a triangle pattern, typically considered a continuation formation. The market consistently bounces off the support zone around the 0.59500 level, suggesting this area holds significant buying interest. After the triangle pattern completes, price will likely move to higher levels, following the pattern's characteristics as a trend continuation formation. If the market respects the support zone and channel border with a clear rejection, we can expect price to rebound and retest the trendline before potentially moving higher. My goal is resistance zone around 0.59900
Traders, if you liked this idea or if you have your own opinion about it, write in the comments. I will be glad 👩💻

NZDUSD sell setup H4Hello! Friends,
Greetings. Please leave a Like if you like the idea.
Before start talking about technical Let's share your LOVE by giving me LIKES to support this work. Thanks in advance.

short set up NZDUSD**NZDUSD Short Trading Plan:**
1. **Entry:**
- Sell at upper deviation channel on daily timeframe
- Confirm with rejection candle at upper band
- use smaller time frame like 4h for better entry
2. **Stop Loss:**
- swing high at 0.60343
- or daily close above upper band
3. **Take Profit:**
- Target 1: Mean deviation line (middle of channel)
- Target 2: Lower deviation band (conservative exit)
4. **Confirmations:**
- Overbought RSI at upper band
- Break of support on smaller time frame
- Rejection candlestick formation daily/ weekly
5. **Management:**
- Partial exit at mean reversion (50%)
- Trail stop after price crosses mean line
- Consider adding if price stalls at key resistance levels

Long on NZD/USDI am long on NZDUSD. We have a bottoming structure with an additional trendline break.
You can long from a retest of trendline or as close to 0.56500.
Target 1 - Golden Zone area between 0.59500 - 0.60500
Target 2 - 0.63

NZDUSD to continue in the upward move?NZDUSD - 24h expiry
There is no clear indication that the upward move is coming to an end.
Although we remain bullish overall, a correction is possible with plenty of room to move lower without impacting the trend higher.
Risk/Reward would be poor to call a buy from current levels.
A move through 0.6000 will confirm the bullish momentum.
The measured move target is 0.6075.
We look to Buy at 0.5950 (stop at 0.5900)
Our profit targets will be 0.6050 and 0.6075
Resistance: 0.6000 / 0.6050 / 0.6075
Support: 0.5950 / 0.5925 / 0.5900
Risk Disclaimer
The trade ideas beyond this page are for informational purposes only and do not constitute investment advice or a solicitation to trade. This information is provided by Signal Centre, a third-party unaffiliated with OANDA, and is intended for general circulation only. OANDA does not guarantee the accuracy of this information and assumes no responsibilities for the information provided by the third party. The information does not take into account the specific investment objectives, financial situation, or particular needs of any particular person. You should take into account your specific investment objectives, financial situation, and particular needs before making a commitment to trade, including seeking advice from an independent financial adviser regarding the suitability of the investment, under a separate engagement, as you deem fit.
You accept that you assume all risks in independently viewing the contents and selecting a chosen strategy.
Where the research is distributed in Singapore to a person who is not an Accredited Investor, Expert Investor or an Institutional Investor, Oanda Asia Pacific Pte Ltd (“OAP“) accepts legal responsibility for the contents of the report to such persons only to the extent required by law. Singapore customers should contact OAP at 6579 8289 for matters arising from, or in connection with, the information/research distributed.

NZDUSD: Bears Will Push Lower
Remember that we can not, and should not impose our will on the market but rather listen to its whims and make profit by following it. And thus shall be done today on the NZDUSD pair which is likely to be pushed down by the bears so we will sell!
Disclosure: I am part of Trade Nation's Influencer program and receive a monthly fee for using their TradingView charts in my analysis.
❤️ Please, support our work with like & comment! ❤️

nzdusd sell signal. Don't forget about stop-loss.
Write in the comments all your questions and instruments analysis of which you want to see.
Friends, push the like button, write a comment, and share with your mates - that would be the best THANK YOU.
P.S. I personally will open entry if the price will show it according to my strategy.
Always make your analysis before a trade

Falling towards pullback support?The Kiwi (NZD/USD) is falling towards the pivot which has been identified as a pullback support and could bounce to the 1st resistance.
Pivot: 0.5887
1st Support: 0.5828
1st Resistance: 0.6019
Risk Warning:
Trading Forex and CFDs carries a high level of risk to your capital and you should only trade with money you can afford to lose. Trading Forex and CFDs may not be suitable for all investors, so please ensure that you fully understand the risks involved and seek independent advice if necessary.
Disclaimer:
The above opinions given constitute general market commentary, and do not constitute the opinion or advice of IC Markets or any form of personal or investment advice.
Any opinions, news, research, analyses, prices, other information, or links to third-party sites contained on this website are provided on an "as-is" basis, are intended only to be informative, is not an advice nor a recommendation, nor research, or a record of our trading prices, or an offer of, or solicitation for a transaction in any financial instrument and thus should not be treated as such. The information provided does not involve any specific investment objectives, financial situation and needs of any specific person who may receive it. Please be aware, that past performance is not a reliable indicator of future performance and/or results. Past Performance or Forward-looking scenarios based upon the reasonable beliefs of the third-party provider are not a guarantee of future performance. Actual results may differ materially from those anticipated in forward-looking or past performance statements. IC Markets makes no representation or warranty and assumes no liability as to the accuracy or completeness of the information provided, nor any loss arising from any investment based on a recommendation, forecast or any information supplied by any third-party.

NZD_USD SUPPORT AHEAD|LONG|
✅NZD_USD is going down now
But a strong support level is ahead at 0.5926
Thus I am expecting a rebound
And a move up towards the target at 0.5983
LONG🚀
✅Like and subscribe to never miss a new idea!✅
Disclosure: I am part of Trade Nation's Influencer program and receive a monthly fee for using their TradingView charts in my analysis.
NZDUSD Will Collapse! SELL!
My dear friends,
My technical analysis for NZDUSD is below:
The market is trading on 0.5997 pivot level.
Bias - Bearish
Technical Indicators: Both Super Trend & Pivot HL indicate a highly probable Bearish continuation.
Target -0.5855
Recommended Stop Loss - 0.6073
About Used Indicators:
A pivot point is a technical analysis indicator, or calculations, used to determine the overall trend of the market over different time frames.
Disclosure: I am part of Trade Nation's Influencer program and receive a monthly fee for using their TradingView charts in my analysis.
———————————
WISH YOU ALL LUCK

Bearish correctionKiwi Dollar found bullish pressure on 0.55000 barrier and managed to target the resistance barrier at 0.58000. Price action further pushed but is facing massive resistance at the 0.60000 region. As of now, as long as price action remains below the 0.60000 barrier, the pair is likely going to find support towards the 0.58000, which was a previous resistance barrier turned into support. Price action may also likely go further down if it settles under the 0.58000 barrier.
