NZDUSD: Bullish Rally Continues 🇳🇿🇺🇸
NZDUSD is unstoppable.
The price is currently breaking one more daily resistance cluster.
It looks to me that bulls will continue pushing the market up
at least to 0.6018 resistance.
❤️Please, support my work with like, thank you!❤️
NZDUSD trade ideas

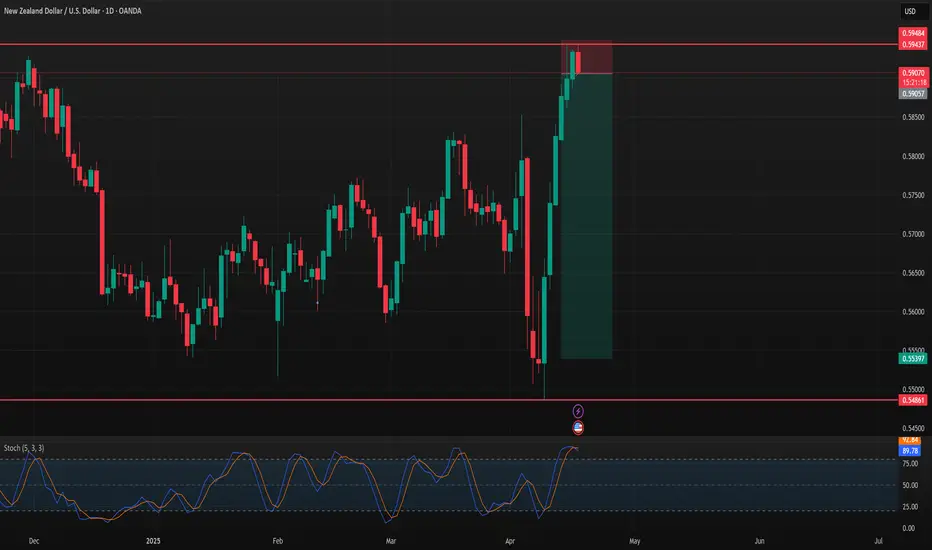
NZDUSD 1 D ChartThis is the 1 D Chart of NZDUSD, I am publishing this chart for further informational analysis. Ideally, further analysis will use smart money concepts, ICT, and wick candle analysis.

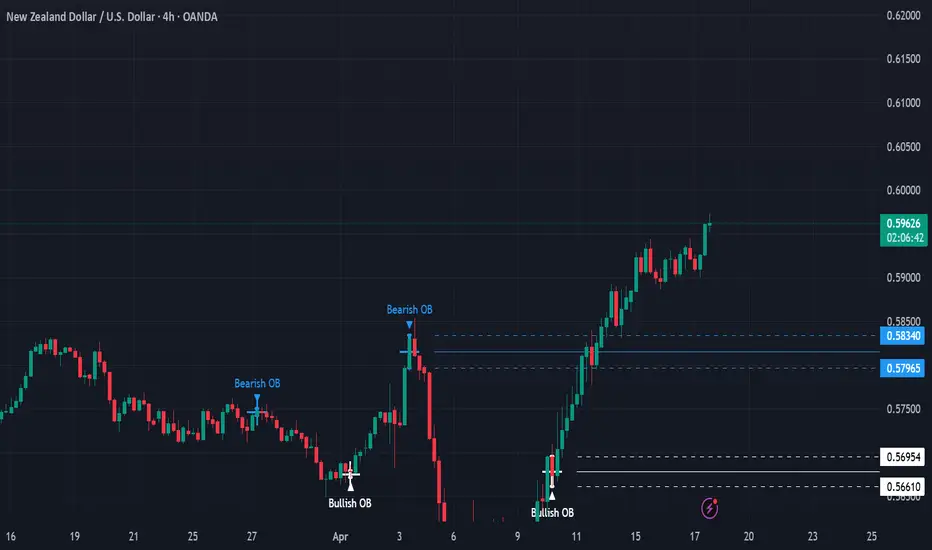
NZDUSD 4 HR ChartThis is the 4 HR Chart of NZDUSD, I am publishing this chart for further informational analysis. Ideally, further analysis will use smart money concepts, ICT, and wick candle analysis.
Update idea
Add note
NZDUSD 1 HR ChartThis is the 1 HR Chart of NZDUSD, I am publishing this chart for further informational analysis. Ideally, further analysis will use smart money concepts, ICT, and wick candle analysis.

NZDUSD 15 M ChartThis is the 15 M Chart of NZDUSD, I am publishing this chart for further informational analysis. Ideally, further analysis will use smart money concepts, ICT, and wick candle analysis.


NZDUSD: Will Start Falling! Here is Why:
Remember that we can not, and should not impose our will on the market but rather listen to its whims and make profit by following it. And thus shall be done today on the NZDUSD pair which is likely to be pushed down by the bears so we will sell!
Disclosure: I am part of Trade Nation's Influencer program and receive a monthly fee for using their TradingView charts in my analysis.
❤️ Please, support our work with like & comment! ❤️

NZDUSD - Bearish Trend Forming on DailyWe may have a continous trend forming on the daily. The Stochastic is in a heavy overbought region, and Moving averages are slowing starting to cross.
NZDUSD → Is there a chance for continued growth?FX:NZDUSD within the framework of the rally, which is associated with a strong decline in the dollar, is exiting the ascending channel and testing the resistance at 0.5922.
Against the backdrop of the falling dollar, which is associated with economic factors, the New Zealand has good chances to continue to grow. Consolidation of the currency pair above the level will indicate the readiness of the currency pair to continue to grow.
But! Today is quite a day full of economic news. Traders are waiting for Core retail sales & retail sales, as well as Powell's speech at 17:15 UTC. High volatility is possible!
Resistance levels: 0.5922, 0.6038
Support levels: 0.5853
A small correction may be formed from the resistance, but another retest and price consolidation above 0.5922 may be a good signal for both the bulls and us to make decisions. The currency pair has all chances to reach 0.6000
Regards R. Linda!

NZDUSD ShortA perfect correction trade to continue upwards, this trade can go as far as breaking the low

AUDUSD,GBPUSD and NZDUSDHello traders, this is a complete multiple timeframe analysis of this pair. We see could find significant trading opportunities as per analysis upon price action confirmation we may take this trade. Smash the like button if you find value in this analysis and drop a comment if you have any questions or let me know which pair to cover in my next analysis.

SHORT ON NZD/USDPrice is in a overall uptrend but has started its pullback phase from the high.
Got a choc (change of character) to the downside as well as equal highs/ double top forming.
Dollar news just came out positive and there is a good chance this pair could fall 200-300 pips by the end of the week.

NZD/USD Hits Resistance: Overbought Signals DetectedFenzoFx—NZD/USD is trading at $0.593, a resistance area, with overbought signals from the Stochastic and RSI 14 indicators.
Traders are advised to wait for consolidation, as the price may dip toward $0.5855 and $0.5769.
>>> No Deposit Bonus
>>> %100 Deposit Bonus
>>> Forex Analysis Contest
All at F enzo F x Decentralized Forex Broker


NZDUSD Discretionary Analysis: Bounce at 0.59Hello traders.
NZDUSD has potential for me. I'm expecting the momentum to continue, and I've got my eye on that 0.59 level to get involved. That's where I'll be looking for a setup.
Discretionary Trading: Where Experience Becomes the Edge
Discretionary trading is all about making decisions based on what you see, what you feel, and what you've learned through experience. Unlike systematic strategies that rely on fixed rules or algorithms, discretionary traders use their judgment to read the market in real time. It's a skill that can't be rushed, because it's built on screen time, pattern recognition, and the ability to stay calm under pressure.
There's no shortcut here. You need to see enough market conditions, wins, and losses to build that intuition—the kind that tells you when to pull the trigger or sit on your hands. Charts might look the same, but context changes everything, and that's something only experience can teach you.
At the end of the day, discretionary trading is an art, refined over time, sharpened through mistakes, and driven by instinct. It's not for everyone, but for those who've put in the work, it can be a powerful way to trade.

NZDUSD H1 I Bearish Drop Based on the H1 chart, the price is rising toward our sell entry level at 0.5925, a pullback resistance that aligns with the 61.8 Fibo retracement.
Our take profit is set at 0.5855, an overlap support.
The stop loss is set at 0.5970, above the 127.2% Fibo extension.
High Risk Investment Warning
Trading Forex/CFDs on margin carries a high level of risk and may not be suitable for all investors. Leverage can work against you.
Stratos Markets Limited (tradu.com):
CFDs are complex instruments and come with a high risk of losing money rapidly due to leverage. 63% of retail investor accounts lose money when trading CFDs with this provider. You should consider whether you understand how CFDs work and whether you can afford to take the high risk of losing your money.
Stratos Europe Ltd (tradu.com):
CFDs are complex instruments and come with a high risk of losing money rapidly due to leverage. 63% of retail investor accounts lose money when trading CFDs with this provider. You should consider whether you understand how CFDs work and whether you can afford to take the high risk of losing your money.
Stratos Global LLC (tradu.com):
Losses can exceed deposits.
Please be advised that the information presented on TradingView is provided to Tradu (‘Company’, ‘we’) by a third-party provider (‘TFA Global Pte Ltd’). Please be reminded that you are solely responsible for the trading decisions on your account. There is a very high degree of risk involved in trading. Any information and/or content is intended entirely for research, educational and informational purposes only and does not constitute investment or consultation advice or investment strategy. The information is not tailored to the investment needs of any specific person and therefore does not involve a consideration of any of the investment objectives, financial situation or needs of any viewer that may receive it. Kindly also note that past performance is not a reliable indicator of future results. Actual results may differ materially from those anticipated in forward-looking or past performance statements. We assume no liability as to the accuracy or completeness of any of the information and/or content provided herein and the Company cannot be held responsible for any omission, mistake nor for any loss or damage including without limitation to any loss of profit which may arise from reliance on any information supplied by TFA Global Pte Ltd.
The speaker(s) is neither an employee, agent nor representative of Tradu and is therefore acting independently. The opinions given are their own, constitute general market commentary, and do not constitute the opinion or advice of Tradu or any form of personal or investment advice. Tradu neither endorses nor guarantees offerings of third-party speakers, nor is Tradu responsible for the content, veracity or opinions of third-party speakers, presenters or participants.

NZDUSD Will Go Lower! Short!
Here is our detailed technical review for NZDUSD.
Time Frame: 9h
Current Trend: Bearish
Sentiment: Overbought (based on 7-period RSI)
Forecast: Bearish
The market is trading around a solid horizontal structure 0.593.
The above observations make me that the market will inevitably achieve 0.578 level.
P.S
We determine oversold/overbought condition with RSI indicator.
When it drops below 30 - the market is considered to be oversold.
When it bounces above 70 - the market is considered to be overbought.
Disclosure: I am part of Trade Nation's Influencer program and receive a monthly fee for using their TradingView charts in my analysis.
Like and subscribe and comment my ideas if you enjoy them!

NZDUSD: Short Signal with Entry/SL/TP
NZDUSD
- Classic bearish setup
- Our team expects bearish continuation
SUGGESTED TRADE:
Swing Trade
Short NZDUSD
Entry Point - 0.5918
Stop Loss - 0.5991
Take Profit - 0.5782
Our Risk - 1%
Start protection of your profits from lower levels
Disclosure: I am part of Trade Nation's Influencer program and receive a monthly fee for using their TradingView charts in my analysis.
❤️ Please, support our work with like & comment! ❤️

NZD/USD Broke The Res , Good Chance To Buy To Get 200 Pips !Here is my NZD/USD Long Setup , we have a daily closure above the res and also it`s a very good support and we can trust it , we can enter a buy trade if the price go back to retest the broken res , and if we have a good bullish price action then we can enter a buy trade and targeting 200 pips .
This Is An Educational + Analytic Content That Will Teach Why And How To Enter A Trade
Make Sure You Watch The Price Action Closely In Each Analysis As This Is A Very Important Part Of Our Method
Disclaimer : This Analysis Can Change At Anytime Without Notice And It Is Only For The Purpose Of Assisting Traders To Make Independent Investments Decisions.

Plan: NZDUSD BuyAfter valid breakouts on both 15m and 1hr from the range, it might retrace back to the POI at discount zone and continue upwards. The pullback looks significant which is supported by an imbalance candle after that.
Entry: 0.58722
TP: 0.59022
SL: 0.58572
Ratio 1:2

Kiwi H1 | Falling toward an overlap supportThe Kiwi (NZD/USD) is falling towards an overlap support and could potentially bounce off this level to climb higher.
Buy entry is at 0.5840 which is an overlap support that aligns close to the 23.6% Fibonacci retracement.
Stop loss is at 0.5770 which is a level that lies underneath a swing-low support.
Take profit is at 0.5922 which is a swing-high resistance.
High Risk Investment Warning
Trading Forex/CFDs on margin carries a high level of risk and may not be suitable for all investors. Leverage can work against you.
Stratos Markets Limited (tradu.com):
CFDs are complex instruments and come with a high risk of losing money rapidly due to leverage. 63% of retail investor accounts lose money when trading CFDs with this provider. You should consider whether you understand how CFDs work and whether you can afford to take the high risk of losing your money.
Stratos Europe Ltd (tradu.com):
CFDs are complex instruments and come with a high risk of losing money rapidly due to leverage. 63% of retail investor accounts lose money when trading CFDs with this provider. You should consider whether you understand how CFDs work and whether you can afford to take the high risk of losing your money.
Stratos Global LLC (tradu.com):
Losses can exceed deposits.
Please be advised that the information presented on TradingView is provided to Tradu (‘Company’, ‘we’) by a third-party provider (‘TFA Global Pte Ltd’). Please be reminded that you are solely responsible for the trading decisions on your account. There is a very high degree of risk involved in trading. Any information and/or content is intended entirely for research, educational and informational purposes only and does not constitute investment or consultation advice or investment strategy. The information is not tailored to the investment needs of any specific person and therefore does not involve a consideration of any of the investment objectives, financial situation or needs of any viewer that may receive it. Kindly also note that past performance is not a reliable indicator of future results. Actual results may differ materially from those anticipated in forward-looking or past performance statements. We assume no liability as to the accuracy or completeness of any of the information and/or content provided herein and the Company cannot be held responsible for any omission, mistake nor for any loss or damage including without limitation to any loss of profit which may arise from reliance on any information supplied by TFA Global Pte Ltd.
The speaker(s) is neither an employee, agent nor representative of Tradu and is therefore acting independently. The opinions given are their own, constitute general market commentary, and do not constitute the opinion or advice of Tradu or any form of personal or investment advice. Tradu neither endorses nor guarantees offerings of third-party speakers, nor is Tradu responsible for the content, veracity or opinions of third-party speakers, presenters or participants.

FXAN & Heikin Ashi Trade IdeaOANDA:NZDUSD
In this video, I’ll be sharing my analysis of NZDUSD, using FXAN's proprietary algo indicators with my unique Heikin Ashi strategy. I’ll walk you through the reasoning behind my trade setup and highlight key areas where I’m anticipating potential opportunities.
I’m always happy to receive any feedback.
Like, share and comment! ❤️
Thank you for watching my videos! 🙏

NZDUSDhe New Zealand dollar has depreciated slightly against thE US DOLLAR The pair’s movement is shaped by both domestic New Zealand fundamentals and global macroeconomic factors, especially U.S. monetary policy and trade tensions.
Key Fundamental Drivers
Reserve Bank of New Zealand (RBNZ) Policy:
The RBNZ cut its Official Cash Rate (OCR) by 25 basis points to 3.5% in April, citing inflation near the midpoint of its 1–3% target and ongoing economic softness. The central bank signaled further easing is possible, with markets expecting the OCR to reach 3% by year-end. This dovish stance is a key factor weighing on the NZD.
New Zealand Economic Data:
Inflation is at 2.2% year-on-year (Q4).
Unemployment has risen to 5.1%.
The manufacturing PMI has improved to 51.4, indicating some recovery in the sector.
The NZIER Survey of Business Opinion is a near-term event that could impact sentiment if it diverges from expectations.
U.S. Economic and Policy Developments:
The Federal Reserve is expected to consider rate cuts later in 2025, with markets pricing in at least four cuts by year-end.
U.S. economic data releases, including CPI and PPI, will be closely watched for clues on the Fed’s next moves.
Trade tensions remain high, with new tariffs imposed by the U.S. and retaliatory measures from China, creating global uncertainty and risk-off sentiment.
China and Global Trade:
The NZD is sensitive to developments in China, New Zealand’s largest trading partner. Any Chinese stimulus or changes in trade policy can influence the kiwi. Current U.S.-China trade tensions and tariffs are a downside risk for the NZD.
Technical and Sentiment Summary
The NZD/USD pair is in a bearish trend, with technical indicators (RSI, MACD, Stochastic) supporting further downside, though some short-term corrections are possible.
Outlook and Risk
Factor Impact on NZD/USD Directional Bias
RBNZ rate cuts Weighs on NZD Bearish
Weak domestic data Weighs on NZD Bearish
U.S. Fed rate cut prospects Supports NZD (if realized) Bullish (potential)
U.S.-China trade tensions Weighs on NZD Bearish
China stimulus Supports NZD Bullish (potential the path of least resistance remains to the downside unless there is a significant shift in U.S. policy or a positive surprise in New Zealand data.
Conclusion
The NZD/USD is fundamentally pressured by a dovish RBNZ, weak domestic data, and global trade tensions. While a short-term rebound is possible if U.S. dollar sentiment sours or China introduces stimulus, the overall outlook remains cautious with limited upside. Key upcoming events to watch include New Zealand’s business sentiment surveys, U.S. inflation data, and any new developments in global trade policy.
