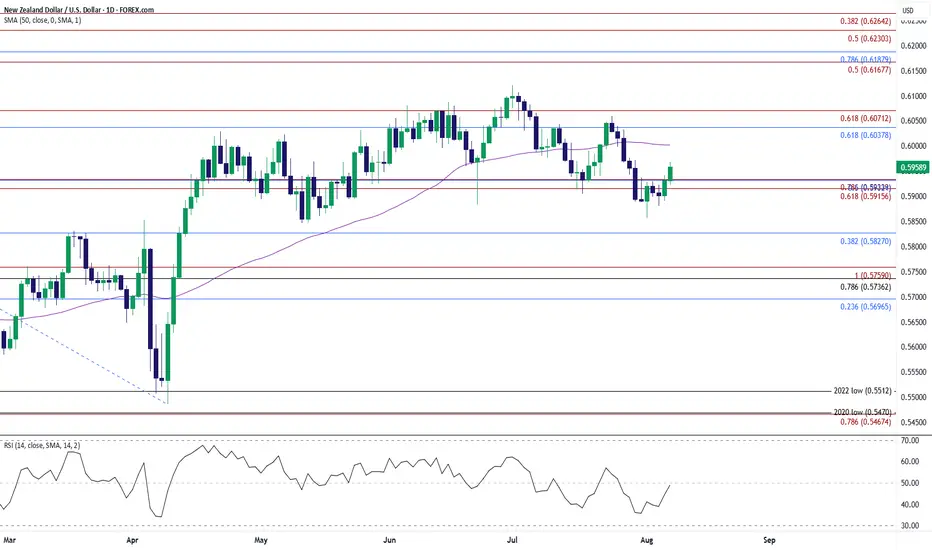
NZDUSD | Daily CLS I Model 1 I 50% CLS TargetHey, Market Warriors ⚔️
Fresh outlook drop — if you’ve been riding with me, you already know:
🎯My system is 100% mechanical. No emotions. No trend lines. No subjective guessing. Just precision, structure, and sniper entries.
🧠 What’s CLS?
It’s the real smart money. The invisible hand behind $7T/day — banks, algos, central players.
📍Model 1:
HTF bias based on the daily and weekly candles closes,
Wait for CLS candle to be created and manipulated. Switch to correct LTF and spot CIOD. Enter and target 50% of the CLS candle.
For high probability include Dealing Ranges, Weekly Profiles and CLS Timing.
Analysis done on the Tradenation Charts
Disclosure: I am part of Trade Nation's Influencer program and receive a monthly fee for using their TradingView charts in my analysis.
Trading is like a sport. If you consistently practice you can learn it.
“Adapt what is useful. Reject whats useless and add whats is specifically yours.”
David Perk aka Dave FX Hunter
💬 Don't hesitate to ask any questions or share your opinions
NZDUSD trade ideas
NZDUSD SELL SETUPWaiting patiently for this on NZDUSD no much movements in the market this week, remember FOMC is coming today - Be watchful

NZDUSD ShortNZDUSD is not net short on the regression break.
I am considering this trade, but it has already gone a long way.

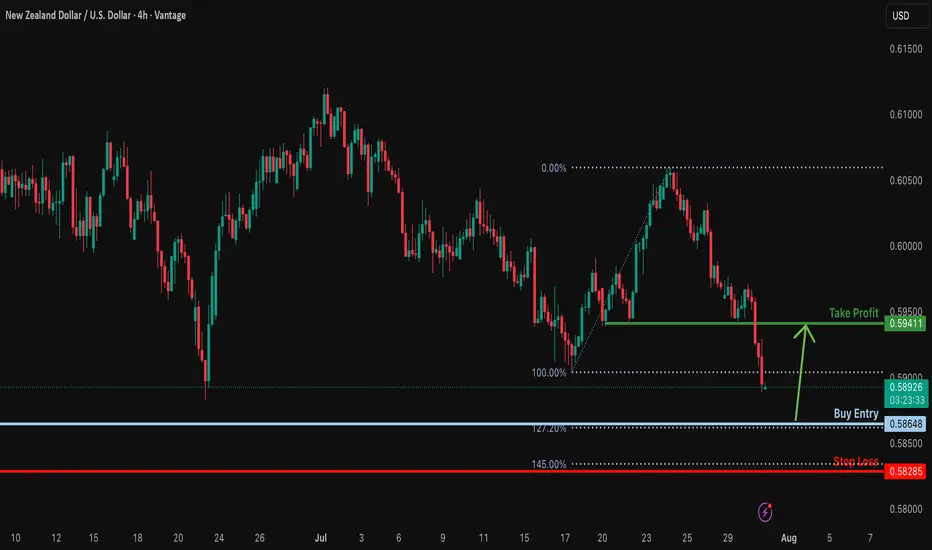
Bullish reversal?NZD/USD is falling towards the support level, which is a swing low support that lines up with the 127.2% Fibonacci extension. Could NZD/USD bounce from this level to our take profit?
Entry: 0.5864
Why we like it:
There is a swing low support that lines up with the 127.2% Fibonacci extension.
Stop loss: 0.5828
Why we like it:
There is a pullback support that lines up with the 145% Fibonacci extension.
Takeprofit: 0.5941
Why we like it:
There is a pullback resistance level.
Enjoying your TradingView experience? Review us!
Please be advised that the information presented on TradingView is provided to Vantage (‘Vantage Global Limited’, ‘we’) by a third-party provider (‘Everest Fortune Group’). Please be reminded that you are solely responsible for the trading decisions on your account. There is a very high degree of risk involved in trading. Any information and/or content is intended entirely for research, educational and informational purposes only and does not constitute investment or consultation advice or investment strategy. The information is not tailored to the investment needs of any specific person and therefore does not involve a consideration of any of the investment objectives, financial situation or needs of any viewer that may receive it. Kindly also note that past performance is not a reliable indicator of future results. Actual results may differ materially from those anticipated in forward-looking or past performance statements. We assume no liability as to the accuracy or completeness of any of the information and/or content provided herein and the Company cannot be held responsible for any omission, mistake nor for any loss or damage including without limitation to any loss of profit which may arise from reliance on any information supplied by Everest Fortune Group.
LONG ON NZD/USDNZD/USD is at a major demand level.
Dollar is bearish. Economic News this afternoon should assist and pushing this pair up.
Looking to catch 200 pips to the previous high.

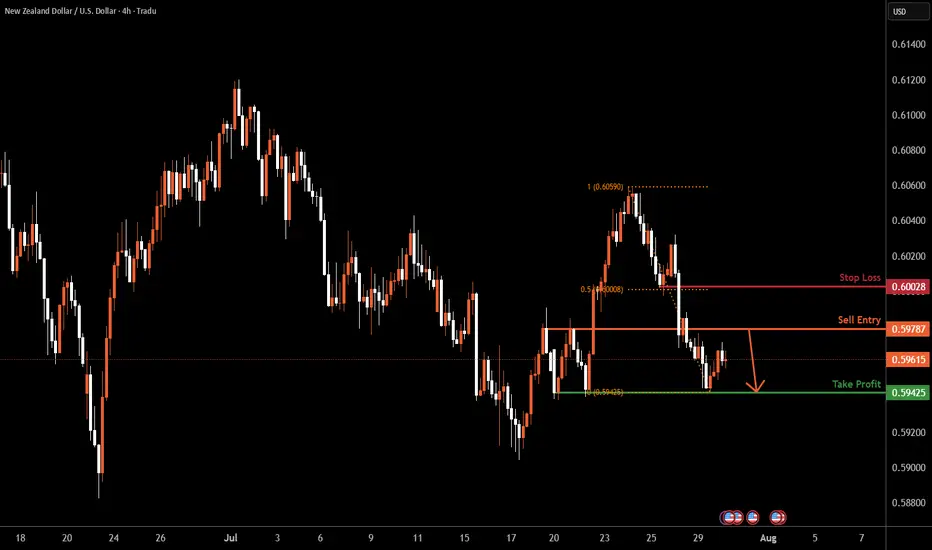
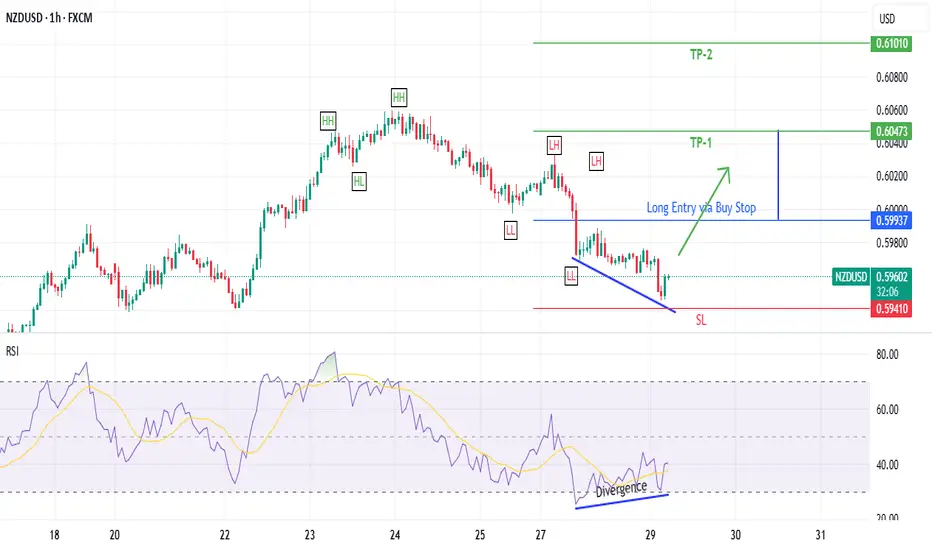
NZDUSD H4 | Bearish dropKiwi (NZD/USD) is rising towards the sell entry, which is a pullback resistance and could reverse from this level and drop lower.
Sell entry is at 0.5978, which is a pullback resistance.
Stop loss is at 0.6002, which is a pullback resistance that lines up with the 50% Fibonacci retracement.
Take profit is at 0.5942, which is a multi-swing low support.
High Risk Investment Warning
Trading Forex/CFDs on margin carries a high level of risk and may not be suitable for all investors. Leverage can work against you.
Stratos Markets Limited (tradu.com ):
CFDs are complex instruments and come with a high risk of losing money rapidly due to leverage. 65% of retail investor accounts lose money when trading CFDs with this provider. You should consider whether you understand how CFDs work and whether you can afford to take the high risk of losing your money.
Stratos Europe Ltd (tradu.com ):
CFDs are complex instruments and come with a high risk of losing money rapidly due to leverage. 66% of retail investor accounts lose money when trading CFDs with this provider. You should consider whether you understand how CFDs work and whether you can afford to take the high risk of losing your money.
Stratos Global LLC (tradu.com ):
Losses can exceed deposits.
Please be advised that the information presented on TradingView is provided to Tradu (‘Company’, ‘we’) by a third-party provider (‘TFA Global Pte Ltd’). Please be reminded that you are solely responsible for the trading decisions on your account. There is a very high degree of risk involved in trading. Any information and/or content is intended entirely for research, educational and informational purposes only and does not constitute investment or consultation advice or investment strategy. The information is not tailored to the investment needs of any specific person and therefore does not involve a consideration of any of the investment objectives, financial situation or needs of any viewer that may receive it. Kindly also note that past performance is not a reliable indicator of future results. Actual results may differ materially from those anticipated in forward-looking or past performance statements. We assume no liability as to the accuracy or completeness of any of the information and/or content provided herein and the Company cannot be held responsible for any omission, mistake nor for any loss or damage including without limitation to any loss of profit which may arise from reliance on any information supplied by TFA Global Pte Ltd.
The speaker(s) is neither an employee, agent nor representative of Tradu and is therefore acting independently. The opinions given are their own, constitute general market commentary, and do not constitute the opinion or advice of Tradu or any form of personal or investment advice. Tradu neither endorses nor guarantees offerings of third-party speakers, nor is Tradu responsible for the content, veracity or opinions of third-party speakers, presenters or participants.
NZDUSD to form a higher low?NZDUSD - 24h expiry
Pivot support is at 0.5935.
We expect a reversal in this move.
Risk/Reward would be poor to call a buy from current levels.
A move through 0.5975 will confirm the bullish momentum.
The measured move target is 0.6000.
We look to Buy at 0.5935 (stop at 0.5910)
Our profit targets will be 0.5985 and 0.6000
Resistance: 0.5975 / 0.5985 / 0.6000
Support: 0.5935 / 0.5925 / 0.5910
Risk Disclaimer
The trade ideas beyond this page are for informational purposes only and do not constitute investment advice or a solicitation to trade. This information is provided by Signal Centre, a third-party unaffiliated with OANDA, and is intended for general circulation only. OANDA does not guarantee the accuracy of this information and assumes no responsibilities for the information provided by the third party. The information does not take into account the specific investment objectives, financial situation, or particular needs of any particular person. You should take into account your specific investment objectives, financial situation, and particular needs before making a commitment to trade, including seeking, under a separate engagement, as you deem fit.
You accept that you assume all risks in independently viewing the contents and selecting a chosen strategy.
Where the research is distributed in Singapore to a person who is not an Accredited Investor, Expert Investor or an Institutional Investor, Oanda Asia Pacific Pte Ltd (“OAP“) accepts legal responsibility for the contents of the report to such persons only to the extent required by law. Singapore customers should contact OAP at 6579 8289 for matters arising from, or in connection with, the information/research distributed.

NZDUSD Short SwingOANDA:NZDUSD Short Swing Trade, with my back testing of this strategy, it hits multiple possible take profits, manage your position accordingly.
This is good trade, don't overload your risk like greedy, be disciplined trader.
I manage trade on daily basis.
this is good trade, lets see, don't be greedy, risk what you can afford.
Use proper risk management
Looks like good trade.
Lets monitor.
Use proper risk management.
Disclaimer: only idea, not advice

looking at usd groupnzdusd seems to be going up. with sister pair audusd and usdcad
+ usd showing immediate strength
- going up movement slow
- previous down is very strong
waiting the sellers to die out
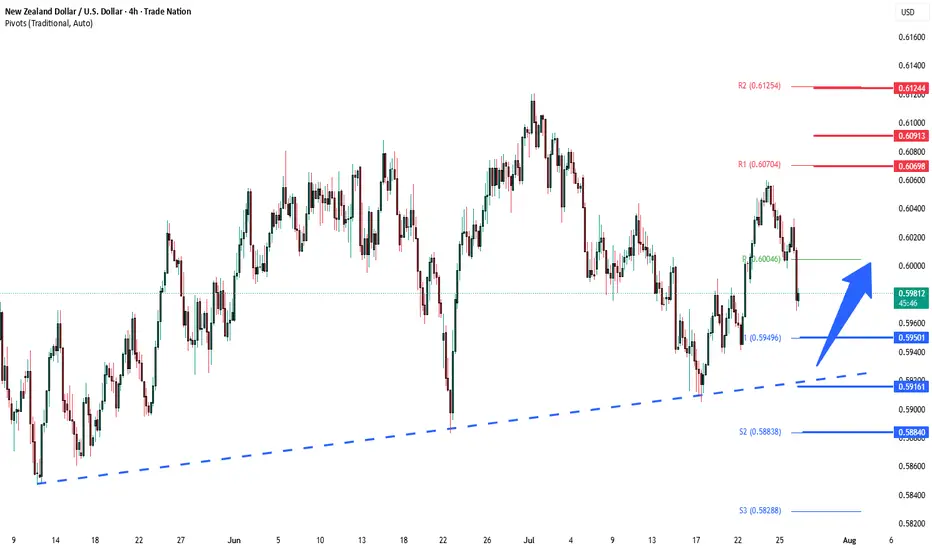
NZDUSD overbought pullback support at 0.5950The NZDUSD remains in a bullish trend, with recent price action showing signs of a corrective pullback within the broader uptrend.
Support Zone: 0.5950 – a key level from previous consolidation. Price is currently testing or approaching this level.
A bullish rebound from 0.5950 would confirm ongoing upside momentum, with potential targets at:
0.6070 – initial resistance
0.6090 – psychological and structural level
0.6125 – extended resistance on the longer-term chart
Bearish Scenario:
A confirmed break and daily close below 0.5950 would weaken the bullish outlook and suggest deeper downside risk toward:
0.5915 – minor support
0.5885 – stronger support and potential demand zone
Outlook:
Bullish bias remains intact while the NZDUSD holds above 0.5950 A sustained break below this level could shift momentum to the downside in the short term.
This communication is for informational purposes only and should not be viewed as any form of recommendation as to a particular course of action or as investment advice. It is not intended as an offer or solicitation for the purchase or sale of any financial instrument or as an official confirmation of any transaction. Opinions, estimates and assumptions expressed herein are made as of the date of this communication and are subject to change without notice. This communication has been prepared based upon information, including market prices, data and other information, believed to be reliable; however, Trade Nation does not warrant its completeness or accuracy. All market prices and market data contained in or attached to this communication are indicative and subject to change without notice.
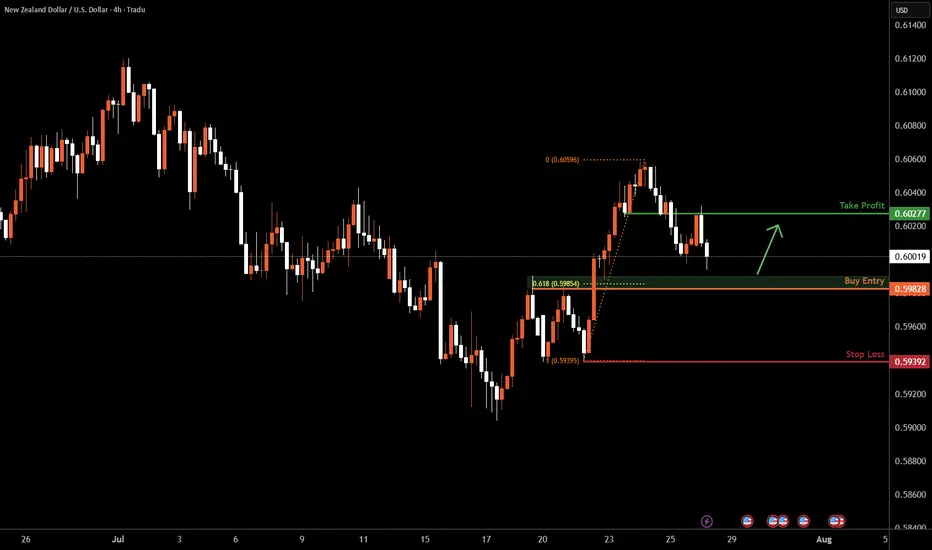
NZDUSD H4 I Bullish Bounce off the 61.8% Based on the H4 chart analysis, we can see that the price is falling toward our buy entry at 0.5982, which is a pullback support that aligns with the 61.8% Fib retracement.
Our take profit will be at 0.6027, which is an overlap resistance level.
The stop loss will be placed at 0.5939, a swing low support.
High Risk Investment Warning
Trading Forex/CFDs on margin carries a high level of risk and may not be suitable for all investors. Leverage can work against you.
Stratos Markets Limited (tradu.com ):
CFDs are complex instruments and come with a high risk of losing money rapidly due to leverage. 66% of retail investor accounts lose money when trading CFDs with this provider. You should consider whether you understand how CFDs work and whether you can afford to take the high risk of losing your money.
Stratos Europe Ltd (tradu.com ):
CFDs are complex instruments and come with a high risk of losing money rapidly due to leverage. 66% of retail investor accounts lose money when trading CFDs with this provider. You should consider whether you understand how CFDs work and whether you can afford to take the high risk of losing your money.
Stratos Global LLC (tradu.com ):
Losses can exceed deposits.
Please be advised that the information presented on TradingView is provided to Tradu (‘Company’, ‘we’) by a third-party provider (‘TFA Global Pte Ltd’). Please be reminded that you are solely responsible for the trading decisions on your account. There is a very high degree of risk involved in trading. Any information and/or content is intended entirely for research, educational and informational purposes only and does not constitute investment or consultation advice or investment strategy. The information is not tailored to the investment needs of any specific person and therefore does not involve a consideration of any of the investment objectives, financial situation or needs of any viewer that may receive it. Kindly also note that past performance is not a reliable indicator of future results. Actual results may differ materially from those anticipated in forward-looking or past performance statements. We assume no liability as to the accuracy or completeness of any of the information and/or content provided herein and the Company cannot be held responsible for any omission, mistake nor for any loss or damage including without limitation to any loss of profit which may arise from reliance on any information supplied by TFA Global Pte Ltd.
The speaker(s) is neither an employee, agent nor representative of Tradu and is therefore acting independently. The opinions given are their own, constitute general market commentary, and do not constitute the opinion or advice of Tradu or any form of personal or investment advice. Tradu neither endorses nor guarantees offerings of third-party speakers, nor is Tradu responsible for the content, veracity or opinions of third-party speakers, presenters or participants.
NZDUSD TRADE SETUPWait for retest the entry and bullish momentum then take a trade for Buy otherwise skip this setup

NZDUSD: More Growth Ahead Next Week 🇳🇿🇺🇸
NZDUSD may continue rising next week after a confirmed bullish
trap that occurred following a text of a key daily horizontal support.
A local consequent Change of Character CHoCH indicates
a strength of the buyers and a highly probable growth.
Next resistance - 0.6
❤️Please, support my work with like, thank you!❤️
I am part of Trade Nation's Influencer program and receive a monthly fee for using their TradingView charts in my analysis.

NZD/USD Climbs to Fresh Weekly HighNZD/USD extends the rebound from the start of the month to register a fresh weekly high (0.5968), and a close above the 0.5920 (61.8% Fibonacci extension) to 0.5930 (78.6% Fibonacci extension) region may push the exchange rate toward the 0.6040 (61.8% Fibonacci retracement) to 0.6070 (61.8% Fibonacci extension) zone.
A breach of the July high (0.6120) opens up the 0.6170 (50% Fibonacci extension) to 0.6190 (78.6% Fibonacci retracement) area, but lack of momentum to close above the 0.5920 (61.8% Fibonacci extension) to 0.5930 (78.6% Fibonacci extension) region may push NZD/USD back toward the monthly low (0.5857).
A breach of the May low (0.5847) brings 0.5830 (38.2% Fibonacci retracement) on the radar, with the next area of interest coming in around 0.5740 (78.6% Fibonacci retracement) to 0.5760 (100% Fibonacci extension).
--- Written by David Song, Senior Strategist at FOREX.com
ENTRY NZDUSDDisclaimer:
This is merely a chart-based analytical trading idea and is not considered investment advice. Please manage your risks carefully and conduct your own research before making any trading decisions.


NZDUSD H4 | Bullish riseThe Kiwi (NZD/USD) has bounced off the buy entry which is a pullback support and could potentially rise from this level to the take profit.
Buy entry is at 0.5926, which is a pullback support.
Stop loss is at 0.5885, which is a swing low support.
Take profit is at 0.5980, which is a pullback resistance that aligns with the 61.8% Fibonacci retracement.
High Risk Investment Warning
Trading Forex/CFDs on margin carries a high level of risk and may not be suitable for all investors. Leverage can work against you.
Stratos Markets Limited (tradu.com ):
CFDs are complex instruments and come with a high risk of losing money rapidly due to leverage. 65% of retail investor accounts lose money when trading CFDs with this provider. You should consider whether you understand how CFDs work and whether you can afford to take the high risk of losing your money.
Stratos Europe Ltd (tradu.com ):
CFDs are complex instruments and come with a high risk of losing money rapidly due to leverage. 66% of retail investor accounts lose money when trading CFDs with this provider. You should consider whether you understand how CFDs work and whether you can afford to take the high risk of losing your money.
Stratos Global LLC (tradu.com ):
Losses can exceed deposits.
Please be advised that the information presented on TradingView is provided to Tradu (‘Company’, ‘we’) by a third-party provider (‘TFA Global Pte Ltd’). Please be reminded that you are solely responsible for the trading decisions on your account. There is a very high degree of risk involved in trading. Any information and/or content is intended entirely for research, educational and informational purposes only and does not constitute investment or consultation advice or investment strategy. The information is not tailored to the investment needs of any specific person and therefore does not involve a consideration of any of the investment objectives, financial situation or needs of any viewer that may receive it. Kindly also note that past performance is not a reliable indicator of future results. Actual results may differ materially from those anticipated in forward-looking or past performance statements. We assume no liability as to the accuracy or completeness of any of the information and/or content provided herein and the Company cannot be held responsible for any omission, mistake nor for any loss or damage including without limitation to any loss of profit which may arise from reliance on any information supplied by TFA Global Pte Ltd.
The speaker(s) is neither an employee, agent nor representative of Tradu and is therefore acting independently. The opinions given are their own, constitute general market commentary, and do not constitute the opinion or advice of Tradu or any form of personal or investment advice. Tradu neither endorses nor guarantees offerings of third-party speakers, nor is Tradu responsible for the content, veracity or opinions of third-party speakers, presenters or participants.

NZDUSD LONG 6-8-2025zxy : bullish
dxy : bearish
trend : bearish
divergence : bullish
continuation : n/a
reversal : bullish divergence
failed to break lat ll
sentiments : neutral 84 % long

NZDUSD bullish view for this week
OANDA:NZDUSD structure based analysis, price in PA bouncing on bottom line, here bullish expectations for this week.
SUP zone: 0.59000
RES zone: 0.60200, 0.60600
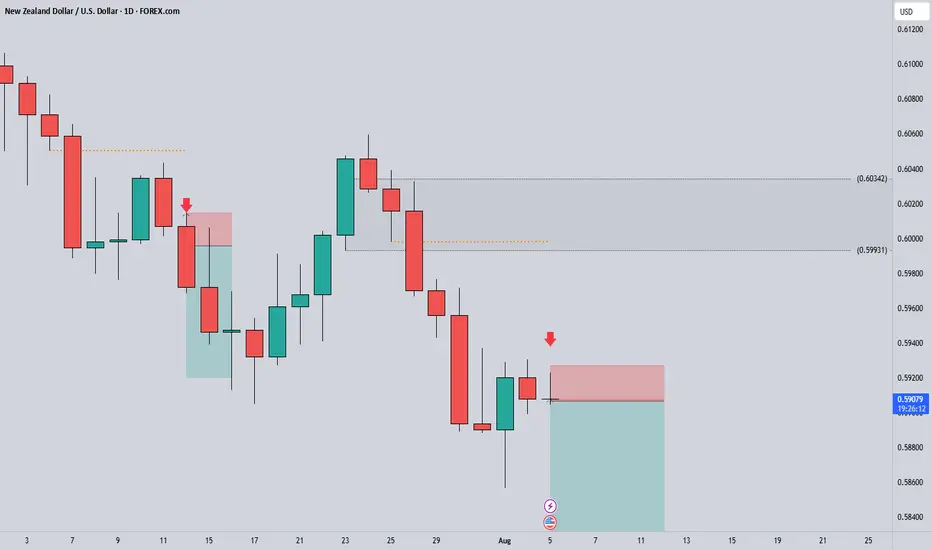
NZDUSD MOVE UP HIGHER TO 0.600looking at NZDUSD on the 4H timeframe.
Price bounced from a green demand/support zone around 0.59140.
There’s an RSI bullish divergence (price was going sideways/down, but RSI was going up)
Strong support zone at 0.59140
The green zone is a clear demand zone or support, where price previously reacted strongly.
Price came back to retest it and bounced — this is classic behavior (liquidity grab → reversal).
RSI is now above 50
Current RSI is about 55.89 and climbing.
That tells you bullish momentum is taking control.
RSI moving above 50 confirms that the pullback is likely over, and buyers are stepping in.
WHAT DO YOU THINK ABOUT THIS IDEA?

NZDUSD Short ProjectHi guys...😎
It's time to do a Short Project on NZDUSD with 3 key reasons:
1. Price Drivers: institutional shorting
2. Trend: down
3. Momentum: bearish
Action: waiting for entry on the intraday timeframe (entry will be published further)
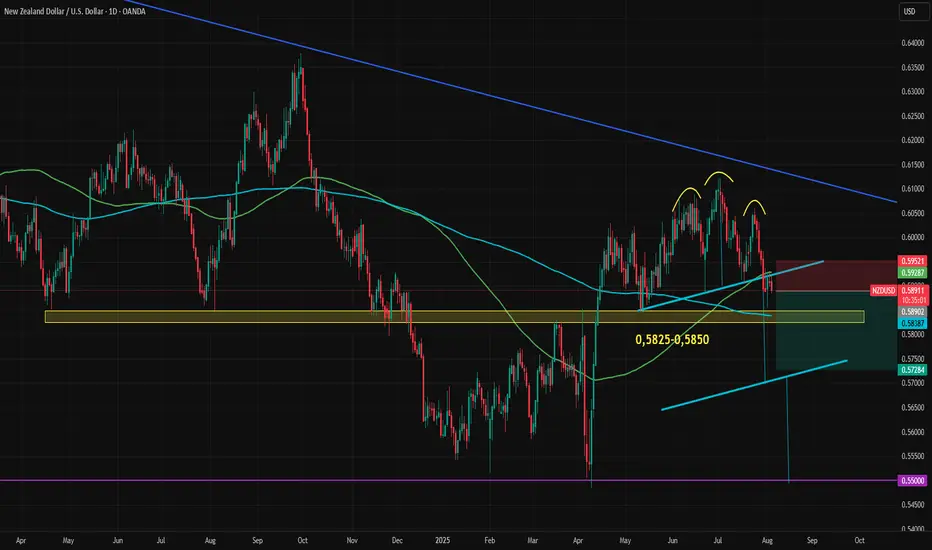
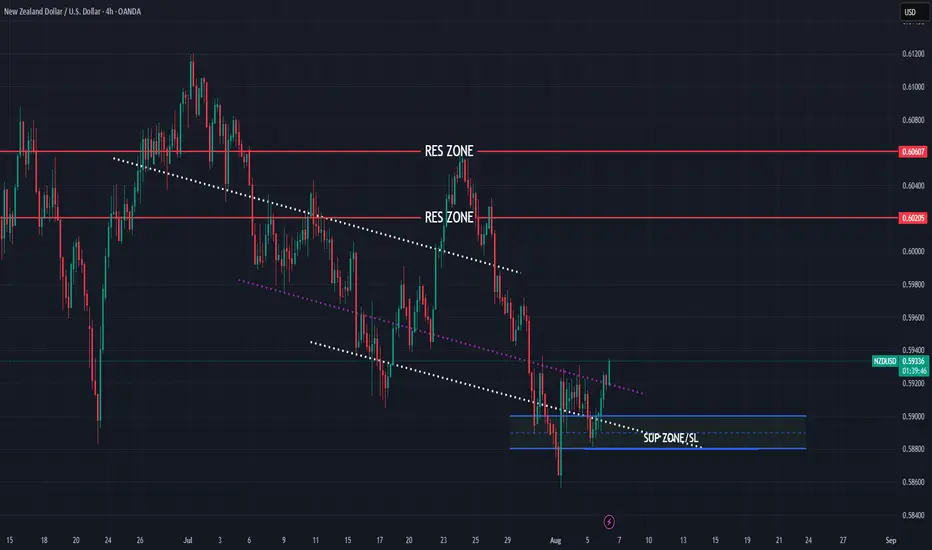
NZDUSD Stuck with Conflicting SignalsNZDUSD is at a key technical junction. The previously broken and retested head and shoulders formation is exerting downward pressure, but the important support zone between 0.5825 and 0.5850 is holding for now. The 100-day and 200-day moving averages have also formed a tight support-resistance range, causing the currency to remain trapped in a narrow range.
Both the Federal Reserve and the Reserve Bank of New Zealand are expected to cut rates twice this year. Growth expectations for 2025 are closely aligned, with only a 0.3-point advantage for the U.S., and the gap is narrowing. Inflation expectations are also similar, with U.S. figures slightly higher, mirroring the GDP trend.
The 2-year bond yield spread between the U.S. and New Zealand has remained flat since April. During that time, NZDUSD climbed from 0.55 to 0.61 before pulling back to the current level near 0.5890.
Similar fundamental statistics and conflicting technical signals have caused NZDUSD to form an uncertain range between 0.5930 on the upside and the 0.5825–0.5850 support zone on the downside. If either of these key levels breaks, volatility may return quickly.
A break above 0.5930, which coincides with both the broken neckline and the 100-day moving average, could push the price toward the descending trendline from the 2021 top (highlighted in blue on the chart). On the other hand, a break below the 0.5825–0.5850 zone which also includes the 200-day moving average, could trigger a move toward the head and shoulders pattern target, currently near 0.57.
The first two weeks of August will be crucial for the dollar index, following the sharp downward revision in payrolls data. Market reaction, revisions to expectations, commentary from Federal Reserve members, and the release of July inflation data will provide greater clarity. This wave of information could finally break NZDUSD out of its current indecisive range.