NZDUSD bullish starting?
OANDA:NZDUSD from start of February sentiment is bullish.
In week before we are have strong events like RBA, TRUMP SPEAK, NONFARM.., we all are expect NZD and AUD domination but at end in zone we are see changes and strong fall.
After all of this now from here expecting new bullish starting.
SUP zone: 0.55200
RES zone: 0.57400, 0.58200
NZDUSD trade ideas

nzdusd longprice recently changed structure from bearish to bullish
now making HL and HH's
trading above my support area

NZD/USD For Bullishwait for pull-back near by entry point and then go long
general trend is up trend
daily bias is up
have fun :)

NZDUSD Long✅ NZD/USD Long Setup
Entry: 0.5520
Stop Loss (SL): 0.5375 (below historical multi-decade support and spike lows — gives room for volatility)
Take Profits (TPs):
TP1: 0.6000 (psychological + historical S/R level)
TP2: 0.6200 (structural supply level)
TP3: 0.6400 (historical resistance zone + cycle high area)

NZDUSD Long Setup – FVG + Order Block + Macro Bullish BiasI'm looking to go long on NZDUSD based on a strong confluence of fundamentals, seasonal trends, and technical structure.
🔹 Macro bias: USD weakening as Fed leans dovish, while NZD is gaining momentum from rate cuts and improving LEI.
🔹 Seasonality: Historically, NZD shows strength in the first half of April, while USD tends to weaken mid-to-late April.
🔹 Technical setup:
Price left a Fair Value Gap (FVG) on the 4H chart
Pullback into a bullish Order Block (OB)
Entry within imbalance

NZDUSD SHORTSNZDUSD has a break in corellation with AUDUSD, the SMT divergence while staying above opening price, so i will choose the NU shorts over the AU

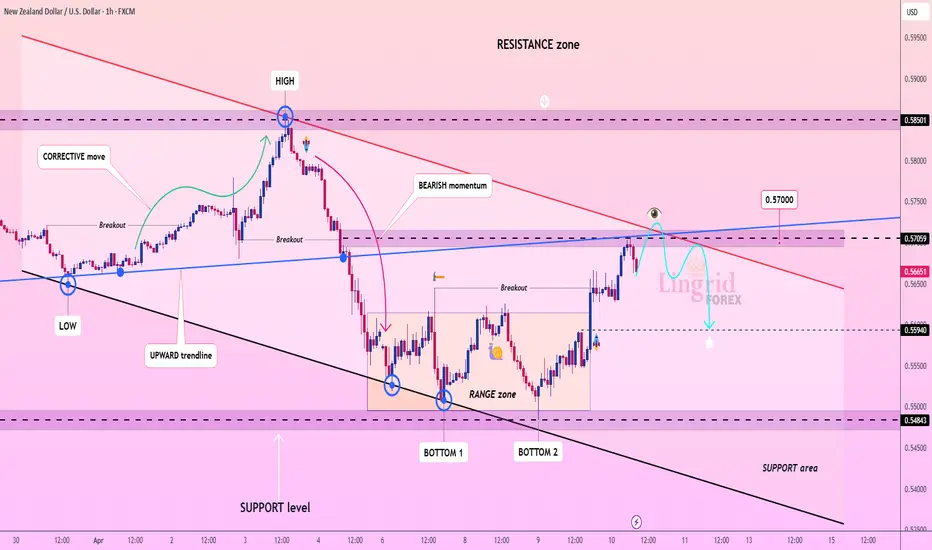
NZDUSD Faces Resistance After Recent Sell-OffFollowing the significant sell-off last week, the NZDUSD price has retraced to approximately 60% of the previous bearish move. The price appears to have encountered resistance at a zone marked by an upward trendline and the boundary of the channel. Additionally, there is a psychological level at 0.57000. Should the price reject this resistance, it may continue to decline and retest the middle of the consolidation range. On the other hand, if upcoming news releases favour the market, there could be potential for a move higher. The target for the market is a resistance zone near 0.55940

Lingrid | NZDUSD potential PULLBACK Trading OpportunityThe price perfectly fulfilled my previous idea . It hit the take profit level. After last week's massive sell-off, FX:NZDUSD price has pulled back toward 60% of the bearish move. The price appears to have bounced off the resistance zone where we have upward trendline and channel border. Additionally, there is a psychological level at 0.57000 as well. I believe the price may move lower and retest the middle of the consolidation zone if the price rejects the resistance. However, the market might move higher if the upcoming news release favors the market. My target is resistance zone around 0.55940
Traders, if you liked this idea or if you have your own opinion about it, write in the comments. I will be glad 👩💻
NZDUSDNZDUSD buy limit trade
B.O.S after bullish divergence ,if retrace to discount zone at FVG with entry 0.5620 Stop loss 0.5565,TP1 0.5674,TP2 0.5723

NZDUSD ANALYSIS
### 🔄 **Basic Structure of Point 1-2-3 Setup**:
1. **Point 1 (P1):** The initial move or swing low/high (starting point).
2. **Point 2 (P2):** The opposite extreme – the highest high (uptrend) or lowest low (downtrend).
3. **Point 3 (P3):** A correction that doesn’t exceed P1, followed by a potential breakout beyond P2 to confirm a new trend.
---
### ✅ **Chart Analysis (NZD/USD, Heikin Ashi, 15 Min)**:
#### 📉 **First Major Bearish Move** (Left side of the chart):
- **P1:** Price peaks (Point 2 is marked near 0.571xx).
- **P2:** Swing low around 0.563xx (Point 2 in white).
- **P3:** Retracement (fails to break the initial high, confirming potential trend change).
- Then the price **breaks below P2**, confirming a **new downtrend**.
This bearish structure played out with a **short position**, visualized by the red trade box.
---
#### 📈 **Reversal to Bullish Trend** (Middle to right side):
- After a long downtrend, a shift occurs.
- New **Point 1**: A swing low forms (around 0.558xx).
- **Point 2**: Price pushes up to a local high (confirmed with white lines).
- **Point 3**: Retracement that stays above Point 1 (0.558xx zone).
Then:
- **TST (Test)** occurs: Price revisits P3 zone but holds.
- Break above **Point 2** confirms **bullish trend**.
- We see **multiple fractal P1-2-3 formations** up the rally:
- Smaller structures form within the bigger bullish move (each followed by breakouts).
---
### 📌 **Most Recent Trade Setup (Far Right)**:
- **P1:** Swing low (end of pullback).
- **P2:** Local peak after a bullish impulse.
- **P3:** Pullback that doesn’t break P1.
- **Breakout above P2 confirms long position**, shown by the current green box trade setup.
This trade is still active, with the price hovering slightly above entry.
---
### 🧠 Summary (Das Voigt Logic Applied):
- The chart follows textbook **Point 1-2-3 trend development**, first bearish, then a clean shift to bullish.
- Multiple entries are possible using **sub-structures** within the main trend.
- The key is **waiting for P3 to hold** and then **confirmation via breakout of P2**.
Would you like me to mark up the chart with the Point 1, 2, 3 labels and send it back for clarity?

Kiwi H1 | Falling to an overlap suppportThe Kiwi (NZD/USD) is falling towards an overlap support and could potentially bounce off this level to climb higher.
Buy entry is at 0.5648 which is an overlap support.
Stop loss is at 0.5605 which is a level that lies underneath a pullback support and the 38.2% Fibonacci retracement.
Take profit is at 0.5746 which is a pullback resistance that aligns close to the 61.8% Fibonacci projection.
High Risk Investment Warning
Trading Forex/CFDs on margin carries a high level of risk and may not be suitable for all investors. Leverage can work against you.
Stratos Markets Limited (tradu.com):
CFDs are complex instruments and come with a high risk of losing money rapidly due to leverage. 63% of retail investor accounts lose money when trading CFDs with this provider. You should consider whether you understand how CFDs work and whether you can afford to take the high risk of losing your money.
Stratos Europe Ltd (tradu.com):
CFDs are complex instruments and come with a high risk of losing money rapidly due to leverage. 63% of retail investor accounts lose money when trading CFDs with this provider. You should consider whether you understand how CFDs work and whether you can afford to take the high risk of losing your money.
Stratos Global LLC (tradu.com):
Losses can exceed deposits.
Please be advised that the information presented on TradingView is provided to Tradu (‘Company’, ‘we’) by a third-party provider (‘TFA Global Pte Ltd’). Please be reminded that you are solely responsible for the trading decisions on your account. There is a very high degree of risk involved in trading. Any information and/or content is intended entirely for research, educational and informational purposes only and does not constitute investment or consultation advice or investment strategy. The information is not tailored to the investment needs of any specific person and therefore does not involve a consideration of any of the investment objectives, financial situation or needs of any viewer that may receive it. Kindly also note that past performance is not a reliable indicator of future results. Actual results may differ materially from those anticipated in forward-looking or past performance statements. We assume no liability as to the accuracy or completeness of any of the information and/or content provided herein and the Company cannot be held responsible for any omission, mistake nor for any loss or damage including without limitation to any loss of profit which may arise from reliance on any information supplied by TFA Global Pte Ltd.
The speaker(s) is neither an employee, agent nor representative of Tradu and is therefore acting independently. The opinions given are their own, constitute general market commentary, and do not constitute the opinion or advice of Tradu or any form of personal or investment advice. Tradu neither endorses nor guarantees offerings of third-party speakers, nor is Tradu responsible for the content, veracity or opinions of third-party speakers, presenters or participants.

WHY NZDUSD BULLISH ?? DETAILED TECHNICALS AND FUNDAMENTALSNZDUSD has just completed a clean technical retest at a key demand zone around the 0.5560–0.5600 region and is now showing signs of a strong bullish reversal. The recent structure formed a classic “V-shape” recovery, and price is holding firmly above the psychological level of 0.5700. The market has now reset its lower time frame structure and is preparing for a potential bullish continuation toward the 0.6100 target zone in the coming sessions.
Technically, the pair respected its support zone perfectly after a sharp corrective move from the March highs. The retest confirms previous support turned demand, with the 12H chart indicating a potential bullish breakout setup. With the rejection wicks and impulsive bullish engulfing candle seen in the latest session, the momentum has clearly shifted back in favor of the bulls. I'm eyeing a steady climb toward the 0.6000–0.6100 range, especially if we break above the 0.5800 resistance level decisively.
On the fundamental side, the US dollar is showing signs of exhaustion ahead of key inflation data. Market sentiment is slightly dovish on the Fed’s rate trajectory due to softening labor data and a cooling services sector, while New Zealand is holding a relatively steady economic outlook. Although RBNZ remains cautious, commodity demand and improving risk sentiment are currently supporting the Kiwi. Traders are pricing in reduced rate hike expectations from the Fed, which gives NZD a comparative edge in short to mid-term flows.
With positive technical confluence, shifting fundamentals, and improving global risk appetite, NZDUSD looks poised for a solid upside run. As long as the price stays above 0.5600, I remain bullish. A break above 0.5800 could act as the catalyst for acceleration toward 0.6100, providing a favorable risk-reward opportunity in the current market conditions.

Potential bullish bounce?NZD/USD is falling towards the support level which is a pullback support and could bounce from this level to our take profit.
Entry: 0.5613
Why we like it:
There is a pullback support level.
Stop loss: 0.5551
Why we like it:
There is a pullback support level that lines up with the 61.8% Fibonacci retracement.
Take profit: 0.5707
Why we like it:
There is a pullback resistance level that is slightly below the 161.8% Fibonacci retracement.
Enjoying your TradingView experience? Review us!
Please be advised that the information presented on TradingView is provided to Vantage (‘Vantage Global Limited’, ‘we’) by a third-party provider (‘Everest Fortune Group’). Please be reminded that you are solely responsible for the trading decisions on your account. There is a very high degree of risk involved in trading. Any information and/or content is intended entirely for research, educational and informational purposes only and does not constitute investment or consultation advice or investment strategy. The information is not tailored to the investment needs of any specific person and therefore does not involve a consideration of any of the investment objectives, financial situation or needs of any viewer that may receive it. Kindly also note that past performance is not a reliable indicator of future results. Actual results may differ materially from those anticipated in forward-looking or past performance statements. We assume no liability as to the accuracy or completeness of any of the information and/or content provided herein and the Company cannot be held responsible for any omission, mistake nor for any loss or damage including without limitation to any loss of profit which may arise from reliance on any information supplied by Everest Fortune Group.

NZD_USD SHORT FROM RESISTANCE|
✅NZD_USD will soon retest a key resistance level of 0.5680
So I think that the pair will make a pullback
And go down to retest the demand level of 0.5620 below
SHORT🔥
✅Like and subscribe to never miss a new idea!✅
Disclosure: I am part of Trade Nation's Influencer program and receive a monthly fee for using their TradingView charts in my analysis.

sells for nzdusdselling this morning market structure and price action are very valid
no reason to try and buy this market.
weather you looking at the four hour or 15 min the price action is giving sells


NZDUSD - Golden Opportunity Alert This pair has been consistently breaking lows for a while — but things just got interesting. It’s now sitting at a key yearly support level, and we're still firmly within a large bullish range.
📈 Translation? Now is the time to buy.
This setup is looking like a textbook bounce opportunity. Not only is this one of the cheapest dollar pairs available right now, but with the dollar continuing its broader decline, this could be the best pair to capitalize on in the current market.
⚡ Don’t sleep on this move. Timing is everything.
Let me know what you think — and if this breakdown helped you, drop a comment or share it with someone who needs to see it!

buy usd/nzdThe Reserve Bank of New Zealand (RBNZ) is expected to cut the Official Cash Rate (OCR) by 25 basis points (bps) to 3.5% tomorrow, as global economic conditions and domestic data signal a weaker outlook. While there are risks of a larger cut, the RBNZ is likely to hold back, as uncertainties surrounding the global trade environment, particularly tensions between the US and China, are contributing to global growth concerns.
The New Zealand economy is facing sluggish growth, with recent domestic business surveys showing weak economic indicators and lower-than-expected GDP growth for Q1. Despite this, the RBNZ is still inclined to reduce the OCR further, with the intention of bringing it closer to a neutral level of around 3%. However, they will likely avoid committing to a sub-3% OCR at this stage, leaving that decision for future discussions in May.
The RBNZ aims to avoid creating market instability with a dramatic policy shift, opting instead to focus on financial stability and making gradual adjustments. The May Monetary Policy Statement will provide clearer guidance as the economic outlook and budget details become more defined. The current OCR forecast of 3.25% may be revised downwards, reflecting the growing downside risks.

NZDUSD ShortMarket structure bearish on HTFs 3
Entry at both Weekly and Daily AOi
Weekly Rejection At AOi
Daily Rejection At AOi
Previous Structure point Daily
H4 EMA retest
H4 Candlestick rejection
Rejection from Previous structure
Levels 5.95
Entry 105
REMEMBER : Trading is a Game Of Probability
: Manage Your Risk
: Be Patient
: Every Moment Is Unique
: Rinse, Wash, Repeat!
: Christ is King.

NZD/USD buy positionthis is a 95% probable trade. the trade we in wave 1 on a huge impulse to the upside

Bearish continuation?NZD/USD is rising towards the resistance level which is a pullback resistance and could drop from this level to our take profit.
Entry: 0.5587
Why we like it:
There is a pullback resistance level.
Stop loss: 0.5623
Why we like it:
There is a pullback resistance level.
Take profit: 0.5510
Why we like it:
There is a pullback support level.
Enjoying your TradingView experience? Review us!
Please be advised that the information presented on TradingView is provided to Vantage (‘Vantage Global Limited’, ‘we’) by a third-party provider (‘Everest Fortune Group’). Please be reminded that you are solely responsible for the trading decisions on your account. There is a very high degree of risk involved in trading. Any information and/or content is intended entirely for research, educational and informational purposes only and does not constitute investment or consultation advice or investment strategy. The information is not tailored to the investment needs of any specific person and therefore does not involve a consideration of any of the investment objectives, financial situation or needs of any viewer that may receive it. Kindly also note that past performance is not a reliable indicator of future results. Actual results may differ materially from those anticipated in forward-looking or past performance statements. We assume no liability as to the accuracy or completeness of any of the information and/or content provided herein and the Company cannot be held responsible for any omission, mistake nor for any loss or damage including without limitation to any loss of profit which may arise from reliance on any information supplied by Everest Fortune Group.

NZDUSD to see a temporary move higher?NZDUSD - 24h expiry
There is no indication that the selloff is coming to an end.
A higher correction is expected.
Risk/Reward would be poor to call a sell from current levels.
A move through 0.5600 will confirm the bearish momentum.
The measured move target is 0.5525.
We look to Sell at 0.5650 (stop at 0.5700)
Our profit targets will be 0.5550 and 0.5525
Resistance: 0.5625 / 0.5650 / 0.5675
Support: 0.5600 / 0.5550 / 0.5525
Risk Disclaimer
The trade ideas beyond this page are for informational purposes only and do not constitute investment advice or a solicitation to trade. This information is provided by Signal Centre, a third-party unaffiliated with OANDA, and is intended for general circulation only. OANDA does not guarantee the accuracy of this information and assumes no responsibilities for the information provided by the third party. The information does not take into account the specific investment objectives, financial situation, or particular needs of any particular person. You should take into account your specific investment objectives, financial situation, and particular needs before making a commitment to trade, including seeking advice from an independent financial adviser regarding the suitability of the investment, under a separate engagement, as you deem fit.
You accept that you assume all risks in independently viewing the contents and selecting a chosen strategy.
Where the research is distributed in Singapore to a person who is not an Accredited Investor, Expert Investor or an Institutional Investor, Oanda Asia Pacific Pte Ltd (“OAP“) accepts legal responsibility for the contents of the report to such persons only to the extent required by law. Singapore customers should contact OAP at 6579 8289 for matters arising from, or in connection with, the information/research distributed.

NZDUSD: Support & Resistance Analysis and Key Levels 🇳🇿🇺🇸
Here is my latest structure analysis and
important supports & resistances on NZDUSD.
Support 1: 0.5506 - 0.5538 area
Support 2: 0.5470 - 0.5479 area
Resistance 1: 0.5644 - 0.5683 area
Resistance 2: 0.5796 - 0.5854 area
Consider these structures for pullback/breakout trading.
❤️Please, support my work with like, thank you!❤️
I am part of Trade Nation's Influencer program and receive a monthly fee for using their TradingView charts in my analysis.
