NZDUSD ShortThere is a divergence within the PVG area. Following a Change of Character (CoCH) in the previous H4 time frame, and with the MA50 positioned below the MA200, this indicates an ongoing downtrend correction. Consequently, I have decided to take a short position.
NZDUSD trade ideas

NZDUSD H4 Long UpdateRemember, successful trading relies on proper risk management and a disciplined approach. Use stop-losses to safeguard your assets and carefully plan each trade. Analysis is the key to making informed decisions. Stay updated and continue refining your strategies!

Heading into overlap resistance?The Kiwi (NZD/USD) is rising towards the pivot which has been identified as an overlap resistance and could reverse to the 1st support.
Pivot: 0.5693
1st Support: 0.5633
1st Resistance: 0.5732
Risk Warning:
Trading Forex and CFDs carries a high level of risk to your capital and you should only trade with money you can afford to lose. Trading Forex and CFDs may not be suitable for all investors, so please ensure that you fully understand the risks involved and seek independent advice if necessary.
Disclaimer:
The above opinions given constitute general market commentary, and do not constitute the opinion or advice of IC Markets or any form of personal or investment advice.
Any opinions, news, research, analyses, prices, other information, or links to third-party sites contained on this website are provided on an "as-is" basis, are intended only to be informative, is not an advice nor a recommendation, nor research, or a record of our trading prices, or an offer of, or solicitation for a transaction in any financial instrument and thus should not be treated as such. The information provided does not involve any specific investment objectives, financial situation and needs of any specific person who may receive it. Please be aware, that past performance is not a reliable indicator of future performance and/or results. Past Performance or Forward-looking scenarios based upon the reasonable beliefs of the third-party provider are not a guarantee of future performance. Actual results may differ materially from those anticipated in forward-looking or past performance statements. IC Markets makes no representation or warranty and assumes no liability as to the accuracy or completeness of the information provided, nor any loss arising from any investment based on a recommendation, forecast or any information supplied by any third-party.

NZDUSD SHortWhat is our market structure? Well done, bearish, now an ascending channel has been created that has broken the bottom twice and the price has been directed upwards; now, however, the trend strength is not good and I think the price will fall.

NZDUSD Possible SellNZDUSD is a strong downtrend and price is currently forming a bearish flag . A sell is in place once the price pull back up into the bearish OB . A second entry would be to wait for the price to break down out of the channel and the blue support line .
Good LUck

nzdusd buy tradeThe Relative Strength Index (RSI) is showing an upward trend, indicating increasing momentum. Additionally, the Moving Average Convergence Divergence (MACD) is showing a bullish crossover, further supporting the potential for an upward move.

NZDUSD BUY4 hour Change of character with possibility of moving further up to make 4 hour right shoulder
NZDUSD Potential DownsidesHey Traders, in today's trading session we are monitoring NZDUSD for a selling opportunity around 0.56400 zone, NZDUSD is trading in a downtrend and currently is in a correction phase in which it is approaching the trend at 0.56400 support and resistance area.
Trade safe, Joe.

NZDUSD SHORTNZDUSD Short Idea | Rising Channel Rejection
• Price has reached the upper resistance of the rising channel and is showing signs of rejection.
• Bearish price action is forming, indicating a potential downside move

NZDUSD: Bullish Continuation & Long Trade
NZDUSD
- Classic bullish setup
- Our team expects bullish continuation
SUGGESTED TRADE:
Swing Trade
Long NZDUSD
Entry Point - 0.5639
Stop Loss - 0.5608
Take Profit - 0.5693
Our Risk - 1%
Start protection of your profits from lower levels
❤️ Please, support our work with like & comment! ❤️

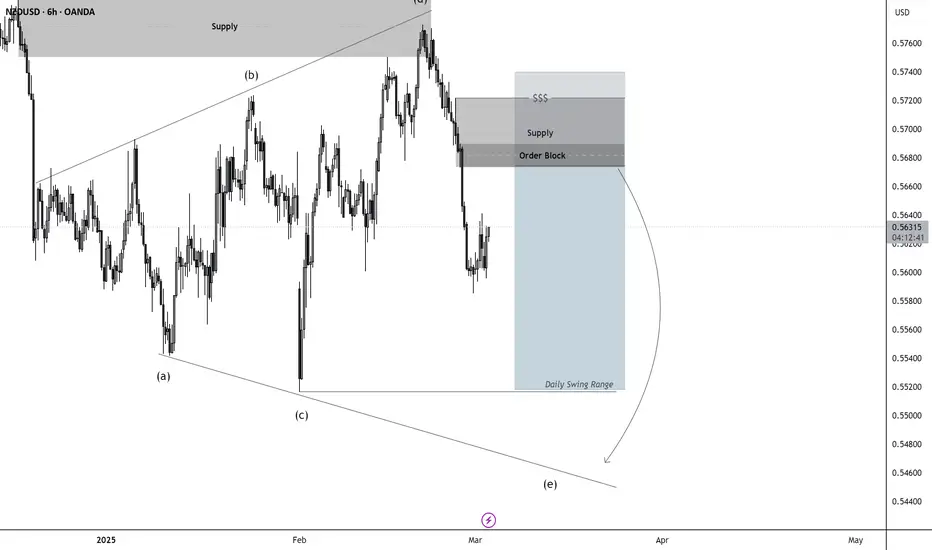
NZD/USD - Sell Limit @0.56743Looking to sell at this 6H order block and strong daily supply zone. I would like to see price rise up slowly filling the previous sell side imbalance before tapping this OB and heading back down taking out sell side Liquidity.
This trade will be a limit order with stop loss sitting just above the high of the supply zone and TP sitting at sell side liquidity.
Good luck to all the traders that decide to follow
NZDUSD - Looking To Sell Pullbacks In The Short TermH1 - Bearish trend pattern
Currently it looks like a pullback is happening
Until the strong resistance zone holds I expect the price to move lower further after pullbacks.

NZDUSD H4 LongThe price has approached a significant support level. According to the analysis I expect a rebound from this level. But do not forget about the fundamental data, which can affect the breakdown of the level. Don't forget to use stop loss

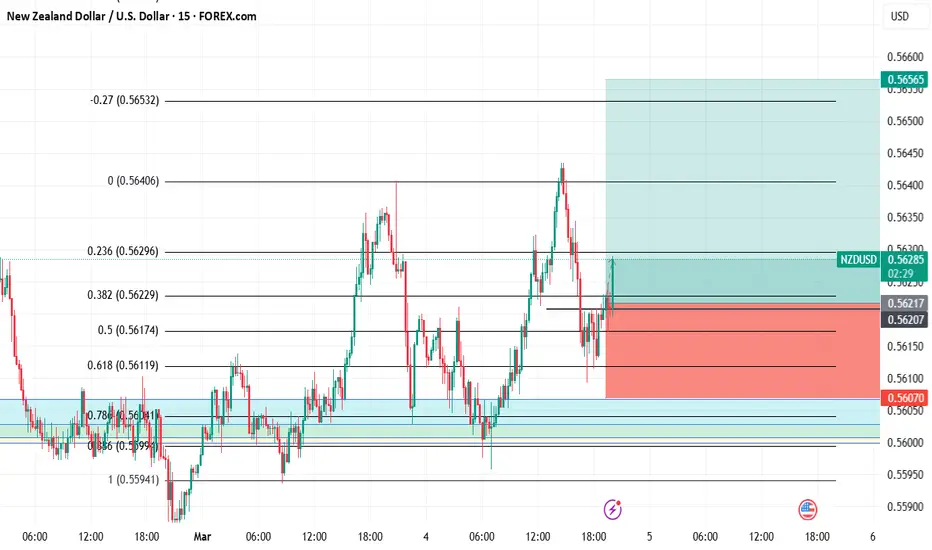
NZDUSD intraday for 70PIPSAlready in, SL and TP on the chart.
Partial TP around 0.5655
Will update if necessary

T/R zones
This idea is based on transient/recurrent zones
Very high probability (90%+) for the price to hit TP.
Probability was calculated on TF 5 min.

NZD/USD Analysis & Probability AssessmentTimeframes Analyzed:
15-Minute (M15)
30-Minute (M30)
1-Hour (H1)
4-Hour (H4)
Daily (D1)
📊 Market Structure Update
✅ Bearish Trend Dominance: The overall structure remains bearish, with multiple Breaks of Structure (BOS) confirming the downtrend.
✅ Current Price Zone (~0.5600 - 0.5620): Price is testing the discount zone, which is a key demand area.
✅ Liquidity Grab Potential: A previous weak low has been taken, indicating possible price reaction.
✅ Premium Zone (~0.5730 - 0.5780): The strongest resistance, where sellers will likely dominate.
🔹 Probability for Trade Setups
1️⃣ Bullish Setup (Higher Probability - 70%)
Entry Zone: 0.5550 - 0.5580 (Discount Zone)
Stop Loss (SL): Below 0.5530
Take Profit (TP): 0.5650 - 0.5670
Probability: 70%
Reasoning:
The discount zone is holding, meaning buyers are stepping in.
RSI recovering from oversold levels.
MACD crossover approaching bullish momentum.
Liquidity sweep of weak lows, increasing reversal chances.
📌 Confirmation Needed:
Bullish candlestick pattern (Engulfing, Hammer, Morning Star)
Volume increase on bullish breakout
RSI moving above 40
2️⃣ Bearish Setup (Lower Probability - 50%)
Entry Zone: 0.5650 - 0.5670 (Resistance Zone)
Stop Loss (SL): Above 0.5700
Take Profit (TP): 0.5580
Probability: 50%
Reasoning:
The overall trend is bearish, but price is at discount demand zone, meaning a reversal is possible.
RSI is still low, signaling price exhaustion.
If price rejects 0.5650 - 0.5670, it could resume downward.
📌 Confirmation Needed:
Bearish candlestick pattern (Engulfing, Shooting Star, Evening Star)
RSI staying below 60
Volume declining near resistance zone
🎯 Final Probability Breakdown
Bullish Trade (Buying at 0.5550 - 0.5580) ➝ 70% Probability
Bearish Trade (Selling at 0.5650 - 0.5670) ➝ 50% Probability
📌 Best Trade for Now: BUY from 0.5550 - 0.5580, as price is reacting to the discount zone and showing bullish signs.

NZDUSDhi guys...
here i just found a chart pattern
don't know it work or not
lets see !!
this chart pattern name is .......
:D
disclaimer this is just information and sharing only

NZDUSDThe NZD/USD pair is showing strong bullish momentum, and we are targeting the 70% Fibonacci retracement level. The recent price action indicates a potential upward movement, supported by positive market sentiment and technical indicators. As the pair approaches the 70% Fib level, we anticipate further buying interest, which could drive the price higher. Traders should keep an eye on key resistance levels and manage their risk accordingly. This setup presents a promising opportunity for those looking to capitalize on the bullish trend.


NZDUSD capped by resistance at 0.5690The NZD/USD currency pair remains in a bearish trend, supported by the longer-term prevailing downtrend. However, recent intraday price action suggests sideways consolidation, indicating a potential buildup before the next significant move.
Bearish Scenario:
The key level to watch is 0.5690, aligning with the previous consolidation zone.
A potential oversold rally toward 0.5690, followed by a bearish rejection, could reaffirm the downtrend.
If sellers regain control, downside targets include 0.5580, followed by 0.5560, with 0.5530 acting as a key longer-term support.
Bullish Scenario:
A confirmed breakout above 0.5690 on a daily close would challenge the bearish outlook.
This could trigger further upside momentum, leading to a test of 0.5716, followed by 0.5770 if bullish pressure strengthens.
A sustained move above 0.5770 could indicate a broader trend shift.
Conclusion:
The overall sentiment remains bearish, but short-term consolidation suggests a possible test of 0.5690 before the next directional move. A bearish rejection at this level would reinforce the downtrend, while a breakout above 0.5690 would open the door for further upside. Traders should monitor price action closely at this key resistance zone for confirmation.
This communication is for informational purposes only and should not be viewed as any form of recommendation as to a particular course of action or as investment advice. It is not intended as an offer or solicitation for the purchase or sale of any financial instrument or as an official confirmation of any transaction. Opinions, estimates and assumptions expressed herein are made as of the date of this communication and are subject to change without notice. This communication has been prepared based upon information, including market prices, data and other information, believed to be reliable; however, Trade Nation does not warrant its completeness or accuracy. All market prices and market data contained in or attached to this communication are indicative and subject to change without notice.

NZDUSD (LONG)
1)inverse head and shoulder/ break of neckline then retest.
2)5 wave impulse Eliot's wave move
3)We in support Zone of weekly pivots.

LONG ON NZD/USDNZD/USD is giving nice uptrend structure from the higher TF.
Currently it has pulled back to a key support area and is looking good for a rise.
Dollar (DXY) is overall bearish and currently falling. (This has a inverse correlation with XXX/USD pairs)
I will be buying NZD/USD to the next resistance level / previous high for about 150-200 pips.

NZDUSD: Bullish Move After a Bearish Trap 🇳🇿🇺🇸
NZDUSD looks bullish after a false breakout of a key daliy support.
An intraday Change of Character on an hourly shows a strong local bullish sentiment.
I will expect a rise to 0.562
❤️Please, support my work with like, thank you!❤️
