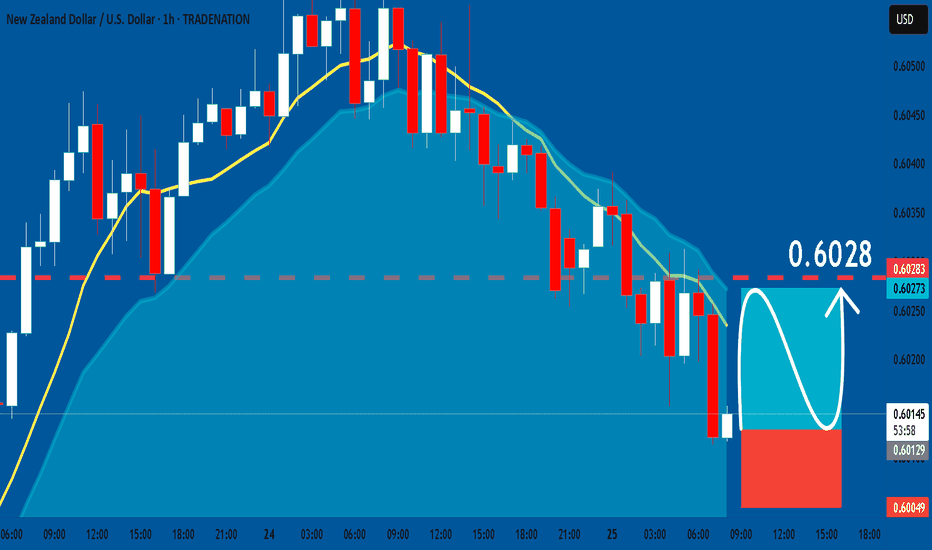
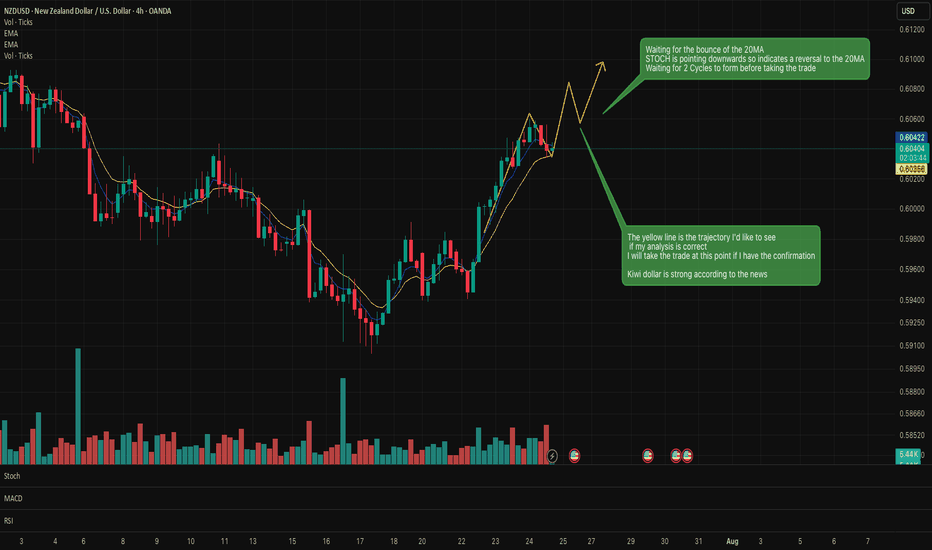
NZDUSD POSSIBLE TRADE SETUPPotential Trade Setup on NZDUSD
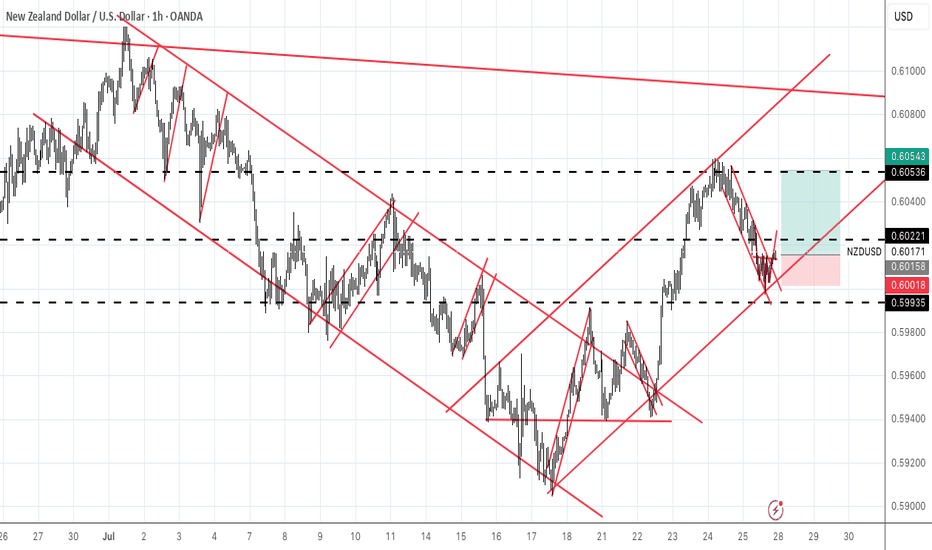
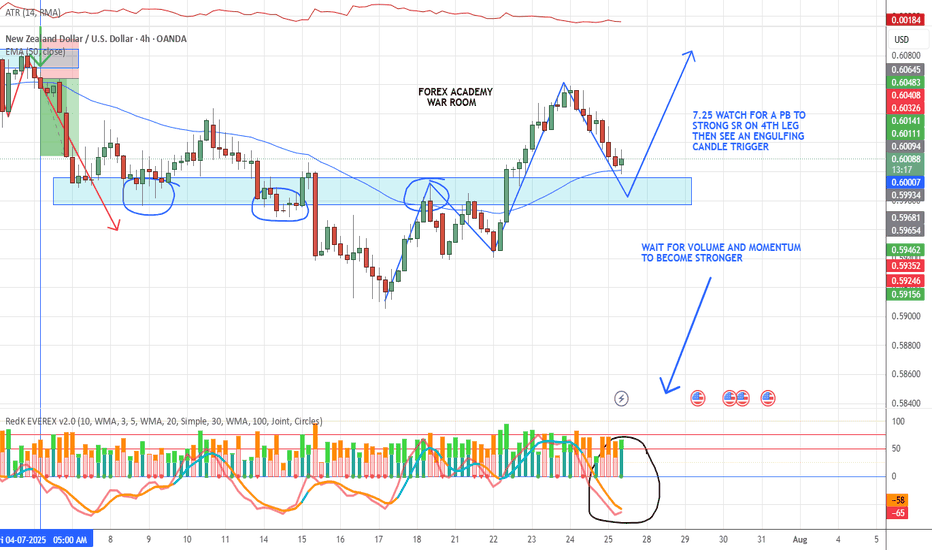
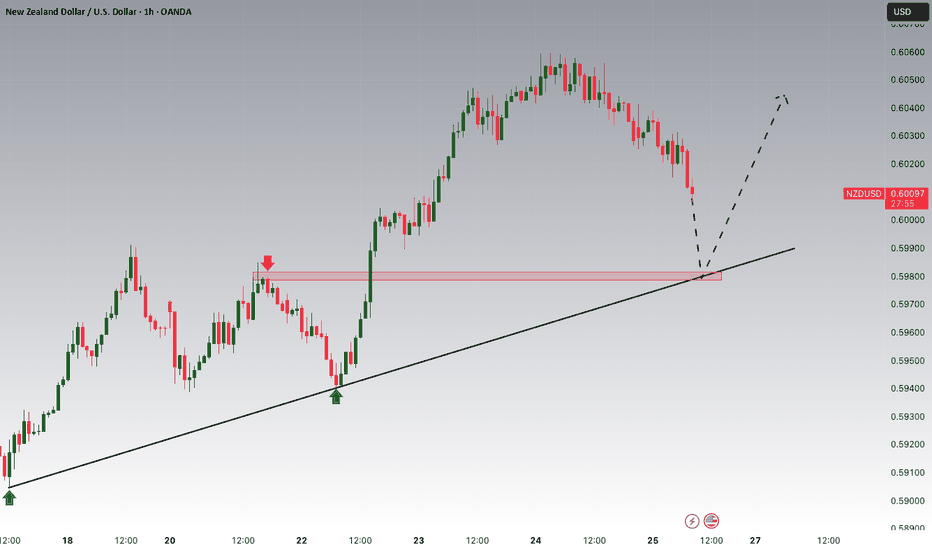
NZDUSD is on a strong 3-week rally correction that almost got broken to the downside last week and successfully retested on Friday
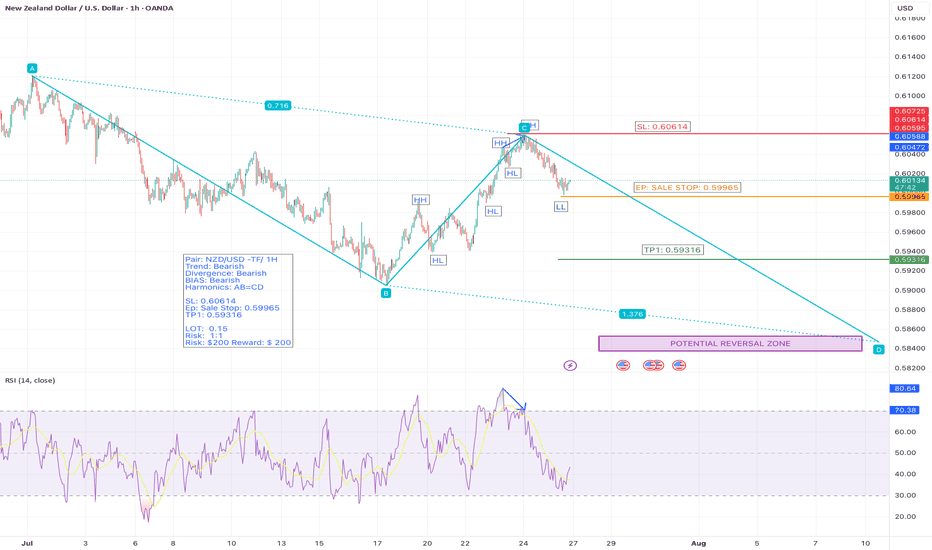
That said, I am still quite anticipating for a possible continuation of the bearish trajectory that started last week to continue towards the MAY low at 0.5880
Trading Plan:
1. SELL: is currently in play, and a further downside movement can be well followed through in the 4H chart.
2. BUY: if the resistance is broken and the retest is successful.
Targets:
1. Can be 1:2 for either entry.
NZDUSD trade ideas
NZDUSD Expected Growth! BUY!
My dear subscribers,
My technical analysis for NZDUSD is below:
The price is coiling around a solid key level - 0.5966
Bias - Bullish
Technical Indicators: Pivot Points Highanticipates a potential price reversal.
Super trend shows a clear buy, giving a perfect indicators' convergence.
Goal - 0.6001
My Stop Loss - 0.5946
About Used Indicators:
By the very nature of the supertrend indicator, it offers firm support and resistance levels for traders to enter and exit trades. Additionally, it also provides signals for setting stop losses
Disclosure: I am part of Trade Nation's Influencer program and receive a monthly fee for using their TradingView charts in my analysis.
———————————
WISH YOU ALL LUCK
NZDUSD My Opinion! BUY!
My dear subscribers,
My technical analysis for NZDUSD is below:
The price is coiling around a solid key level - 0.6015
Bias - Bullish
Technical Indicators: Pivot Points High anticipates a potential price reversal.
Super trend shows a clear buy, giving a perfect indicators' convergence.
Goal - 0.6043
My Stop Loss - 0.5999
About Used Indicators:
By the very nature of the supertrend indicator, it offers firm support and resistance levels for traders to enter and exit trades. Additionally, it also provides signals for setting stop losses
Disclosure: I am part of Trade Nation's Influencer program and receive a monthly fee for using their TradingView charts in my analysis.
———————————
WISH YOU ALL LUCK
Long trade
🟢 Trade Journal Entry – Buyside Trade
📍 Pair: NZDUSD
📅 Date: Tuesday, June 17, 2025
🕒 Time: 3:00 PM (NY Session PM)
⏱ Time Frame: 1 Hour
📈 Direction: Buyside
📊 Trade Breakdown:
Entry Price 0.60143
Profit Level 0.60749 (+1.01%)
Stop Loss 0.60052 (−0.15%)
Risk-Reward
Ratio 6:66 1
🧠 Context / Trade Notes:
1HR OB Entry Zone:
Long trade taken off a bullish order block zone following prior mitigation and consolidation buildup.
Sweep of Internal Liquidity:
Entry positioned after a sweep of a short-term low and rejection off internal demand.
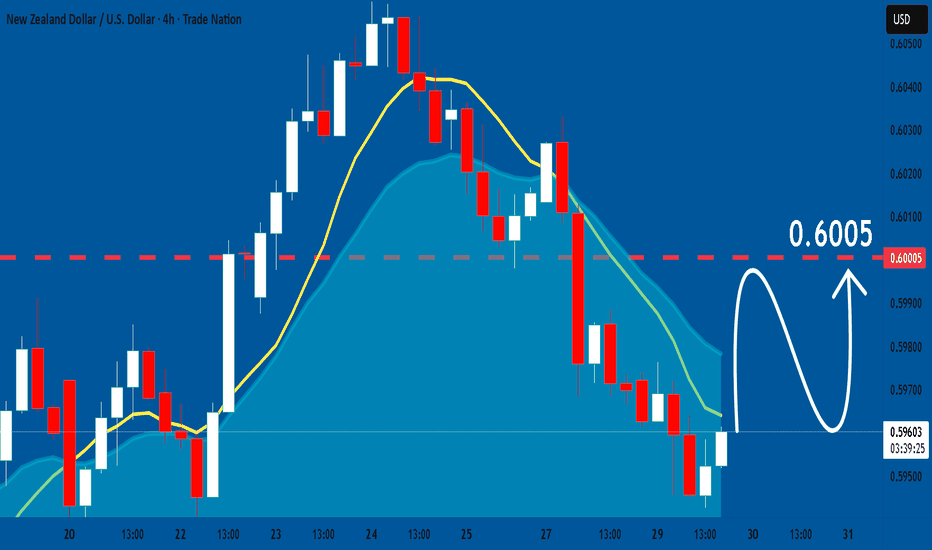
NZDUSD What Next? BUY!
My dear friends,
My technical analysis for NZDUSD is below:
The market is trading on 0.5974 pivot level.
Bias - Bullish
Technical Indicators: Both Super Trend & Pivot HL indicate a highly probable Bullish continuation.
Target - 0.6009
About Used Indicators:
A pivot point is a technical analysis indicator, or calculations, used to determine the overall trend of the market over different time frames.
Disclosure: I am part of Trade Nation's Influencer program and receive a monthly fee for using their TradingView charts in my analysis.
———————————
WISH YOU ALL LUCK
NZD/USD Breaks TrendlineNZD/USD has broken below the ascending trendline and is now retesting the 0.60113 – 0.60292 zone, which may act as new resistance.
If the pair fails to reclaim this zone, we could see a continuation lower toward the key supports at 0.59828 and 0.59547.
A confirmed break back above 0.6030 would invalidate the bearish outlook.
🔻 Structure: Break + retest of trendline
🔻 Resistance: 0.60113 – 0.60292
🔻 Support 1: 0.59828
🔻 Support 2: 0.59547
🔻 Timeframe: 1H
🔻 Bias: Bearish unless reclaimed above 0.6030
Technical idea only – not financial advice.
NZDUSD BUY OPPORTUNITY The Retest to the neckline of 0.58677 is completed! Therefore, I anticipate more bullish price action to continue. This further increases the bullish probability as we’ve transitioned from downtrend to uptrend. A buy opportunity is envisaged upon seeing a correction in intraday timeframe (H4)
Kiwi H1 | Potential bounce off an overlap supportThe Kiwi (NZD/USD) is falling towards an overlap support and could potentially bounce off this level to climb higher.
Buy entry is at 0.6051 which is an overlap support.
Stop loss is at 0.6025 which is a level that lies underneath a pullback support and the 61.8% Fibonacci retracement.
Take profit is at 0.6077 which is a swing-high resistance.
High Risk Investment Warning
Trading Forex/CFDs on margin carries a high level of risk and may not be suitable for all investors. Leverage can work against you.
Stratos Markets Limited (tradu.com ):
CFDs are complex instruments and come with a high risk of losing money rapidly due to leverage. 63% of retail investor accounts lose money when trading CFDs with this provider. You should consider whether you understand how CFDs work and whether you can afford to take the high risk of losing your money.
Stratos Europe Ltd (tradu.com ):
CFDs are complex instruments and come with a high risk of losing money rapidly due to leverage. 63% of retail investor accounts lose money when trading CFDs with this provider. You should consider whether you understand how CFDs work and whether you can afford to take the high risk of losing your money.
Stratos Global LLC (tradu.com ):
Losses can exceed deposits.
Please be advised that the information presented on TradingView is provided to Tradu (‘Company’, ‘we’) by a third-party provider (‘TFA Global Pte Ltd’). Please be reminded that you are solely responsible for the trading decisions on your account. There is a very high degree of risk involved in trading. Any information and/or content is intended entirely for research, educational and informational purposes only and does not constitute investment or consultation advice or investment strategy. The information is not tailored to the investment needs of any specific person and therefore does not involve a consideration of any of the investment objectives, financial situation or needs of any viewer that may receive it. Kindly also note that past performance is not a reliable indicator of future results. Actual results may differ materially from those anticipated in forward-looking or past performance statements. We assume no liability as to the accuracy or completeness of any of the information and/or content provided herein and the Company cannot be held responsible for any omission, mistake nor for any loss or damage including without limitation to any loss of profit which may arise from reliance on any information supplied by TFA Global Pte Ltd.
The speaker(s) is neither an employee, agent nor representative of Tradu and is therefore acting independently. The opinions given are their own, constitute general market commentary, and do not constitute the opinion or advice of Tradu or any form of personal or investment advice. Tradu neither endorses nor guarantees offerings of third-party speakers, nor is Tradu responsible for the content, veracity or opinions of third-party speakers, presenters or participants.
NZDUSD: Market of Sellers
The analysis of the NZDUSD chart clearly shows us that the pair is finally about to tank due to the rising pressure from the sellers.
Disclosure: I am part of Trade Nation's Influencer program and receive a monthly fee for using their TradingView charts in my analysis.
❤️ Please, support our work with like & comment! ❤️
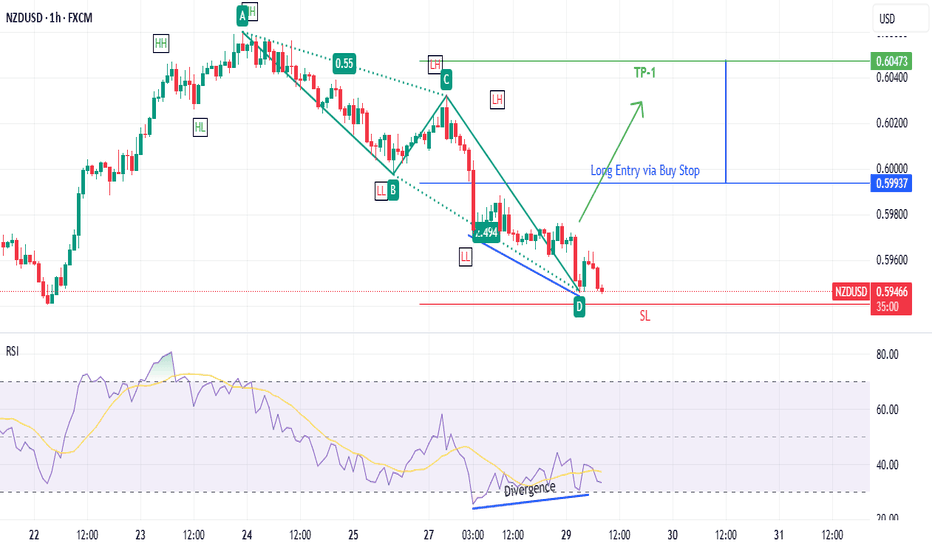
NZDUSD Bullish consolidation breakout supported at 0.6000Trend Overview:
The NZDUSD currency price remains in a bullish trend, characterised by higher highs and higher lows. The recent intraday price action is forming a continuation consolidation pattern, suggesting a potential pause before a renewed move higher.
Key Technical Levels:
Support: 0.6000 (primary pivot), followed by 0.5985 and 0.5950
Resistance: 0.6100 (initial), then 0.6140 and 0.6180
Technical Outlook:
A pullback to the 0.6000 level, which aligns with the previous consolidation zone, could act as a platform for renewed buying interest. A confirmed bounce from this support may trigger a continuation toward the next resistance levels at 0.6100, 0.6140, and ultimately 0.6180.
Conversely, a daily close below 0.6000 would suggest weakening bullish momentum. This scenario would shift the bias to bearish in the short term, potentially targeting 0.5985 and 0.5950 as downside levels.
Conclusion:
NZDUSD maintains a bullish structure while trading above the 0.6000 support. A bounce from this level would validate the consolidation as a continuation pattern, with upside potential toward the 0.6100 area. A breakdown below 0.6000, however, would invalidate this view and suggest deeper corrective risk.
This communication is for informational purposes only and should not be viewed as any form of recommendation as to a particular course of action or as investment advice. It is not intended as an offer or solicitation for the purchase or sale of any financial instrument or as an official confirmation of any transaction. Opinions, estimates and assumptions expressed herein are made as of the date of this communication and are subject to change without notice. This communication has been prepared based upon information, including market prices, data and other information, believed to be reliable; however, Trade Nation does not warrant its completeness or accuracy. All market prices and market data contained in or attached to this communication are indicative and subject to change without notice.
Long trade
1Hr TF
🟢 NZDUSD – Buyside Trade
Date: Monday, 16th June 2025
Session: London Session AM
Time: 5:00 AM
Entry Timeframe: 1Hr TF
Trade Parameters
Entry: 0.60429
Take Profit: 0.60684 (+0.42%)
Stop Loss: 0.60347 (−0.13%)
Risk-Reward Ratio (RR): 3.23
🧠 Trade Reasoning
The trade was initiated on a 1-hour bullish continuation setup, with price finding firm support around the 0.60350 level — a previously swept liquidity zone and minor structural demand.
NZDUSD - Medium term prediction - 16/06/25For NZD/USD at 0.6017 here, I’d put the odds roughly at:
Rally above 0.6379 first ~60%
Drop below 0.5656 first ~40%
Why the slight tilt to the upside?
Higher‐low pattern: Since last autumn’s peak near 0.638, the lows have stepped up (≈0.550 → 0.565 → 0.582 → now 0.601), showing buyers pulling in earlier on each pullback.
Mid‐range flip: The 0.5656 zone held as support through April/May, and price has cleared the halfway mark of this range with follow-through buying.
Momentum: Daily candles on the advances have been clean, and there’s no obvious bearish divergence warning yet—leaving room for another leg up to 0.638.
That said, 0.6379 is a strong multi-month ceiling, so there remains a meaningful ~40% chance of rolling over back toward 0.5656 before tagging the top.
POTENTIAL SHORT OPPORTUNITY NZDUSD...SWING TRADE OPPORTUNITYHey hey TradingView fam! Hope you are all doing amazingly well! I just wanted to make another post on here for another currency pair that I see potential opportunity on for the upcoming weeks/months here. So let's dive in!
OK so NZDUSD as you can see has been trending higher on the hourly and daily timeframes for some time now. After a long move to the downside price got exhausted and has shown us some relief over the last 6 months or so! BUT...when doing my analysis I had seen a couple things that grabbed my attention for a potential trade
NOW to be 100% honest with you guys and just so you are prepared I'm seeing this as a reaction trade not continuation trade. Basically what I mean without going into to many details is the fact that I see this REACTING from the weekly supply I have marked, making a higher low, then actually continuing to the upside RATHER than coming all the way down to take out the 0.55000 lows that it created. You may ask..."Well what makes you think that?" and the simple answer is that 0.5500 was multi-year lows...usually when price comes off of those lows and shows that buying interest (unless it is on of the rare times) it usually doesn't revisit or make new lows beyond that for some time. Economies have to rebalance, rework & renew. So for any currency to be in multi-year extremes is just not sustainable for their economy.
OK so with that explanation done let's look for shorts starting around 0.61700-0.62500 reason for that range is that it is a higher timeframe zone so price may need some time to develop and breathe before moving to downside. But as you can see it is a decent sized supply zone so let it do it's thing. But as you can see there is a fib alignment based on the downward leg from years before aligning so that is a good zone to see a "bounce".
For targets I myself personally am aiming for 0.56500 since that is the last "strong demand" zone that I can see from that buyer push. So that is the next threat so to speak if we are shorting
Alright guys that is all I have for this hope this provides some value to you guys and you can pull some nuggets or even a trade from it! Trade at your own risk understanding that this is just speculative.
Cheers! Please boost this post & follow my page for more accurate trade breakdowns!
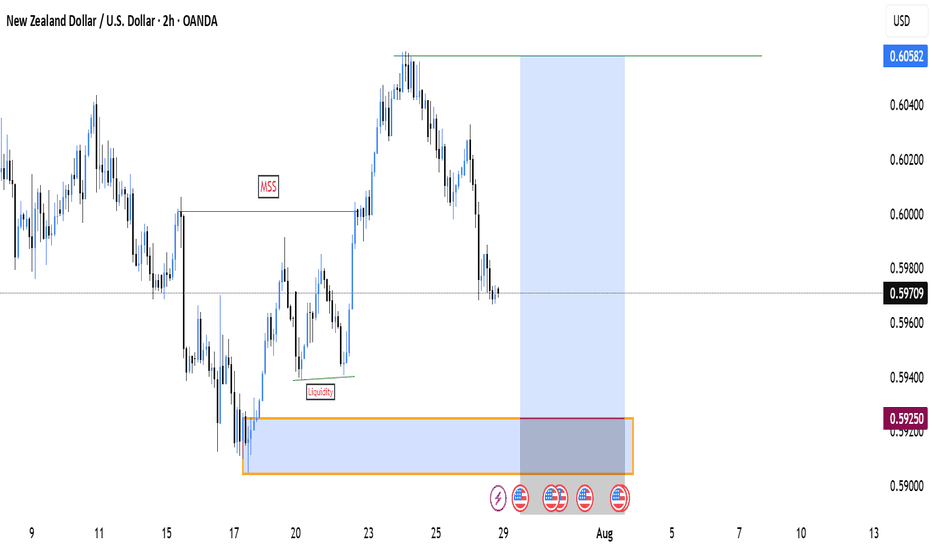
# NZDUSD H4 Demand with Proper Liquidity# NZDUSD H4 Demand with Proper Liquidity
* In LTF with valid mss confoormation then entry with proper SL and TARGET
* If Market will Enter in Demand without Reaction / Enter with 1st Candel with body close / Impulsive move then Don't enter , entry with LTF Valid Conformation with proper Valid Demand .
Be Patient's on Your Trade
~~* KGB Priyabrta Behera *~~
* ICT & Advance Mapping SMC Trader *
NZDUSD Is Very Bearish! Short!
Take a look at our analysis for NZDUSD.
Time Frame: 1D
Current Trend: Bearish
Sentiment: Overbought (based on 7-period RSI)
Forecast: Bearish
The market is on a crucial zone of supply 0.601.
The above-mentioned technicals clearly indicate the dominance of sellers on the market. I recommend shorting the instrument, aiming at 0.588 level.
P.S
We determine oversold/overbought condition with RSI indicator.
When it drops below 30 - the market is considered to be oversold.
When it bounces above 70 - the market is considered to be overbought.
Disclosure: I am part of Trade Nation's Influencer program and receive a monthly fee for using their TradingView charts in my analysis.
Like and subscribe and comment my ideas if you enjoy them!
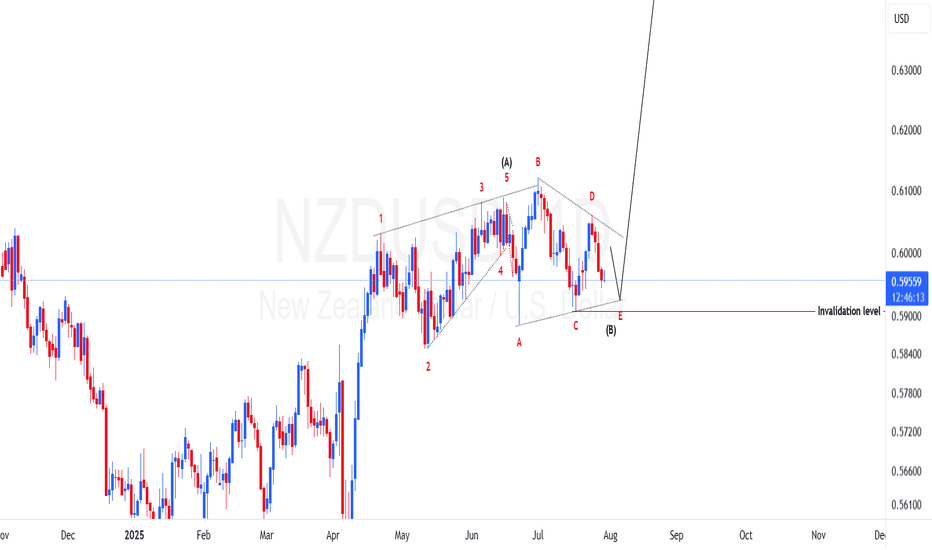
NZDUSD Elliott Wave A nalysisHello friends
In the NZDUSD chart, we are witnessing the formation of a complete Elliott wave pattern. These waves from 1 to 5 are quite clear and you can even count its sub-waves. Now wave 5 is completing and we are seeing multiple divergences in wave 5.
With the break of the trend line drawn at the bottom and a pullback to it, we can expect the price to fall to the specified support.
The first support is 0.58500 and then 0.56800.
Good luck and be profitable.
SELL NZDUSD for bullish trend reversal STOP LOSS: 0.6099SELL NZDUSD for bullish trend reversal
STOP LOSS: 0.6099
Regular Bearish Divergence
In case of Regular Bearish Divergence:
* The Indicator shows Lower Highs
* Actual Market Price shows Higher Highs
We can see a strong divergence on the MACD already and There is a strong trend reversal on the daily time frame chart.....
The daily time frame is showing strength of trend reversal from this level resistance so we
are looking for the trend reversal and correction push from here .....
TAKE PROFIT : take profit will be when the trend comes to an end, feel from to send me a direct DM if you have any question about take profit or anything
Remember to risk only what you are comfortable with….....trading with the trend, patient and good risk management is the key to success here