ABOUT NZDUSDMy option about nzdusd Is more bearish so that zone is good and strong restanice if the price comes to that zone it can pullback
NZDUSD trade ideas

Could the Kiwi reverse from here?The price is rising towards the pivot which has been identified as a pullback resistance and could drop to the pullback support.
Pivot: 0.5722
1st Support: 0.5677
1st Resistance: 0.5750
Risk Warning:
Trading Forex and CFDs carries a high level of risk to your capital and you should only trade with money you can afford to lose. Trading Forex and CFDs may not be suitable for all investors, so please ensure that you fully understand the risks involved and seek independent advice if necessary.
Disclaimer:
The above opinions given constitute general market commentary, and do not constitute the opinion or advice of IC Markets or any form of personal or investment advice.
Any opinions, news, research, analyses, prices, other information, or links to third-party sites contained on this website are provided on an "as-is" basis, are intended only to be informative, is not an advice nor a recommendation, nor research, or a record of our trading prices, or an offer of, or solicitation for a transaction in any financial instrument and thus should not be treated as such. The information provided does not involve any specific investment objectives, financial situation and needs of any specific person who may receive it. Please be aware, that past performance is not a reliable indicator of future performance and/or results. Past Performance or Forward-looking scenarios based upon the reasonable beliefs of the third-party provider are not a guarantee of future performance. Actual results may differ materially from those anticipated in forward-looking or past performance statements. IC Markets makes no representation or warranty and assumes no liability as to the accuracy or completeness of the information provided, nor any loss arising from any investment based on a recommendation, forecast or any information supplied by any third-party.

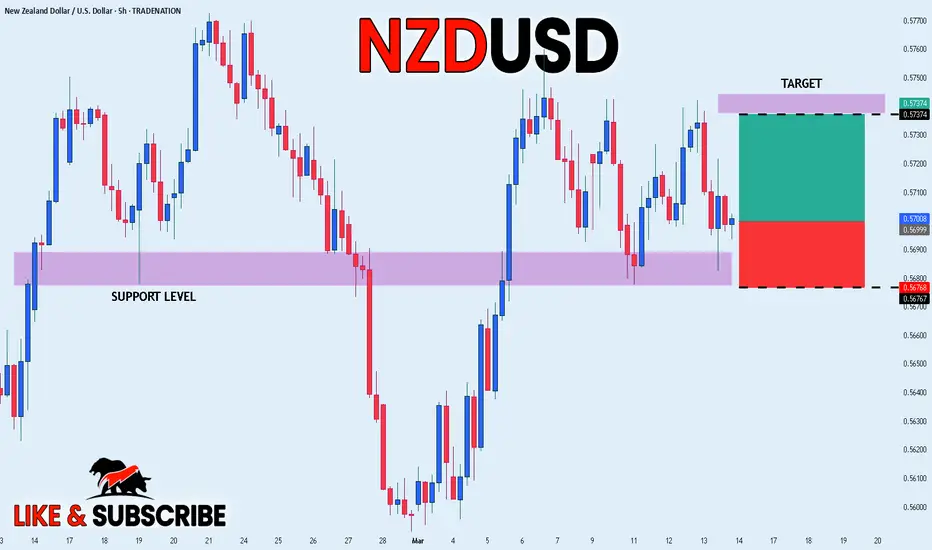
NZD_USD LONG SIGNAL|
✅NZD_USD made a retest
Of the horizontal support
Of 0.5680 from where we
Are already seeing a bullish
Rebound so we can enter a
Long trade from around 0.5700
With the target being 0.5737
And the SL of 0.5676
LONG🚀
✅Like and subscribe to never miss a new idea!✅
Falling WedgeThe price broke out of a falling wedge, and now we have a pullback, if the price makes a higher high its confirmation to go long
WE ONLY TRADE PULLBACKS


NZDUSD: Bullish Continuation
The charts are full of distraction, disturbance and are a graveyard of fear and greed which shall not cloud our judgement on the current state of affairs in the NZDUSD pair price action which suggests a high likelihood of a coming move up.
Disclosure: I am part of Trade Nation's Influencer program and receive a monthly fee for using their TradingView charts in my analysis.
❤️ Please, support our work with like & comment! ❤️

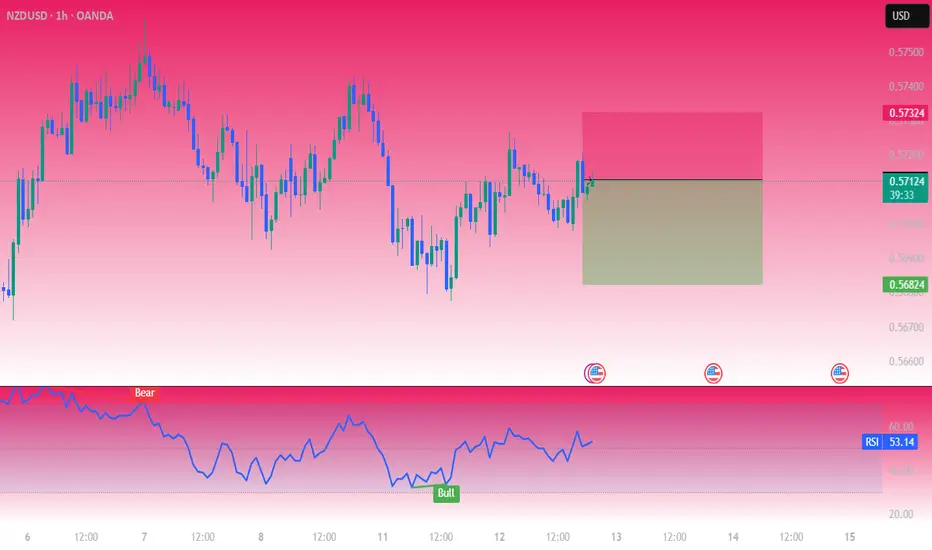
Lingrid | NZDUSD long Trade SETUP in CONSOLIDATION ZoneThe price perfectly fulfilled my previous idea. It hit the target zone. FX:NZDUSD market is currently consolidating after a period of bullish momentum. It has been making false breakouts at previous support and resistance zones, indicating that it is in a sideways trend. The market is approaching the previous day's low, and I believe it may create a false breakout in this zone before moving higher, especially given the prevailing bullish momentum. My goal is resistance zone around 0.57270
Traders, If you liked this educational post🎓, give it a boost 🚀 and drop a comment 📣

NZDUSD LONGMarket reacting from a strong demand level from the Daily TF. Expecting markets to keep rallying to the upside taking out levels like 0.57600 and later on 0.8850 . focusing on LTF is essential to catch these trades ... Drop a comment and tell me what you think

BUYGod First
Minimum Risk Maximum Reward
Action Backed Believe
# faith, strategy, and execution all in one #

NZDUSD short idea [1hr time frame]Okay, let's refine your NZDUSD short trading idea for clarity and detail.
Concise Description:
"NZDUSD immediate short trade: 20-pip risk, 30-pip reward. Based on 1-hour higher tail rejections, third touch of a descending trendline, and established downtrend momentum."
Detailed Description:
Trade Setup:
NZDUSD immediate short position.
Risk: 20 pips.
Reward: 30 pips.
Risk/Reward Ratio: 1.5:1.
Analysis:
1-Hour Higher Tail Rejections:
"On the 1-hour chart, multiple candles have exhibited prominent upper wicks (higher tails), indicating strong selling pressure and rejection of higher prices."
This shows that the price is having trouble sustaining upward movement.
Descending Trendline Third Touch:
"The price has made a third touch of a confirmed descending trendline, connecting a series of lower highs. This third touch reinforces the validity of the trendline and suggests a high probability of continued downward movement."
This is a classic technical analysis setup.
Established Downtrend Momentum:
"The overall price action indicates a clear downtrend, with a series of lower highs and lower lows. This confirms that bearish momentum is currently dominant."
This provides trend confirmation.
#NZDUSD 1DAYNZDUSD (1D Timeframe) Analysis
Market Structure:
The price is approaching a significant support level, which has previously acted as a key area for price reversals. This level is important for identifying potential buying opportunities.
Forecast:
It is recommended to wait for the price to reach the support level. If bullish confirmation is observed, such as bullish candlestick patterns or increased buying momentum, a buy position can be considered.
Key Levels to Watch:
- Entry Zone: Monitor the price behavior near the support level and consider buying if a clear bounce or bullish signal is confirmed.
- Risk Management:
- Stop Loss: Placed below the support zone to protect against a potential breakdown.
- Take Profit: Target the next resistance levels for potential gains.
Market Sentiment:
Confirmation of bullish sentiment will depend on how the price reacts at the support level. A strong bounce would indicate potential for upward movement, while a breakdown may signal further downside. Waiting for confirmation will provide better trade accuracy.

NZDUSD SHORTMarket structure bearish on HTFs 3
Entry at Daily AOi
Weekly rejection at AOi
Daily Rejection at AOi
Daily EMA retest
Previous Structure point Daily
Around Psychological Level 0.57000
H4 EMA retest
H4 Candlestick rejection
Rejection from Previous structure
Levels 6.11
Entry 105%
REMEMBER : Trading is a Game Of Probability
: Manage Your Risk
: Be Patient
: Every Moment Is Unique
: Rinse, Wash, Repeat!
: Christ is King.

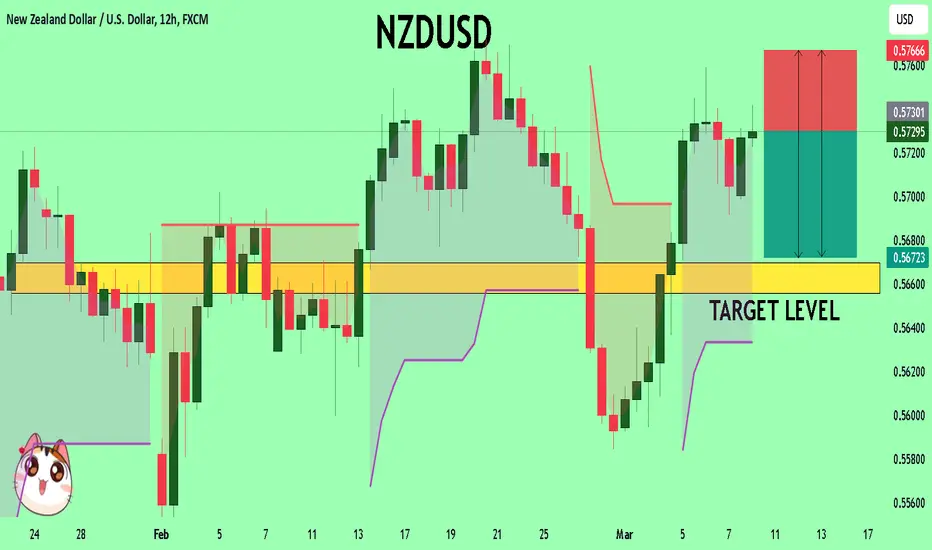
NZD Golden Wave: Strong Support Fuels the Uptrend📈 NZD Analysis
🔍 The primary support level is firmly set at 0.56880.
💡 Maintaining this support is expected to drive an upward wave towards 0.58580, reinforcing the positive trend.
🎯 Key levels will be monitored closely as the uptrend unfolds.


NZDUSD Trading Opportunity! SELL!
My dear friends,
Please, find my technical outlook for NZDUSD below:
The price is coiling around a solid key level - 0.5730
Bias - Bearish
Technical Indicators: Pivot Points Low anticipates a potential price reversal.
Super trend shows a clear sell, giving a perfect indicators' convergence.
Goal - 0.5669
Safe Stop Loss - 0.5766
About Used Indicators:
The pivot point itself is simply the average of the high, low and closing prices from the previous trading day.
———————————
WISH YOU ALL LUCK
NZDUSD Neutral H4 UpdateRemember, successful trading relies on proper risk management and a disciplined approach. Use stop-losses to safeguard your assets and carefully plan each trade. Analysis is the key to making informed decisions. Stay updated and continue refining your strategies!

NZDUSD is ready to push againNo comment needed. All information is in the chart analysis.
Steps to follow:
Analyze yourself.
Take the position with SL and Take Profits.
Wait, it may take a couple of days, so take a break and step away from the screen from time to time, just like I do :)
Get the result.
I will update the trade every day.
Like, comment with your good mood or viewpoint, share with your circle. It’s together that we get stronger!
Good trades, Traders!
The golden bear

REASONS WHY NZDUSD WILL PUSH DOWNGreeting everyone, it's been a while since I posted but let's get to it
These are my reason why NZDUSD will shoot down
1. As we can see our Uptrend Trendline was broken, this shows us a sign of bear/sellers coming into play to push the price down
2. Price failed to create a New Higher High showing that bulls/buyers are losing momentum to push the price higher, meaning sellers are gaining strength, furthermore we can see the formation of Double top
3. Our Major Low(NECKLINE) which was the final mark of Uptrend was broken meaning sellers
are more than buyers and the price will Push down
Best time to enter?
It would be to wait for a clear powerful breakout of sellers and a retest of the Major low, this will confirm that sellers are in total control indeed, then enter all the way to TP1/ Major Key Level
Best of luck traders

NZD/USD - 1H Chart Analysis📊 NZD/USD - 1H Chart Analysis
🔹 Current Price: 0.56923
🔹 Market Structure: Bearish trend with a potential bounce zone
📍 Key Demand Zone (Potential Buy Zone):
0.56776 - 0.56800 → Marked in green (potential reversal area)
📍 Resistance Zones (Target Areas for Buys):
0.57200 - 0.57400 → First resistance area
0.57550 - 0.57700 → Major supply zone
📈 Bullish Scenario:
✅ If price holds above 0.56776, expect a bounce towards 0.57200 - 0.57400.
✅ A strong breakout above 0.57400 could push towards 0.57700.
📉 Bearish Scenario:
🔻 If price breaks below 0.56776, further downside towards 0.56500 is possible.
💡 Trading Plan:
🎯 Buy Setup: Look for bullish confirmations at 0.56776 - 0.56800.
🎯 Sell Setup: Watch for rejections at 0.57200 - 0.57400.
🎯 Risk Management: Use a stop-loss below demand zones or above resistance.
#NZDUSD #ForexTrading #SmartMoney #TechnicalAnalysis 🚀

#NZDUSD POSSIBLE BREAKOUT TO THE DOWNSIDE Due to the dollar gaining some strength NZD looks to be loosing uptrend momentum.
Once the hourly candle closes on below the trendline, I will be entering a short trade here down to our next target zone at $0.56400.

NZDUSD capped by resistance at 0.5770The NZD/USD currency pair remains in a bearish trend, supported by the longer-term prevailing downtrend. However, recent intraday price action suggests sideways consolidation, indicating a potential buildup before the next significant move.
Bearish Scenario:
The key level to watch is 0.5770, aligning with the previous consolidation zone.
A potential oversold rally toward 0.5770, followed by a bearish rejection, could reaffirm the downtrend.
If sellers regain control, downside targets include 0.5687, followed by 0.5665, with 0.5637 acting as a key longer-term support.
Bullish Scenario:
A confirmed breakout above 0.5770 on a daily close would challenge the bearish outlook.
This could trigger further upside momentum, leading to a test of 0.5793, followed by 0.5854 if bullish pressure strengthens. A sustained move above 0.5770 could indicate a broader trend shift.
Conclusion:
The overall sentiment remains bearish, but short-term consolidation suggests a possible test of 0.5770 before the next directional move. A bearish rejection at this level would reinforce the downtrend, while a breakout above 0.5793 would open the door for further upside. Traders should monitor price action closely at this key resistance zone for confirmation.
This communication is for informational purposes only and should not be viewed as any form of recommendation as to a particular course of action or as investment advice. It is not intended as an offer or solicitation for the purchase or sale of any financial instrument or as an official confirmation of any transaction. Opinions, estimates and assumptions expressed herein are made as of the date of this communication and are subject to change without notice. This communication has been prepared based upon information, including market prices, data and other information, believed to be reliable; however, Trade Nation does not warrant its completeness or accuracy. All market prices and market data contained in or attached to this communication are indicative and subject to change without notice.

NZDUSD Potential UpsidesHey Traders, in today's trading session we are monitoring NZDUSD for a buying opportunity around 0.57100 zone, NZDUSD is trading in an uptrend and currently is in a correction phase in which it is approaching the trend at 0.57100 support and resistance area.
Trade safe, Joe.

