FBU Fletcher Building NZLooking at Macro timeframe and there are some interesting levels coming up
Large scale harmonic bat pattern and demand level,
Coupled with lower timeframe fibonacci cluster levels just above and around the higher timeframe demand level
Fundamentally this stock is ~50% undervalued, losing money but has forward dividend of >11% as @$2.59 and it looks like it wants to drop further which will increase this again...
Might watch this around $2.35 - $2.08, for signs of life and hold this as a long term position
Buy low + sell high and hopefully get good dividends while doing it, theres likely 200-400% upside if you're willing to hold for years, or if not then if it gets to double, sell half and reinvest in something else and forget about them until they hit $8-$10
Know the company well, as used their building products... so have confidence they will turn around if they divest their residential builds funded with debt and lighten the balance sheet converting these builds into cash
This large scale pattern looks like a complex correction so the chances of staying in the $1.50 to $9-$11 range for a while is pretty high
FBU trade ideas

FBU Weekly Closer view of ButterflyAppears to have expanding triangle in the CD leg of a larger butterfly pattern
Hoping it drops to around $1.80 and will buy around there with any buying pressure showing

FBU Monthly Fletcher Building On trading halt while they do a $700mil capital raise
Hoping it drops to ~$1.80 ish for a long term buy due to technicals but fundamentally needs a restructure of debt or more equity...
Carrying too much debt from memory due to their residential developments with long cash cycle payments which is problematic when the market stalls and buyers dry up
Basically too much inventory...
Hopefully they can convert some of these back into liquid cash.... and move on and perhaps focus a little more on the commercial projects and building materials that have better cash cycles

FBU Fletcher Building Monthly Near buying levels...FBU Fletcher building near buying levels
Currently getting near demand level, currently has forward dividend of 11% but earnings have shrunk dramatically to loss making and likely going to restructure business or resize operations
No action as yet as there is no clear signal right now to buy, but it is definitely on my watchlist and hoping it drops in the next 2-3 months so I can buy lower at multiple support levels and lift my dividend % when it turns around again
The gap between the preferred $2.70 and $1.80 is quite wide so I might dip into a position at $2.70 and then load up the rest at $1.80 if it gets there
Fletchers is a pretty iconic NZ business but does have a pretty high debt level of 106% debt to equity so there needs to be a shift to reduce this if this involves developments that are funded by debt they need to be converted back into equity...
Likely needs some management and operational changes as current formula of negative profit and high debt to equity is not working... nor sustainable...

FBU - Relative Return for the first 7 trading days of SeptemberIn relative terms, the first 7 trading days of September have been reasonably positive for Fletcher Building Limited (ASX:FBU).
Since 2000, the first 7 trading days of September provided an average relative return vs All Ordinaries Index (ASX:XAO) of 3.14%, with a relative win rate of 17 from 21, & a standard deviation of 4.32%.

FBU Long after breaking out with high volumeEntry: 6.77
Stop loss: 6.53
Went long in the counter after it broke out with high volume.
Would have preferred a better close though.

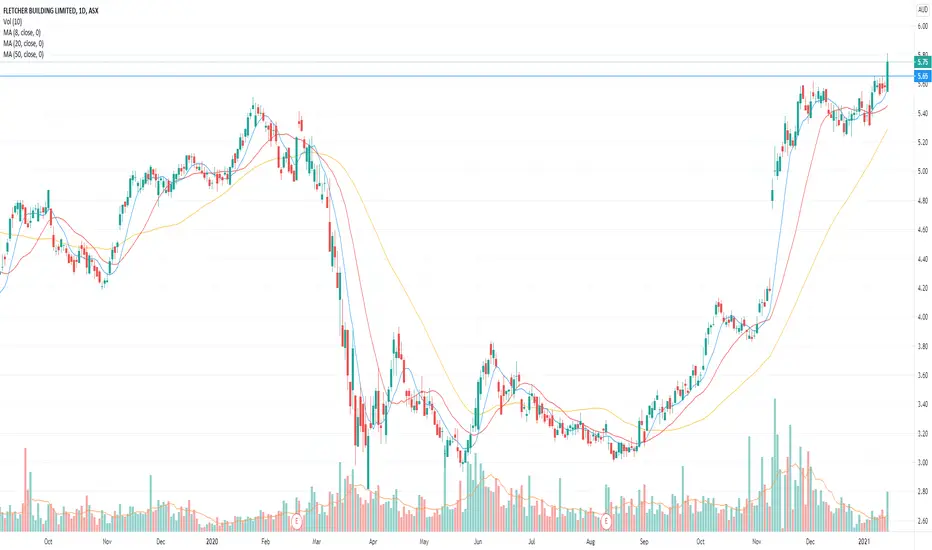
FBU long after breakout with high volumeEntry: 5.76
Stop loss: 5.55
Broke out of its recent high with very high volume today.
A cup and handle breakout supported by the orderly SMAs.
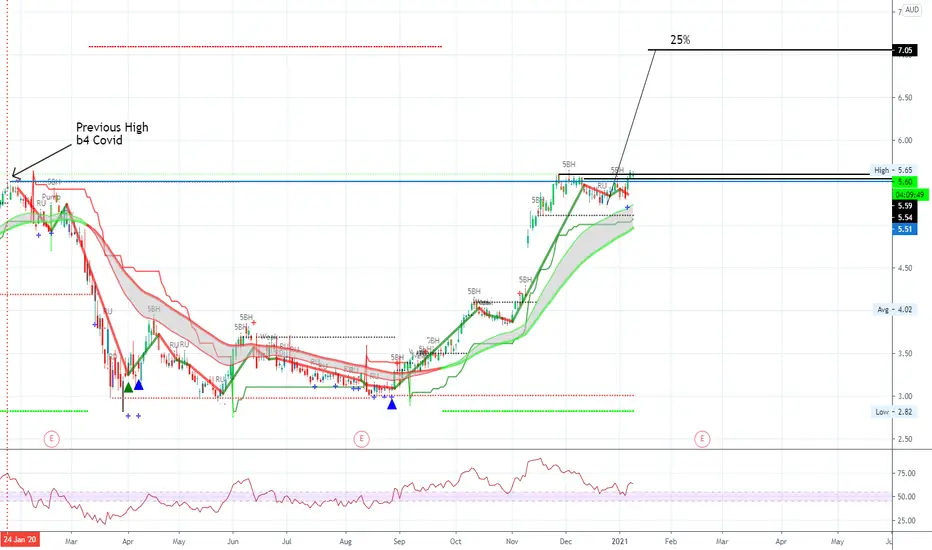
FBU.ASX_LongENTRY: 5.76
TP1: 6.06
TP2: 6.60
SL: 5.52
- ADX>25
- RSI>60
- FFI and RS +ve
- MA are aligned
- Breakout on 15 Jan 2021 with good volume
- Retraced today on lower volume

Fletcher BuildingWatch List Excercise - Looks like it could be on the move again, Set an alert a few cents above the current high and for the candle to close above the current high, prior to Covid crash.
Fundamentals are rubbish, net profit margin -2.52%, but has made money can make money, Future must be looking bright Trailing Twelve months income is looking better.
See below for various details.
Quick Summary Board
Market Screener: Buy
Investing.com: Buy
EMA - Trade: Buy
Mv Ave -Trade: Buy
Macd - Trade: Sell
Volume > Yest: Sell
Rsi > 55 < 88: Buy
Intrinsic Val Ann: Buy
Intrinsic Val TTM: Buy
Criteria %: 19%
Total Score: 7 out of 9 Buy
Vix: -3.62% Bullish
Rsi - (Caution 80%): 64%
On $1000 invested Roi
Mv Ave: Buy Dec 30, 2020 $29.55
Macd: Sell Dec 01, 2020 $297.17
Graham Intrinsic value Annual: $21.01
Graham Intrinsic value TTM: No Data
Discounted Valie Calc 15%: No Data
Next Eent: Interim 2021 Earnings Release
Date: 17/2/2021
Days Away: 37
Dividend Info
Dividend Payment Per Share: 15.000c
Date Payable: Thursday, 19 September 2019
Days Away: -480
Exdividend Date: Wednesday, 28 August 2019
Dividend Re Investment: Yes
Dividend Yield Prev Yrly % Return: 0.0655
Forward Annual Dividend Yield 4: No Data Sorry
Fundamentals
Return on Assets (ttm): 1.16%
Return on Equity (ttm): -4.77%
Quarterly Revenue Growth (yoy): -18.80%
Revenue Growth Rate (5Y): -3.34%
M - Net Operating Cash Flow $410,000,000.00
M - Net Investing Cash Flow -$234,000,000.00
M - Net Financing Cash Flow -$443,000,000.00
B - Long-Term Debt $2,408,000,000.00
M - Net Income- FY -$196,000,000.00
Operating Margin (ttm) -1.59%
Net Profit Margin (ttm) -2.52%
Beta Volatility 1 > < 3 ok 1.75
P/E Normalized (Annual) 31.98
PE Ratio (TTM) --
Book Value (Per Share Annual) 2.88
EPS Growth Rate (5Y) No Data Sorry
EPS Normalized (Annual) 0.19
EPS Ratio (TTM) -0.24
3 out of 16 data points pass 3-16
Criteria %: 19%
Income last 5 years
(ttm) $156,758,000.00
2020 -$196,000,000.00
2019 $164,000,000.00
2018 -$190,000,000.00
2017 $94,000,000.00
2016 $462,000,000.00
Wednesday, 25 November 2020
Included in the Chief Executive Officer's address is guidance for 1H21 EBIT before significant items, which is expected to be in the range of $305 million to $320 million. In 1H20, EBIT before significant items was $219 million
Description
Fletcher Building Limited, together with its subsidiaries, manufactures and distributes building products in New Zealand, Australia, North America, Asia, Europe, and internationally. It operates through Building Products, Distribution, Steel, Concrete, Residential and Development, Construction, and Australia segments. The Building Products segment manufactures, markets, distributes, and sells building products used to build homes, buildings, and infrastructure, including insulations, plasterboards, laminate surfaces, and plastic and concrete piping for the commercial and residential markets. The Distribution segment distributes building, plumbing, and pipeline products under the PlaceMakers, Mico, Forman Building Systems, and Snappy brands. The Steel segment manufactures and distributes steel products. The Concrete segment engages in the extraction of aggregates, and production of cement and concrete. The Residential and Development segment builds residential homes; and develops and sells primarily commercial sites. The Construction segment builds and maintains public and commercial buildings, transport and utilities infrastructure, and buildings and infrastructure, as well as designs, constructs, and maintains roads and civil infrastructure. The Australia segment manufactures and distributes building materials, such as insulation, plasterboard, laminate surfaces, steel roofing, and plastic and concrete piping for a range of industries across Australia. It also operates approximately 225 retail sites. The company was founded in 1909 and is headquartered in Auckland, New Zealand.
Hope this was helpful and helps make you money : )
Fletcher Building Shorter term view of Fletchers
Potentially 21% return on ya Bucks by February
Looking very Bullish
Fundamentals are Rubbish but who cares this is the Share market things don't have to make sense, just get on the Trend.
Just look at Meridian Energy MEL has shot up 128% since July 9th 6 mths even after losing the biggest customer in New Zealand, the Tewai Shelter closure Rio Tinto.
It's Just a Crazy world with one heck of a lot of money too invest at the top, their trouble is were do we put it.
Hope this was really really informative, have to write a certain amount to keep Tradeview Happy, one of many many house rules, have a nice investment day : )

Fletcher Building Don't make any money
But the Building Sector in NZ is Good so hopes are they will one day I guess.
Patterns tend to play out the big boys will see it has been to certain levels before so should do it again.
Hope this was really really informative have to write a certain amount to keep Tradeview Happy, one of many many house rules.

Watching for break and continuation Watching FBU move within ascending triangle on 1 hour. Possible chance to break upwards and continue recent trend. But also wary of downward break due to RSI level on weekly being very extended.

Flectcher Building Seem to be on a Tare
This happens quite abit on the NZX just out of the blue when RSi reaches 80 Sell Take Profit.
Moving Ave will probably Buy tomorrow Macd Day After usually as they are lagging Indicators but about the best we got i'm afraid, but still work more often than not.
Lost 196 mil last yr
Revenue has been dropping for the last 5 years
-3.34 estimated revenue growth next 5 yrs so rubbish and shouldn't be going up in price the share market makes no sense.
But it's all about the future potential ya know.
What future that they will be around losing money for ever how can a company loos $196 million Dollars in a
Year OMG! that is a Useless Business
run by Useless Management.
Buy Buy Buy


ATM Stock Research - Re Initiates BUY on FBU ATM Stock Research
FBU Tech analysis Summary –
Around 23rd of May as the emotional selloff was at its peak FBU stocks were sold off heavily and touched the lows of $3.05. The aftermath recovery was short-lived, the stock retraced back from the highs of $4.24 to now @ $3.17. As the gradual ramp up in construction activity unfolds during level 2 and will speed up eventually in Level 1, we see a high-risk investment opportunity for our clients. ATM Stock Research re initiates high risk BUY on FBU @ $3.17 for all its readers. The Chart shows that the stock is oversold at the current levels and another recovery is due and as the stocks will move up towards its first resistance @ $3.40. Once this resistance is broken the Medium-Term resistance we see is @ $3.70. As most of the negativity is already priced in the Stock, we recommend a high risk BUY.
atmstrategy.co.nz

10 year bear flag breaks downHuge momentum to the downside now on news of lower profit forecast.
How low will this eventually go? Bear flag says 0. The double bottom of 1.65 seems likely.
This company owns so much of NZ construction... What on earth happened during the last 9 golden years in NZ?

FBU shortASX:FBU
Rally up into the underside of key MAs, can run a tight stop on this
May want the 200d which would provide another opportunity if it rallies through stop
Short 6.00
Stop 6.10


