AU200AUD trade ideas

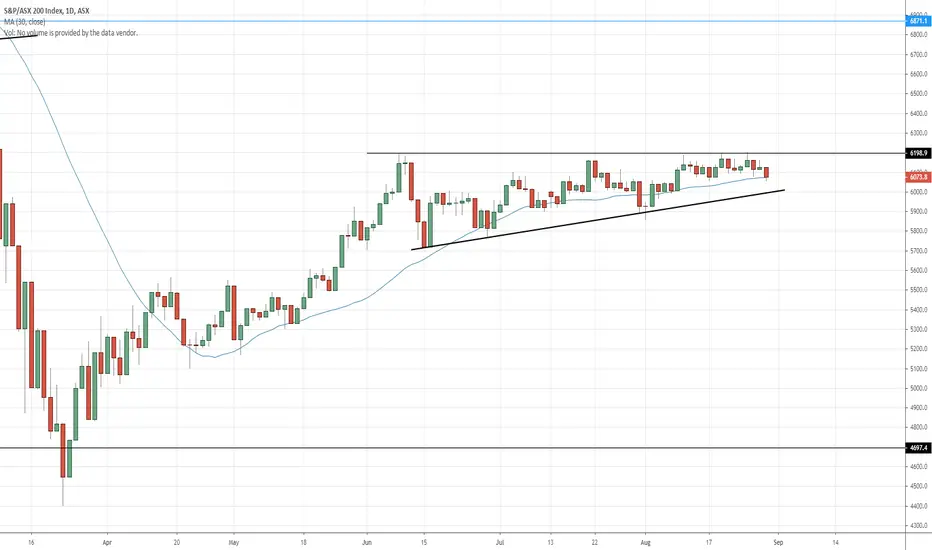
XJO breaking out at 6200XJO breaking out at 6200
Showing some weakness heading into next week,
With 5 internal swings in this ascending triangle, looking to break out at 6200
ASX - retest ending. Pain ahead?Australia is unlucky because it does not have a lot of tech and finance stocks to carry it forward. 25% of the market is just 4 banks. As earnings and profits dwindle and the initial retail shock due to COVID dies down into reality, expecting this to plunge one more time. Good level to watch here.

AUS2200, Elliott Analysis. This index had an upward trend in the past always, and has not grown much after the recent fall (due to the Corona virus).
Low risk and I expect it to grow well.

XJO still fighting the 200MAThe Australia stock market is still fighting to rip up the 200MA which so far has been a challenge. I expect the market to zoom up very quickly when this 200MA is breached.
To me it is now or never for this market to prove its strength. we are in the apex of what looks to be end of an ascending triangle. Keep an eye on this chart as we see new ATH on the Wall Street.
This charts shows all the info I will be brief with my post today and as I said last time it is not a good time to buy until the market shows stamina to stay above 200MA. Have profitable trades and dont forget to gong the likes.

Aussie coiling for breakoutIn my opinion, at least. Could have one more wave down but it looks pinned to this high timeframe level that has been a key mirror level in the past. A break could send it soaring.

ASX 200 - Critical support and resistance on the H2 time frameASX 200 - Critical support and resistance on the H2 time frame
Support at 6126.55, 6077.60, and 6046.70
Resistance at 6156.80, 6205.75, 6236.00, and 6284.95

Breakout Coming Soon $XJO ASX200 We are trading inside a rising wedge.
A big breakout move is coming in the next few days/weeks.
Currently, as long as the SPX is still making new all time highs, I think we will have a small pullback towards the trendline/bottom of the wedge before breaking out to the upside.
However, it is possible that the SPX (US market) to go down after the APPLE stock split and Dow Jones Industrial rebalance.
If the US markets goes down, XJO would most likely follow.
Dow Jones Addition/Removal
#Salesforce will replace #ExxonMobil, and #Amgen will replace #Pfizer, and #Honeywell International will replace #Raytheon Technologies in the Dow Jones Industrial Average effective prior to the opening of trading on Aug. 31.

ASX 200 ASX 200 coming into Supply zone in time for the covid 19 stimulus package cut, looking for shorts at 6328 invalidation will be 6500 and extension of covid stimulus

Is the Stock Market going to CRASH?!?!Is the stock market going to crash?!?!
I reckon about 50 people a week ask me this question!
The reality is that we have never experienced this kind of crash before, we have never fought COVID before and we are seeing a huge amount of stimulus from our governments.
Even the most experienced traders and investors are struggling to predict the market.
Here is what I know:
• It's a crazy time, with things changing daily
• The market has recovered well since the crash, but it's not yet "technically safe"
• We are going through a digital evolution, meaning that things are different. Business is different. Life is different.
• Companies are announcing loss in sales and increase in profits at the same time. Profit is what matters.
• We are never going to see "work" in the same way again.
• There is a huge amount of misinformation in the media
• There is an even bigger amount of misinformation coming from the public (the new media - how ironic)
• The stock market responds to supply and demand. You might think a stock is overpriced (and it may be), but if another person is willing to pay that price, is it 'overpriced', or just... 'priced'?
• A company is not it's stock price. Read this 3 times.
• An index is not a company. Read this 3 times.
The world is changing and evolving.
Here is my suggestion to investors and traders:
Don't try to predict. Instead get really good at adapting and even better at reacting. Use technology to your benefit. Computers are better than us at processing things, we are better at strategy. Manage your risk every second of every day. Never stop doing what you love in he trading and investing world, instead, proceed with caution and have an exit strategy.
Technicals:
The below chart is how I personally see the ASX right now. We are looking very bullish technically, with a huge ascending triangle on top of a trip wire on the daily. We also have an ascending triangle on the 4hr.
We are pressing against resistance right now. A push through could see us making new recent highs and moving up a couple of hundred points. If we do, be careful as we are going to hit a major supply zone, which could trigger a reversal. A push through this second level of resistance could see the market heading in a longer term positive direction. Marked on chart.
Another thing to note, we are right on the 61.8 Fibs, a prime position for a reversal to occur.
Does this mean the market is going up? No it doesn't, but it looks like it wants to.
The market is a flaky, fickle, 2-faced, sadistic creature. Remember what you are dealing with.
Be careful, its not your friend and it doesn't care about you.
Does this make you feel bad? Why? Now you know what you are dealing with, you can milk it for everything it's worth.
Your role as a trader is to take money from the market and put it in your pocket. Don't kid yourself, this was never a friendship.
How I read it:
It could easily go either way right now. Risk management is key. Invest in sectors that stand to benefit whether the crash happens or not.
Read the following aloud to yourself:
• Risk management is my number 1 priority
• I'm going to do my own research and make my own choices
• My friends and family aren't qualified to give me financial advice
If you prioritise risk, you minimise loss. Its really that simple.
Here's the thing, we just don't know what will happen. No one does. All the time you spend searching for someone to give you that answer could have been spent finding your next major trade. Spend it wisely.
A couple of things to be aware of:
- Australia follows the US. Elections are coming soon in November.
- Jobkeeper is allowing companies to keep operating, it's potentially ending next March.
- All business is changing. What you know today may not apply tomorrow.
With that being said, I wish everyone an amazing week trading and investing!
• Learn
• Manage Risk
• Adapt
• Remove the ego
• DYOR
• Invest in what you know
• Go your own way
Have a great week 🚀

Completion of an Ascending Triangle _ LongHi there,
This wave analysis is based merely on the elliot wave. We have Identified that our wave 4 is in a form of ascending triangle and will soon complete the XY wave. Our extensions shows that we at full completion of XY wave, this why we advice you to look carefully at the price action in order to get a good trading opportunity.
Good-luck

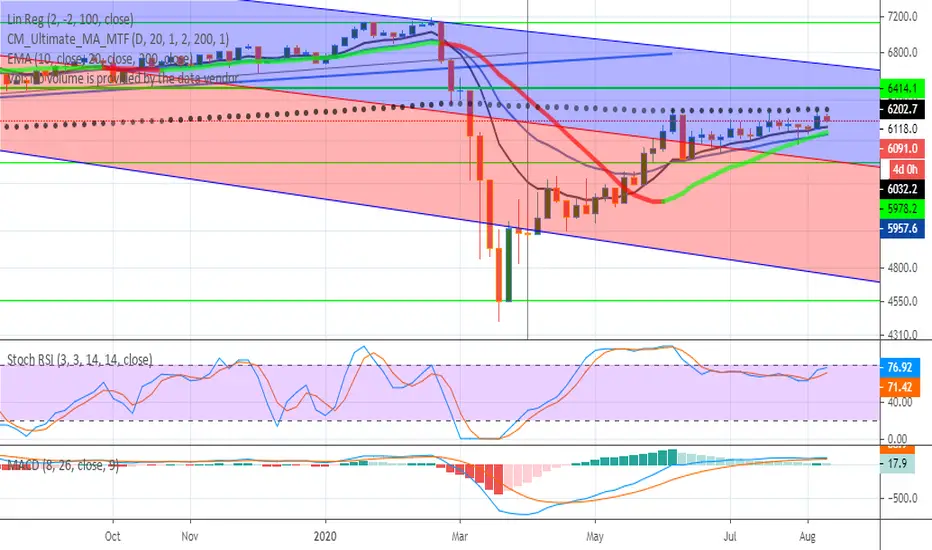
ASX CorrectionCurrently struggling at 6.1-6.2k level with MA and EMA convergence, pressure from macro trendline above, fibonacci golden pocket and the MACD is currently approaching to 0 level which is often where reversals occur. A weekly close below 6050 provides a strong short bias, breaking the 6.2k level with a weekly close invalidates this idea.


ASX200 up at highs as bulls keep the momentum goingIt seems that the ASX bulls are feeling left out as the US pushes to all time highs. Price is hovering just below the 6200 zone and continues to hold higher lows suggesting that a move up through the level is on the cards in the near term. If we see sellers start to get active up at current levels then watching for a lower high and move back down to clean out some weak buyers.
-------------------------------------------------------------
WE TRADE WHAT WE TEACH
Check out our recent Live Streams from our profile page!!
-------------------------------------------------------------
** If you enjoy our free content, please support and follow our profile, by hitting the Follow button to get further high quality ideas. **
** If you are following our ideas any comments and likes are most welcome and will be greatly appreciated **
** With quality alerts and correct Risk Management, you can learn consistency and grow your account **
** With quality portfolio management and defined risk levels to help your account grow and achieve steady profit targets while increasing your trading edge. **


Australia 200 bullishI assume a corrective pattern is complete (flat with an ending diagonal in the wave C).

Aussies not looking happyThe current picture on the 3D time frame shows the following:
1. Price has rebounded to a 61.8 fib and is struggling.
2. The market has disallowed 6200 on four occasions.
3. Price is flattening in a structure zone.
4. The rebellion to current level has taken 5 times what it took for price to crash.
5. This is still a bear market as price has not nearly challenged the 6620 level.
None of each of the above means anything on it's own. But taken together the probability is for the south around this time. How far south - nobody knows! The probability can change as new information emerges.
Disclaimers : This is not advice or encouragement to trade securities. No predictions and no guarantees supplied or implied. Heavy losses can be expected. Any previous advantageous performance shown in other scenarios, is not indicative of future performance. If you make decisions based on opinion expressed here or on my profile and you lose your money, or miss opportunity, kindly sue yourself.

ASX200 / Corrective structure and target on the next ResistanceMain items we can see on the chart:
a) The price is above the ascending channel
b) There we can see a small correction after the new higher highs
c) If the price breaks above the corrective Structure we will assume a continuation movement
d) The target will be the next Resistance zone

ASX about to dropisn't it funny when data comes out while technicals provide same story at the same time.
Job numbers came out today and the market didn't like it while hitting the 200 day moving average as resistance
This is the 3rd time since june the ASX has been weighing down by the 200 day MA.
The following time frames show similiar structure
2, 3 days
The 5 day (1week) shows we have popped over it, but will see tomorrow 1 and 2 hour showing still more downtrend.
wasting time the right waythe price action is taking the shape of a penguin on the 15-minute chart. not to confuse anyone but I think we all know how to trade this basic shape. :) Have a good dy=ay

XJO aka ASX200 attempting to break the 200MA XJO aka ASX200 is trying to reach one milestone that has been thing of the past since the last plunge in early March 2020. is it gonna succeed and fly higher to the moon or this is gonna be a rejection and send us back to the abyss. As TA lets dive deep into the charts and analyze.
From last few days XJO has come up with strength trying to defy the bears traps that wanted to push down down into the abyss. But at the moment the price is at a critical point: 200MA which has been historically the separation line between bull and bear market. Does XJO has strength to break that magic line and go up towards the 7k levels? I have been keeping an eye on this index to know the directions of the whole Australia stock market as we know it. Below are the highlight of the bulls strength vs Bears strength:
- 50MA acting as support: we saw last time price bounced on this magic line
- PSAR flipped to the upside which is inherently bullish
- Price above the Golden Fibonacci. Hopefully it will act as support
- Price above historic resistance/support at 5969
- Price attempting to break 200MA this is bullish if and only if the price rips up that 200MA.
- Bears have one point too, the uptrend line has been broken few days back and it may be hard to reclaim it probably we will have to draw a new uptrend line.
For those late to the party and who want to go long better wait for the price to close above the 200MA at least 1 day then try to get in with tight stop loss.
I will keep you informed as this market keeps swinging up and down.
Stay safe and dont forget to smash the liked. I am scanning the market for the next stock of the week as I have been giving you the best of the bests so far.
XTF.


XJO - Heavy Resistance Zone So the last 3 months we have stalled around and up to 6150 it's obviously an important area but it's actually a VERY important area, the reason why we've had such a hard time getting through is not only due to the .618 Fib level but also we have a convergence of the 200 day MA and the 200 week MA, hence why we have stalled from a technical viewpoint, the outcome of this move (breakout or failure) will determine which way our market goes longer term.
However I view it as bullish the fact that we have sort of hung around and consolidated below the zone, with no real major rejection, suggests that energy is being formed for a bigger breakout move to the upside which is common when a chart has consolidated below a key area. We'll have to wait and see
