Stoxx sideways consolidation Key Support and Resistance Levels
Resistance Level 1: 5464
Resistance Level 2: 5500
Resistance Level 3: 5580
Support Level 1: 5152
Support Level 2: 5097
Support Level 3: 5044
This communication is for informational purposes only and should not be viewed as any form of recommendation as to a particular course of action or as investment advice. It is not intended as an offer or solicitation for the purchase or sale of any financial instrument or as an official confirmation of any transaction. Opinions, estimates and assumptions expressed herein are made as of the date of this communication and are subject to change without notice. This communication has been prepared based upon information, including market prices, data and other information, believed to be reliable; however, Trade Nation does not warrant its completeness or accuracy. All market prices and market data contained in or attached to this communication are indicative and subject to change without notice.
EU50EUR trade ideas
Markets in Rotation: Cyclical Stocks Take the Lead in 2025Markets in Rotation: Cyclical Stocks Take the Lead in 2025
Ion Jauregui – Analyst at ActivTrades
In a 2025 marked by tariff uncertainty, persistent geopolitical tensions, and stock markets that started the year at record highs, it seemed reasonable to favor defensive stocks. However, market behavior has made it clear that the rotation toward cyclical sectors has taken firm hold, leaving behind traditionally more stable segments. Since the imposition of reciprocal tariffs between the United States and China on April 2nd—an event known as "Liberation Day"—the indices experienced a brief correction that temporarily favored defensive sectors. Nevertheless, the swift rebound, led by U.S. equities, has returned the spotlight to cyclical stocks, which are now trading at historical highs relative to defensives, according to Bloomberg and Bank of America data.
According to MSCI classification, cyclical sectors include consumer discretionary, technology, industrials, financials, real estate, communication services, and basic resources. In contrast, defensive sectors consist of consumer staples, healthcare, energy, and utilities.
Leaders of the Rotation: Financials and Technology
In this context, two sectors have led the rotation: financials and technology. The former benefits from a high interest rate environment that boosts profit margins. In Europe, this backdrop has also fueled a rally in the banking sector, with the Stoxx 600 Banks index up 39% year-to-date. Meanwhile, the technology sector remains dominated by the “Magnificent Seven,” with Nvidia (+33%), Meta (+33%), and Microsoft (+27%) delivering strong gains thanks to the momentum of artificial intelligence and demand for digital solutions.
Lagging Sectors: Energy and Healthcare
On the other hand, the energy and healthcare sectors have weighed on defensive performance. Energy is suffering from bearish pressure on oil prices, driven by an oversupply led by OPEC. Healthcare has been hurt by former President Trump's proposals to lower drug prices in the U.S., directly impacting the margins of major pharmaceutical companies.
Rotation Reaches Europe: EuroStoxx 50 and DAX 40 on the Rise
Europe hasn’t been immune to this rotation. Both the EuroStoxx 50 and the DAX 40 have reflected this shift, especially benefiting banks, tech, and industrials, while leaving traditional defensive sectors lagging.
EuroStoxx 50: Boosted by Banking and Industry
The EuroStoxx 50, the eurozone’s benchmark index, is up 11.2% so far in 2025, thanks to strong performance in banking and industrials. Institutions like BNP Paribas, Santander, and ING have gained more than 30%, supported by high rates and share buyback programs. Industrial giants like Airbus and Siemens have also stood out, driven by increased investment in infrastructure and defense.
In contrast, defensive sectors like utilities and consumer staples have posted flat or negative returns, penalized by declining consumption in southern Europe and margin compression in energy.
DAX 40: Germany Aligns with the Cycle
Germany’s benchmark DAX 40 index has risen 13.8% year-to-date, strengthened by domestic recovery and exposure to cyclical sectors.
• SAP (+22%) and Infineon (+31%) lead the tech segment, benefiting from industrial digitalization and AI adoption.
• The automotive sector has also rebounded, with BMW and Mercedes-Benz gaining ground due to stabilization in the Asian market and the shift toward electric vehicles.
Conversely, healthcare companies such as Bayer and Fresenius have issued guidance cuts, reflecting global weakness in the sector amid regulatory pressure and legal challenges.
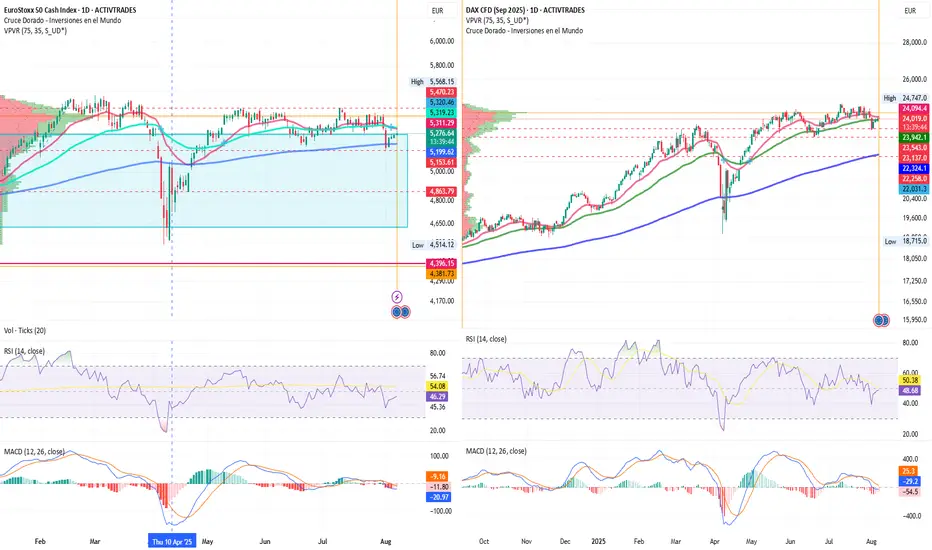
Technical Analysis – EuroStoxx 50
Current price (August 7, 2025): 5,288 points
YTD Change: +15%
Trend
• The index maintains a medium-term bullish structure, respecting an ascending trendline from the October 2023 lows.
• After the April correction driven by tariffs, the EuroStoxx 50 has regained ground and is now trading near its yearly high.
Key Levels
• Main Resistance: 5,470.23 → A breakout with volume could project a move toward the year’s high at 5,568.15
• Immediate Support: 5,153.61 → 100-day MA crossing above the 50-day may signal a corrective phase toward support
• Major Support: 4,863.79 and April lows at 4,514.12 → Technical and psychological level aligned with the April correction
Likely Scenario
• As long as the index holds above 4,570, the bias remains bullish
• A break below 4,400 would activate a correction toward 4,200–4,100
Technical Indicators
• RSI: 47% → recovering from oversold territory
• MACD: Negative and crossed downward since June, confirming a favorable correction
• Volume: Slight increase supporting the bullish trend
• POC (Point of Control): Located near the upper zone at 5,408, indicating a recovery direction
Technical Analysis – DAX 40
Current price (August 7, 2025): 24,098 points
YTD Change: +26%
Trend
• The DAX 40 also maintains a clear uptrend, with a structure of higher lows since the start of the year
• It is currently in a sideways-upward consolidation phase between 23,137 and the highs at 24,747
Key Levels
• Main Resistance: At highs → key level that has capped gains since the end of Q2
• Immediate Support: 23,359 → congestion area supporting the current rally
• Major Support: 23,137 → base of the congestion area
Likely Scenario
• The current consolidation suggests a healthy pause before a breakout, provided the 17,950 support holds
• A daily close below 23,000 would trigger a technical correction toward yearly lows
Technical Indicators
• RSI: 50 → in positive neutral territory
• MACD: Slightly flat entering positive territory; may signal renewed momentum
• Volume: MACD trend is bearish, approaching neutrality—typical of a congestion zone
• POC: Slightly below current highs, suggesting potential continuation of the uptrend
Technical Conclusion
Both the EuroStoxx 50 and DAX 40 maintain a clearly bullish bias, supported by the strength of cyclical sectors. However, they are near key resistance levels, so a technical pullback cannot be ruled out if global markets enter a profit-taking phase.
• Short-term traders should remain cautious unless breakouts are confirmed with volume
• Medium-term investors may view any pullbacks as buying opportunities, as long as key support levels hold
Is a Cycle Shift Coming?
Despite the strong performance of cyclicals so far this year, some analysts—including Morgan Stanley, Deutsche Bank, and Evercore—anticipate a 10% to 15% correction in the S&P 500 in the short term. Such a scenario could favor a return to defensive stocks, especially if volatility spikes or central banks adopt a more dovish tone.
Conclusion
2025 is undoubtedly the year of cyclical stocks. The recovery after the tariff shock has been swift, and sectors like banking, technology, and industry have taken the reins of growth. However, in rotating markets, trends can reverse as quickly as they emerge. The key will be anticipating the next turn.
*******************************************************************************************
The information provided does not constitute investment research. The material has not been prepared in accordance with the legal requirements designed to promote the independence of investment research and such should be considered a marketing communication.
All information has been prepared by ActivTrades ("AT"). The information does not contain a record of AT's prices, or an offer of or solicitation for a transaction in any financial instrument. No representation or warranty is given as to the accuracy or completeness of this information.
Any material provided does not have regard to the specific investment objective and financial situation of any person who may receive it. Past performance and forecasting are not a synonym of a reliable indicator of future performance. AT provides an execution-only service. Consequently, any person acting on the information provided does so at their own risk. Political risk is unpredictable. Central bank actions can vary. Platform tools do not guarantee success.
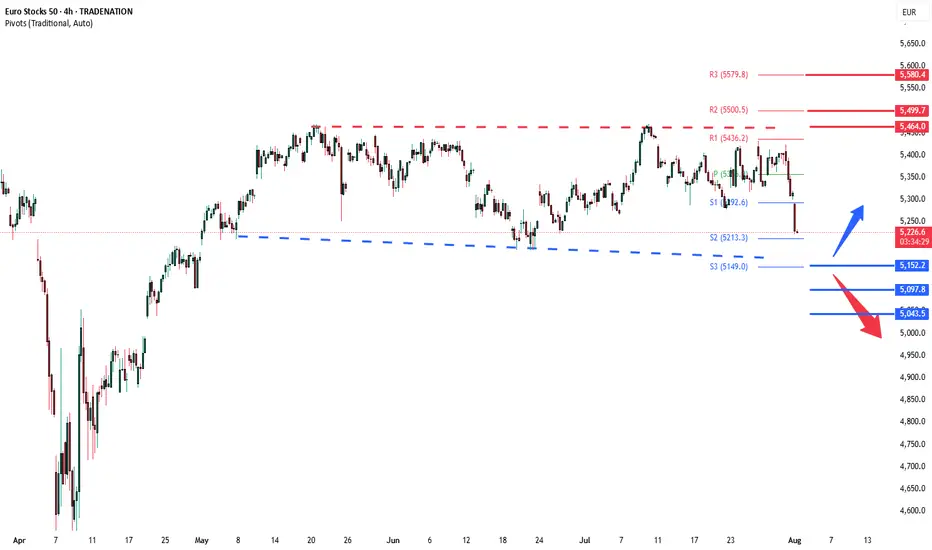
Stoxx50 sideways consolidation continuesKey Support and Resistance Levels
Resistance Level 1: 5464
Resistance Level 2: 5500
Resistance Level 3: 5580
Support Level 1: 5152
Support Level 2: 5097
Support Level 3: 5044
This communication is for informational purposes only and should not be viewed as any form of recommendation as to a particular course of action or as investment advice. It is not intended as an offer or solicitation for the purchase or sale of any financial instrument or as an official confirmation of any transaction. Opinions, estimates and assumptions expressed herein are made as of the date of this communication and are subject to change without notice. This communication has been prepared based upon information, including market prices, data and other information, believed to be reliable; however, Trade Nation does not warrant its completeness or accuracy. All market prices and market data contained in or attached to this communication are indicative and subject to change without notice.

Greed Alert: STOXX 50 Momentum Signals But Caution Needed🚨 STOXX50 RESISTANCE BREAKOUT PLAY! 💥 | THIEF TRADER STYLE 🔓📈
🧠 Thief Trader Master Plan: BULLISH ATTACK
🎯 Entry: Breakout above 5420 (Major RESISTANCE WALL 🧱)
🛑 Stop Loss: 5330 — Strict risk control, no funny business 😤
🚀 Target: 5560 — Smart money aims high 💰
👀 We spotted a strong momentum brewing — bulls are charging to break through the ceiling. Once 5420 cracks, it's game on.
🔥 Watch the levels, respect the trade, and let’s rob the market clean 💼💸
🧠 Market Sentiment Outlook
Retail Traders
🐂 Bullish: 55%
🐻 Bearish: 35%
😐 Neutral: 10%
Institutional Traders
🐂 Bullish: 60%
🐻 Bearish: 30%
😐 Neutral: 10%
😨😍 Fear & Greed Index
Score: 69/100 → Greed 🤠
Insight: Market tilts toward optimism — but tread carefully; overvaluation risks are real.
📈 Fundamental Strength Score
Score: 72/100
Drivers:
💰 Earnings Surge – AB InBev (+8.7%), Munich RE (+4.8%)
📉 Stable Eurozone Data
🚀 Momentum Building – STOXX 50 approaching all-time highs
🌍 Macro Economic Score
Score: 65/100
Factors:
⚖️ Tariff Delays – U.S. tariffs on Canada/Mexico pushed to April 2
📅 Eurozone PMI Preview
🌎 Tensions Rising – U.S.–Iran geopolitical friction
🔎 Key Highlights
🧠 Sentiment Check: Greedy mood – watch for pullbacks
💼 Earnings Season: Q2 winners driving index higher
⚠️ Volatility Triggers: Geopolitics + tariff policy
📉 Opportunity Alert: Fear score <20? Historically undervalued zone
📊 Technical Signal: STOXX 50 >125-day MA = uptrend confirmed
🧭 Always combine real-time data with sound technical and fundamental insights.
📌 Stay informed. Stay sharp. 🚀
💬 Drop your thoughts below.
❤️ SMASH that like button if this helped you.
👥 Support the Thief Trader team — we're in this to help you win.
📡 Stay sharp. Stay ruthless. Stay profitable.
— Thief Trader 🔐📊

EU50 Market ReboudFOREXCOM:EU50
Investors wary of the US Economic Condition from Bad Unemployment and the resulting chaos of firing Erika McEntarfer, commissioner of the Bureau of Labor Statistics (BLS ) for publishing unflattering numbers and tariffs that should be active on August 7th


STOXX50: Still at good place for buysHello,
The Eurostocks 50 is in a bullish correction forming an expanding triangle pattern. We still see an opportunity for investors who missed the entry at the bottom of the correction to join the risk averse trade once we have a strong breakout of the corrective pattern. The STOXX50 is coming close to the moving average being a further confirmation that we are setting up for an upwards move.
To reinforce our bullish bias, the MACD is showing signs of a zero bullish crossover. We remain aligned with our target of Eur 5980 on this.
Disclosure: I am part of Trade Nation's Influencer program and receive a monthly fee for using their TradingView charts in my analysis.

STOXX50: A great short term buyHello,
I see a short-term buying opportunity with a target of 6,000 for the Euro stocks 50. The EURO STOXX 50 is a stock index of Eurozone stocks designed by STOXX, an index provider owned by the Deutsche Börse Group. The index is composed of 50 stocks from 11 countries in the Eurozone.
EURO STOXX 50 represents Eurozone blue-chip companies considered as leaders in their respective sectors. It is made up of fifty of the largest and most liquid stocks. The index futures and options on the EURO STOXX 50, traded on Eurex, are among the most liquid products in Europe and the world.
With Europe gearing up for a rise as more money begins to flow into the European economies. The NATO has already had their meeting last week. After this development both the STOXX 50 and the STOXX 600 gained 0.3%, attempting to reverse losses from the previous sessions. NATO’s decision to raise defense spending targets from 2% to 5% of GDP by 2035 fueled a rally in European defense stocks, including Rheinmetall (1.4%) and BAE Systems (1.4%).
From a technical view the Euro stocks 50 is currently forming a correction and nearing a bullish crossover on the MACD indicator. We believe that the current price gives a great opportunity for short to medium buyers to take advantage.
Disclosure: I am part of Trade Nation's Influencer program and receive a monthly fee for using their TradingView charts in my analysis.
STOXX "Double Top" resistance retest at 5335The SOXX50 remains in a bullish trend, with recent price action showing signs of a corrective pullback within the broader uptrend.
Support Zone: 5200 – a key level from previous consolidation. Price is currently testing or approaching this level.
A bullish rebound from 5200 would confirm ongoing upside momentum, with potential targets at:
5335 – initial resistance
5400 – psychological and structural level
5470 – extended resistance on the longer-term chart
Bearish Scenario:
A confirmed break and daily close below 5200 would weaken the bullish outlook and suggest deeper downside risk toward:
5155– minor support
5090 – stronger support and potential demand zone
Outlook:
Bullish bias remains intact while the STOXX50 holds above 5200. A sustained break below this level could shift momentum to the downside in the short term.
This communication is for informational purposes only and should not be viewed as any form of recommendation as to a particular course of action or as investment advice. It is not intended as an offer or solicitation for the purchase or sale of any financial instrument or as an official confirmation of any transaction. Opinions, estimates and assumptions expressed herein are made as of the date of this communication and are subject to change without notice. This communication has been prepared based upon information, including market prices, data and other information, believed to be reliable; however, Trade Nation does not warrant its completeness or accuracy. All market prices and market data contained in or attached to this communication are indicative and subject to change without notice.

Stoxx50 Bearish reversal resistance at 5,325The Stoxx50 equity index is exhibiting bearish price action sentiment, consistent with the prevailing downtrend. Recent movements show signs of a corrective pullback, suggesting temporary relief within a broader downward structure.
Key Technical Levels:
Resistance:
5,325 – Critical resistance level; previously acted as an intraday consolidation zone.
5,384 – Intermediate resistance following a breakout.
5,500 – Key psychological and technical level; previous swing high.
Support:
5,150 – Initial downside target if the pullback fails.
5,090 – Secondary support, aligning with past reaction lows.
5,040 – Long-term support level, near a broader demand zone.
Scenario Analysis:
Bearish Continuation (Base Case):
A rally toward 5,325 that fails to produce a sustained breakout, followed by a bearish rejection, would confirm the corrective nature of the current bounce. This scenario reinforces the downside bias, targeting a decline toward 5,150, then 5,090, and potentially 5,040 over a longer timeframe.
Bullish Reversal (Alternative Scenario):
A confirmed breakout above 5,325, especially with a daily close above this level, would invalidate the immediate bearish outlook. This would shift sentiment to neutral-bullish, opening the door for a potential retest of 5,384 and an extended rally toward the 5,500 level.
Conclusion:
The technical structure of the Stoxx50 remains bearish in the short to medium term, with current price action reflecting a corrective rally rather than a trend reversal. Traders should watch the 5,325 level closely: failure to break above it reinforces downside potential, while a decisive breakout could signal a shift toward a bullish recovery.
This communication is for informational purposes only and should not be viewed as any form of recommendation as to a particular course of action or as investment advice. It is not intended as an offer or solicitation for the purchase or sale of any financial instrument or as an official confirmation of any transaction. Opinions, estimates and assumptions expressed herein are made as of the date of this communication and are subject to change without notice. This communication has been prepared based upon information, including market prices, data and other information, believed to be reliable; however, Trade Nation does not warrant its completeness or accuracy. All market prices and market data contained in or attached to this communication are indicative and subject to change without notice.

STOXX50 INTRADAY Bullish sideways consolidationTrend: Overall trend remains bullish, supported by rising price action.
Recent Movement: Price is in a sideways consolidation phase after a strong uptrend.
Key Levels
Support:
5310 – Key level from prior consolidation.
5275, then 5230 – Next supports if 5310 breaks.
Resistance:
5480 – First upside target.
5510, then 5565 – Further resistance levels on continued strength.
Trading Scenarios
Bullish Scenario:
A pullback to 5310 followed by a bounce could lead to a move towards 5480, then higher to 5510 and 5565.
Bearish Scenario:
A confirmed break and daily close below 5310 would weaken the bullish case. In that case, expect a potential drop to 5275, then 5230.
Conclusion
The FTSE remains bullish, but a short-term pullback is possible. A bounce from 5310 would confirm trend strength. Watch 5310 closely — holding above favours bulls; a break below shifts sentiment to bearish.
This communication is for informational purposes only and should not be viewed as any form of recommendation as to a particular course of action or as investment advice. It is not intended as an offer or solicitation for the purchase or sale of any financial instrument or as an official confirmation of any transaction. Opinions, estimates and assumptions expressed herein are made as of the date of this communication and are subject to change without notice. This communication has been prepared based upon information, including market prices, data and other information, believed to be reliable; however, Trade Nation does not warrant its completeness or accuracy. All market prices and market data contained in or attached to this communication are indicative and subject to change without notice.

STOXX INTRADAY consolidation key support at 5310Trend: Overall trend remains bullish, supported by rising price action.
Recent Movement: Price is in a sideways consolidation phase after a strong uptrend.
Key Levels
Support:
5310 – Key level from prior consolidation.
5275, then 5230 – Next supports if 5310 breaks.
Resistance:
5480 – First upside target.
5510, then 5565 – Further resistance levels on continued strength.
Trading Scenarios
Bullish Scenario:
A pullback to 5310 followed by a bounce could lead to a move towards 5480, then higher to 5510 and 5565.
Bearish Scenario:
A confirmed break and daily close below 5310 would weaken the bullish case. In that case, expect a potential drop to 5275, then 5230.
Conclusion
The FTSE remains bullish, but a short-term pullback is possible. A bounce from 5310 would confirm trend strength. Watch 5310 closely — holding above favours bulls; a break below shifts sentiment to bearish.
This communication is for informational purposes only and should not be viewed as any form of recommendation as to a particular course of action or as investment advice. It is not intended as an offer or solicitation for the purchase or sale of any financial instrument or as an official confirmation of any transaction. Opinions, estimates and assumptions expressed herein are made as of the date of this communication and are subject to change without notice. This communication has been prepared based upon information, including market prices, data and other information, believed to be reliable; however, Trade Nation does not warrant its completeness or accuracy. All market prices and market data contained in or attached to this communication are indicative and subject to change without notice.

"STOXX50/EURO50" Trading Plan: Ride the Wave or Get Trapped?🚨 EUROPEAN INDEX HEIST: STOXX50 Breakout Robbery Plan (Long Setup) 🚨
🌟 Hi! Hola! Ola! Bonjour! Hallo! Marhaba! 🌟
Attention Market Bandits & Index Robbers! 🏦💶💸
Using 🔥Thief Trading tactics🔥, we're targeting the STOXX50/EURO50 for a clean breakout heist. The plan? Go long and escape before the MA trap snaps shut. Overbought? Yes. Risky? Absolutely. But real thieves profit when weak hands panic. Take your cut and run! 🏆💰
📈 ENTRY: TIME TO STRIKE!
Wait for MA breakout at 5460.00 → Then move fast!
Buy Stop Orders: Place above Moving Average
Buy Limit Orders: Sneak in on 15M/30M pullbacks
Pro Tip: Set a BREAKOUT ALARM - don't miss the action!
🛑 STOP LOSS: DON'T GET CAUGHT!
For Buy Stop Orders: Never set SL pre-breakout - amateurs get burned!
Thief's Safe Zone: Recent swing low (5300.00 on 4H chart)
Rebels: Place SL wherever... but don't cry later! 😈
🏴☠️ TARGET: 5680.00 (OR ESCAPE EARLY!)
Scalpers: Long only! Trail your SL like a pro
Swing Traders: Ride this heist for max gains
💶 MARKET CONTEXT: BULLISH BUT TRAPPY
Fundamentals: Macro data, COT reports, Quant analysis
Market Sentiment: Intermarket flows, positioning
Full Analysis: Check our bio0 linkss 👉🔗 (Don't trade blind!)
⚠️ WARNING: NEWS = VOLATILITY TRAP!
Avoid new trades during high-impact news
Lock profits with trailing stops - greed gets you caught!
💥 SUPPORT THE HEIST!
Smash that Boost Button 💖→ Stronger crew = bigger scores!
Steal profits daily with the Thief Trading Style 🎯🚀
Next heist coming soon... stay sharp! 🤑🐱👤🔥

STOXX INTRADAY uptrend continuation supported at 5310Trend: Overall trend remains bullish, supported by rising price action.
Recent Movement: Price is in a sideways consolidation phase after a strong uptrend.
Key Levels
Support:
5310 – Key level from prior consolidation.
5275, then 5230 – Next supports if 5310 breaks.
Resistance:
5480 – First upside target.
5510, then 5565 – Further resistance levels on continued strength.
Trading Scenarios
Bullish Scenario:
A pullback to 5310 followed by a bounce could lead to a move towards 5480, then higher to 5510 and 5565.
Bearish Scenario:
A confirmed break and daily close below 5310 would weaken the bullish case. In that case, expect a potential drop to 5275, then 5230.
Conclusion
The FTSE remains bullish, but a short-term pullback is possible. A bounce from 5310 would confirm trend strength. Watch 5310 closely — holding above favours bulls; a break below shifts sentiment to bearish.
This communication is for informational purposes only and should not be viewed as any form of recommendation as to a particular course of action or as investment advice. It is not intended as an offer or solicitation for the purchase or sale of any financial instrument or as an official confirmation of any transaction. Opinions, estimates and assumptions expressed herein are made as of the date of this communication and are subject to change without notice. This communication has been prepared based upon information, including market prices, data and other information, believed to be reliable; however, Trade Nation does not warrant its completeness or accuracy. All market prices and market data contained in or attached to this communication are indicative and subject to change without notice.

Trendline BreakThe price has been consolidating within a trendline and now the price has broken out followed by a pullback and now the price has made a higher high, suggesting a bullish impulse is at hand, time to go long
WE ONLY TRADE PULLBACKS

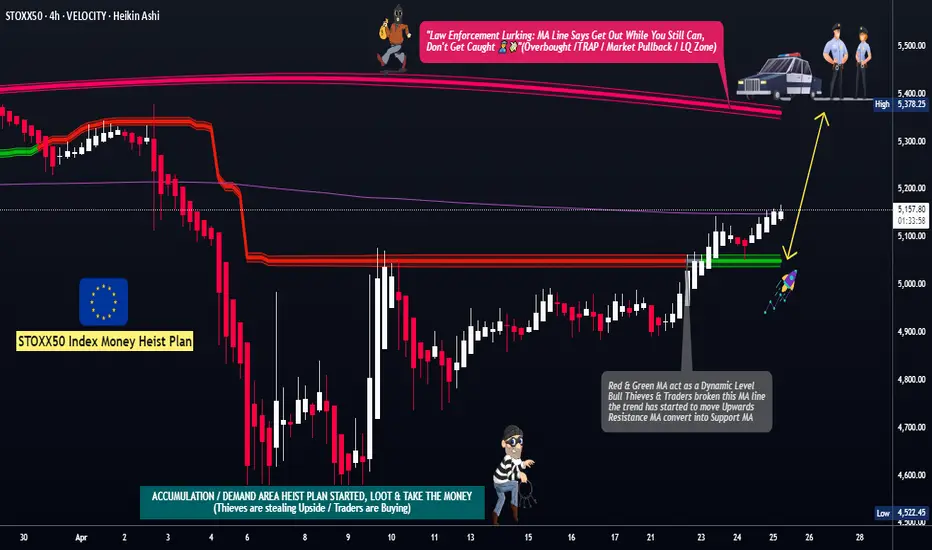
"STOXX50/EURO50" Index Market Money Heist (Day Trade)🌟Hi! Hola! Ola! Bonjour! Hallo! Marhaba!🌟
Dear Money Makers & Robbers, 🤑 💰💸✈️
Based on 🔥Thief Trading style technical and fundamental analysis🔥, here is our master plan to heist the "STOXX50/EURO50" Index Market. Please adhere to the strategy I've outlined in the chart, which emphasizes long entry. Our aim is the high-risk Moving Average Line area. It's a Risky level, overbought market, consolidation, trend reversal, trap at the level where traders and bearish robbers are stronger. 🏆💸"Take profit and treat yourself, traders. You deserve it!💪🏆🎉
Entry 📈 : "The vault is wide open! Swipe the Bullish loot at any price - the heist is on!
however I advise to Place buy limit orders within a 15 or 30 minute timeframe nearest or swing low or high level for pullback entries.
Stop Loss 🛑:
📍 Thief SL placed at the recent/swing low level Using the 1H timeframe (4900) Day/Swing trade basis.
📍 SL is based on your risk of the trade, lot size and how many multiple orders you have to take.
Target 🎯: 5370
🧲Scalpers, take note 👀 : only scalp on the Long side. If you have a lot of money, you can go straight away; if not, you can join swing traders and carry out the robbery plan. Use trailing SL to safeguard your money 💰.
💰💵💸"STOXX50/EURO50" Index Market Heist Plan (Swing/Day Trade) is currently experiencing a Bullish trend.., driven by several key factors.☝☝☝
📰🗞️Get & Read the Fundamental, Macro Economics, COT Report, Geopolitical and News Analysis, Sentimental Outlook, Intermarket Analysis, Index-Specific Analysis, Future trend targets with Overall outlook score... go ahead to check 👉👉👉🔗🔗
⚠️Trading Alert : News Releases and Position Management 📰 🗞️ 🚫🚏
As a reminder, news releases can have a significant impact on market prices and volatility. To minimize potential losses and protect your running positions,
we recommend the following:
Avoid taking new trades during news releases
Use trailing stop-loss orders to protect your running positions and lock in profits
💖Supporting our robbery plan 💥Hit the Boost Button💥 will enable us to effortlessly make and steal money 💰💵. Boost the strength of our robbery team. Every day in this market make money with ease by using the Thief Trading Style.🏆💪🤝❤️🎉🚀
I'll see you soon with another heist plan, so stay tuned 🤑🐱👤🤗🤩
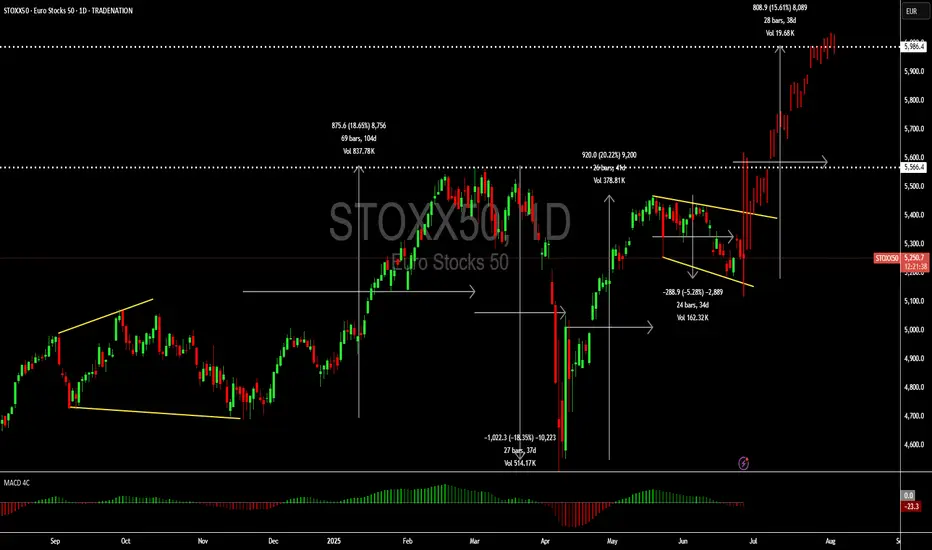
Is it the year for EUROPE? Looks like it's a yesFirst time since March 2025, the price of EURSTOXXX has broken above the downtrend and above the Cup and Handle.
It seems like the air is clearing from the mess up from the beginning of the year with the unstable US presidency.
And now let's see how long it lasts. EURO STOCKS is showing upside to come due to a few factors like:
📉 Trade Tensions Eased
U.S.-China tariff deal lifts global risk sentiment, boosting European stocks.
🏗️ Europe’s Spending Spree
Big infrastructure plans in Germany and France are lifting industrial shares.
🏦 Banks Are Booming
Stronger earnings and rising bond yields are powering up Eurozone banks.
💶 ECB Rate Cuts Coming
Markets expect ECB to cut rates soon, making stocks more attractive.
🛍️ Luxury & Exports Rising
Luxury brands and exporters are gaining as global demand rebounds.
And of course the technicals are looking great.
Cup and Handle
Price>20 and 200MA
Target 5,818
Disclosure: I am part of Trade Nation's Influencer program and receive a monthly fee for using their TradingView charts in my analysis.

STOXX INTRADAY bullish trend supported at 5225Key Support and Resistance Levels
Resistance Level 1: 5345
Resistance Level 2: 5375
Resistance Level 3: 5411
Support Level 1: 5225
Support Level 2: 5193
Support Level 3: 5157
This communication is for informational purposes only and should not be viewed as any form of recommendation as to a particular course of action or as investment advice. It is not intended as an offer or solicitation for the purchase or sale of any financial instrument or as an official confirmation of any transaction. Opinions, estimates and assumptions expressed herein are made as of the date of this communication and are subject to change without notice. This communication has been prepared based upon information, including market prices, data and other information, believed to be reliable; however, Trade Nation does not warrant its completeness or accuracy. All market prices and market data contained in or attached to this communication are indicative and subject to change without notice.

"STOXX50/EURO50" Index Market Money Heist (Day / Swing Trade)🌟Hi! Hola! Ola! Bonjour! Hallo! Marhaba!🌟
Dear Money Makers & Robbers, 🤑💰✈️
Based on 🔥Thief Trading style technical and fundamental analysis🔥, here is our master plan to heist the "STOXX50/EURO50" Index CFD Market. Please adhere to the strategy I've outlined in the chart, which emphasizes short entry. Our aim is the high-risk Green MA Zone. Risky level, oversold market, consolidation, trend reversal, trap at the level where traders and bullish robbers are stronger. 🏆💸"Take profit and treat yourself, traders. You deserve it!💪🏆🎉
Entry 📈 : "The heist is on! Wait for the MA breakout then make your move at (4500) - Bearish profits await!"
however I advise to Place sell stop orders above the Moving average (or) after the Support level Place sell limit orders within a 15 or 30 minute timeframe most NEAREST (or) SWING low or high level for Pullback entries.
📌I strongly advise you to set an "alert (Alarm)" on your chart so you can see when the breakout entry occurs.
Stop Loss 🛑: "🔊 Yo, listen up! 🗣️ If you're lookin' to get in on a sell stop order, don't even think about settin' that stop loss till after the breakout 🚀. You feel me? Now, if you're smart, you'll place that stop loss where I told you to 📍, but if you're a rebel, you can put it wherever you like 🤪 - just don't say I didn't warn you ⚠️. You're playin' with fire 🔥, and it's your risk, not mine 👊."
📌Thief SL placed at the nearest/swing High or Low level Using the 4H timeframe (4800) Day/Swing trade basis.
📌SL is based on your risk of the trade, lot size and how many multiple orders you have to take.
Target 🎯: 4200 (or) Escape Before the Target
"STOXX50/EURO50" Index CFD Market Heist Plan (Day / Swing Trade) is currently experiencing a Bearish trend.., driven by several key factors.👇👇👇
📰🗞️Get & Read the Fundamental, Macro, COT Report, Geopolitical and News Analysis, Sentimental Outlook, Intermarket Analysis, Index-Specific Analysis, Positioning and future trend targets... go ahead to check 👉👉👉🔗🔗
⚠️Trading Alert : News Releases and Position Management 📰 🗞️ 🚫🚏
As a reminder, news releases can have a significant impact on market prices and volatility. To minimize potential losses and protect your running positions,
we recommend the following:
Avoid taking new trades during news releases
Use trailing stop-loss orders to protect your running positions and lock in profits
💖Supporting our robbery plan 💥Hit the Boost Button💥 will enable us to effortlessly make and steal money 💰💵. Boost the strength of our robbery team. Every day in this market make money with ease by using the Thief Trading Style.🏆💪🤝❤️🎉🚀
I'll see you soon with another heist plan, so stay tuned 🤑🐱👤🤗🤩

STOXX50 oversold bounce back capped at 5056The STOXX50 Index remains in a bearish structure, with recent price action confirming a break below the prior consolidation zone, indicating potential for further downside.
Key Resistance: 5056 – former support turned resistance, aligning with the intraday consolidation area.
Support Levels:
4645 – near-term target if bearish momentum continues
4548 and 4480 – medium to long-term downside objectives
An oversold bounce may occur, but unless price breaks and closes above 5056 on the daily chart, the bearish outlook remains intact.
Conversely, a confirmed breakout above 5056 would invalidate the bearish bias and open the path to test 5154, with 5237 as a secondary resistance.
Conclusion
The STOXX50 bias is bearish below 5056. Watch for a rejection at that level to confirm downside continuation. A daily close above 5056 would shift the outlook to bullish.
This communication is for informational purposes only and should not be viewed as any form of recommendation as to a particular course of action or as investment advice. It is not intended as an offer or solicitation for the purchase or sale of any financial instrument or as an official confirmation of any transaction. Opinions, estimates and assumptions expressed herein are made as of the date of this communication and are subject to change without notice. This communication has been prepared based upon information, including market prices, data and other information, believed to be reliable; however, Trade Nation does not warrant its completeness or accuracy. All market prices and market data contained in or attached to this communication are indicative and subject to change without notice.

TrumpFreeze: The biggest rise since 2008 replicates todayBy Ion Jauregui - Analyst ActivTrades
The global financial market experienced one of its most intense days in years following the unexpected announcement by President Donald Trump, who decreed a 90-day pause in the “mega-tariffs” applied to his main trading partners. The decision, which contradicts official statements issued only 48 hours earlier, has been interpreted as a first step towards the de-escalation of the trade war that began in mid-2024, and has generated a domino effect in all stock markets around the world.
Reaction in the United States: historic rally on Wall Street
The first response came from Wall Street, where the main indexes experienced a session that will go down in the financial history books. The S&P 500 soared 9.52%, marking its biggest daily advance since the 2008 financial crisis. The Nasdaq 100 staged an even more spectacular rise, up 13%. The Dow Jones also followed the upward trend, rising 8.9%. This rebound reflects not only the relief of the tariff pause, but also the immediate repositioning of investors, who see this truce as an opportunity to recalibrate their portfolios. Risk perceptions fell sharply, as evidenced by the nearly 20-point drop in the VIX index, its largest decline so far this century. The VIX, which had exceeded 50 points in recent days, is now back to more contained levels, reflecting an improvement in market sentiment.
Impact in Asia: mixed optimism, pressure on China
The Asian reaction was swift. The Japanese Nikkei rose by nearly 9%, benefiting from both the US rally and expectations of less global trade tension. The same was not true in China: both the Hang Seng and the CSI 300 were barely up around 2%, affected by Beijing's exclusion from this tariff truce. In addition, the yuan continues to weaken, approaching lows not seen since 2007, in anticipation of new stimulus measures from the Chinese authorities.
Hedges, currencies and investor sentiment
Portfolio repositioning has also been reflected in the currency markets. The dollar has strengthened against the euro, while safe-haven assets such as the Japanese yen or the Swiss franc have shown a partial reversal, a sign that investors are moving out of “panic” mode towards a more neutral stance. At the macroeconomic level, this truce offers a window for diplomacy and trade policy realignment. Exporting economies, especially in Asia and Europe, could benefit from moving towards a more structural solution. However, the exclusion of China, coupled with the fragility of the yuan, suggests that much remains to be resolved.
Europe: strong opening and technical potential
In Europe, futures anticipated an opening with significant bullish gaps. The EuroStoxx 50 and the German DAX showed gains of more than 7.5% before the bell. In Spain, the Ibex 35 opened with a rise of 3.4%, trying to recover some of the ground lost since the March highs at 13,515 points. From a technical point of view, the Spanish selective index could bounce up to the 12,320 or even 12,555 points, levels that coincide with 38.2% and 50% Fibonacci retracements, respectively.
Nevertheless, the environment is still dominated by high volatility. In general the European open could well be considered for novices and the American close especially like yesterday's is for professionals to “sign” due to extreme volatility with all indicators at extremes and trading ranges soaring. It is always interesting to trade them but risk management must be incisive to avoid that we have to take the situation out of the usual conditions. It is a bit reminiscent of what happened in Donald Trump's first term, which worked on the back of Twitter/X and today it seems that these communications seem to be having much greater effects.
Technical Analysis EuroStoxx50
As we commented the European index yesterday in the American session started the session strongly with an average of 9170 with a high of 17600 ticks. The RSI became overbought at 75% at the time of President Trump's statement, having corrected the price during the Asian session by -2.92%. The European session start has continued to consolidate cold losing another -2.39% so it has lost about half of what was recovered in yesterday's American session. If we look at the crosses of averages, early this morning we could witness how the 50 average overcame the 100 average, which may mean that despite this correction the market seems to want to hold the price, despite a clear downtrend. If we go to the Checkpoint we can see that this is located around 4,620 points the trading zone after yesterday's upward correction. If we see the pressure of the delta zones we can see that the zone of greater pressure is located around 4700 points being the support the area of the checkpoint, so we could see corrections in the American session that continue a slightly bearish European session, in the face of this price consolidation.
Conclusion: nuanced pause, market in unstable equilibrium.
Although Trump's strategic shift has momentarily restored optimism to the markets, the environment still calls for caution. This tariff pause does not represent a definitive solution, but a temporary truce. Markets move on headlines, but they are built on facts. And in a context where price moves faster than certainties, the disciplined investor must continue to manage his exposure rigorously.
*******************************************************************************************
The information provided does not constitute investment research. The material has not been prepared in accordance with the legal requirements designed to promote the independence of investment research and such should be considered a marketing communication.
All information has been prepared by ActivTrades ("AT"). The information does not contain a record of AT's prices, or an offer of or solicitation for a transaction in any financial instrument. No representation or warranty is given as to the accuracy or completeness of this information.
Any material provided does not have regard to the specific investment objective and financial situation of any person who may receive it. Past performance is not reliable indicator of future performance. AT provides an execution-only service. Consequently, any person acting on the information provided does so at their own risk.

"STOXX50 / EURO 50" Indices Heist Plan (Swing/Day Trade)🌟Hi! Hola! Ola! Bonjour! Hallo! Marhaba!🌟
Dear Money Makers & Robbers, 🤑💰✈️
Based on 🔥Thief Trading style technical and fundamental analysis🔥, here is our master plan to heist the "STOXX50 / EURO 50" Index CFD Market. Please adhere to the strategy I've outlined in the chart, which emphasizes short entry. Our aim is the high-risk Green Zone. Risky level, oversold market, consolidation, trend reversal, trap at the level where traders and bullish robbers are stronger. 🏆💸Book Profits Be wealthy and safe trade.💪🏆🎉
Entry 📈 : "The vault is wide open! Swipe the Bearish loot at any price - the heist is on!
however I advise to Place sell limit orders within a 15 or 30 minute timeframe most recent or swing, low or high level.
Stop Loss 🛑: (5450) Thief SL placed at the recent/swing high or low level Using the 2H timeframe swing / day trade basis.
SL is based on your risk of the trade, lot size and how many multiple orders you have to take.
Target 🎯: 5200 (or) Escape Before the Target
🧲Scalpers, take note 👀 : only scalp on the Short side. If you have a lot of money, you can go straight away; if not, you can join swing traders and carry out the robbery plan. Use trailing SL to safeguard your money 💰.
"STOXX50 / EURO 50" Index CFD Market Heist Plan (Swing/Day) is currently experiencing a bearishness,., driven by several key factors.
📰🗞️Get & Read the Fundamental, Macro, COT Report, Quantitative Analysis, Sentimental Outlook, Intermarket Analysis, Future trend targets.. go ahead to check 🔎👉👉👉🔗
⚠️Trading Alert : News Releases and Position Management 📰 🗞️ 🚫🚏
As a reminder, news releases can have a significant impact on market prices and volatility. To minimize potential losses and protect your running positions,
we recommend the following:
Avoid taking new trades during news releases
Use trailing stop-loss orders to protect your running positions and lock in profits
💖Supporting our robbery plan 💥Hit the Boost Button💥 will enable us to effortlessly make and steal money 💰💵. Boost the strength of our robbery team. Every day in this market make money with ease by using the Thief Trading Style.🏆💪🤝❤️🎉🚀
I'll see you soon with another heist plan, so stay tuned 🤑🐱👤🤗🤩

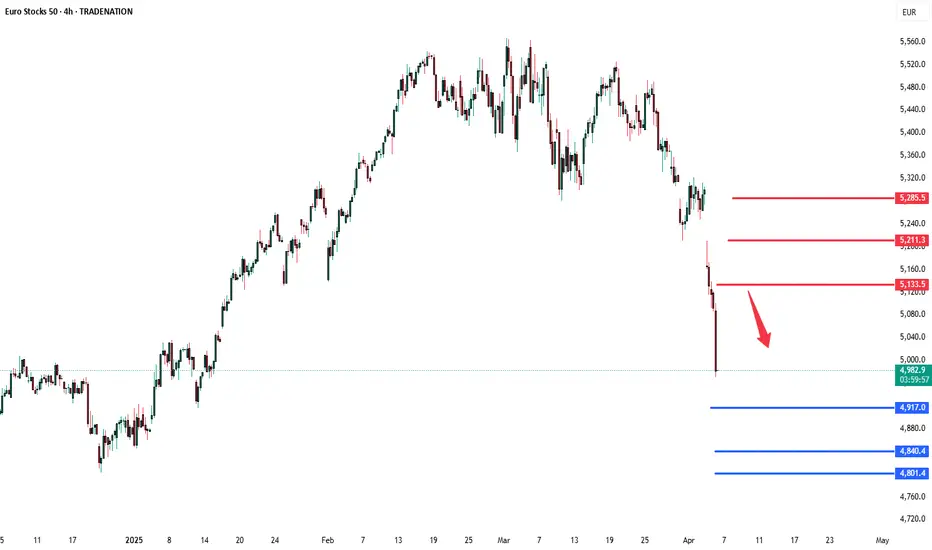
STOXX50 bearish continuation below 5133 The STOXX 50 index maintains a bearish outlook, aligned with the broader downtrend. Recent price action confirms a breakdown below a key consolidation zone, reinforcing the downward pressure.
Key Level: 5133
This level represents the former intraday consolidation zone and now acts as a pivotal resistance.
Bearish Scenario:
An oversold rally toward 5133 followed by a bearish rejection would reinforce downside momentum. If confirmed, this opens the path toward support at 4950, with extended targets at 4917 and 4840 over a longer timeframe.
Bullish Alternative:
A breakout and sustained daily close above 5133 would negate the current bearish setup. This shift could trigger a broader recovery, targeting 5211 initially, followed by a potential move to 5285.
Conclusion:
The technical structure remains bearish while the index trades below 5133. A rejection at this level would confirm further downside potential. Only a decisive break above 5133 would challenge the bearish bias and open the way for a bullish recovery.
This communication is for informational purposes only and should not be viewed as any form of recommendation as to a particular course of action or as investment advice. It is not intended as an offer or solicitation for the purchase or sale of any financial instrument or as an official confirmation of any transaction. Opinions, estimates and assumptions expressed herein are made as of the date of this communication and are subject to change without notice. This communication has been prepared based upon information, including market prices, data and other information, believed to be reliable; however, Trade Nation does not warrant its completeness or accuracy. All market prices and market data contained in or attached to this communication are indicative and subject to change without notice.