Eurostoxx 2022 Outlook - SX5EAs our first post it is essential to publish our longer term trend channel work as it provides the larger backdrop to our more detailed and shorter term work that we will be publishing in due course.
Starting with the Eurostoxx 50 Index (SX5E) we saw a 19% rally in as many trading days off the March lows only to run into resistance and the 3 month downtrend simultaneously around the 4020 level. That led to some decent chop back down and sideways with 3825 acting like a magnet for over a week. A brief pop higher from there back up to the 3925 downtrend we suggested was a great place to book long profits and errr on the side of caution and since then we are down ~4%.
So what next? We have a point of interest for bids coming in around current levels at 3750 which could take us into yet another corner between here and 3925 where we would switch back to a heavily hedged stance. Failure to do so will likely result in a revisit of the Covid uptrend which currently sits around 3500.
EU50EUR trade ideas

From 10k to 100k, Mar 20,22 EUR 50 SellWith the Ukraines Presidents words on the weekend talking about WW3, I believe the European markets will drop this week so I put a Sell Order in at 3893 with my SL at 4050.
I'll keep an eye on it but I think there will be a lot of volatility this week on all markets.
Stay safe.
Heiko

Euro Stoxx 50 Futures Europe Sun Storm Investment Trading Desk & NexGen Wealth Management Service Present's: SSITD & NexGen Portfolio of the Week Series
Focus: Worldwide
By Sun Storm Investment Research & NexGen Wealth Management Service
A Profit & Solutions Strategy & Research
Trading | Investment | Stocks | ETF | Mutual Funds | Crypto | Bonds | Options | Dividend | Futures |
USA | Canada | UK | Germany | France | Italy | Rest of Europe | Mexico | India
Disclaimer: Sun Storm Investment and NexGen are not registered financial advisors, so please do your own research before trading & investing anything. This is information is for only research purposes not for actual trading & investing decision.
#debadipb #profitsolutions

EUR STOXX 50 Analysis BeWare!EUR STOXX 50 Analysis
We May Expect a Pull Back and it could reach its previous High and big the BIG FALL.

SX5E: getting ready for a rebounceThe STOXX has arguably a complete 5 waves structure, rebounce of 200-300 points from here is likely if intraday low holds.
Target >4200
Stop <3890.
--
EW interpretation:
Off the top of Feb, what I regarded as azure wave (iv) of one degree higher, we can observe 5 waves structure.
The last wave v in purple is quite extended, but given that wave iii reached 1.236 extension of wave i, the proportion overall is justified.
Note that the technicals of this v of (v) made a higher low compared to the bottom of (iii).
Bigger picture (chart: )
Off the top of Nov '21 we have a clear 3 waves down structure, with orange circle c reaching 1.236 extension of circle a, nicely within the target range projected in my previous idea.
Looking closer to the subwaves structure of circle c, the (iii) and (v) is also quite extended, similar to the pattern of one degree lower.
The technicals here again made a higher low compared to the bottom of circle a.
These actions above suggest a corrective move with a typical abc pattern is being or already completed, a 61.8% retracement of this circle abc move is a reasonable target, if not higher.
For a shorter term trade, the 38.2% retracement ~4090 is a saver bet, but the R:R ratio is not that attractive to my taste.
Stop can be placed under intraday low ~3890, although the ideal target range of circle c can reach as far as 1.382 extension of circle a ~3870.
Be greedy when others are fearful.

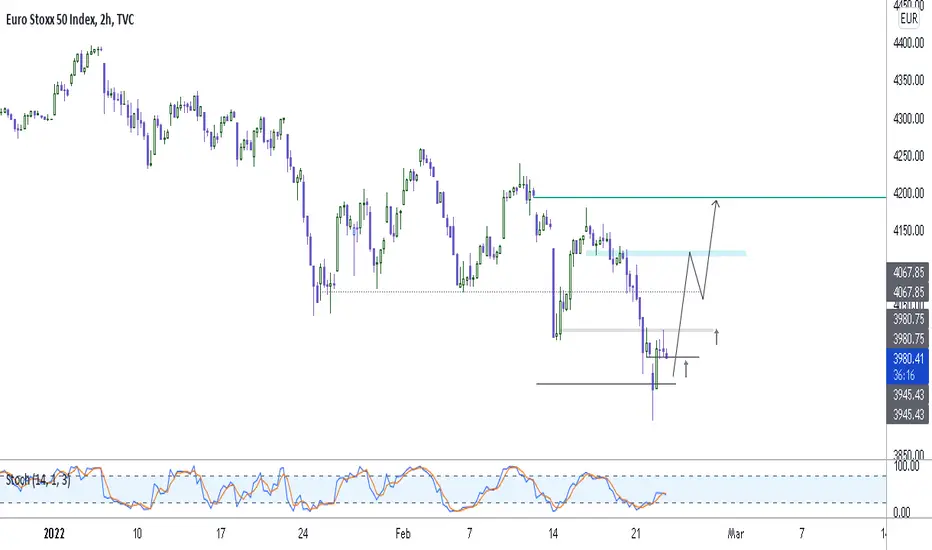
SX5E Looking To Go LongSX5E looks like it will reverse, and the potential bullish reversal area is the 4012.
Then the price might make a potential pullback at the 4067.85 area and then push on to reach 4200. There is a serious disinterest in bears for the 3880.

EUROSTOXX 50 (SX5E)The violation of the 3.800 level could occur in the case of confirmation of the war event (Russia-Ukraina). There would therefore be a further sell-off phase that would lead to the implementation of a first capitulation that would lead the Eurostoxx50 to move in the 3600-3200 range. The low end of this range could represent an attractive entry level. The breakout of the 3200 levels (although I personally see it as very difficult event) could only occur in a recession scenario associated with a very aggressive intervention by the Fed, with Russian tanks on the German border.


Broadening Formation & Wedge – Indices – EU50 - Daily - ShortCAPITALCOM:EU50
Looking at the upward trend from March 2020, we can see that you will get various readings depending on where you place your trend line.
Due to this and not specifically knowing if the stock is in a downtrend, I placed my trendline to match the newest low. This is because, in an uptrend, this could be the retracement followed by a move higher, and this has been known to happen in indices. Remember that indices are a collection of top-performing companies, so the price typically goes up.
Based on this, now I make my analysis. I can comfortably say that if it is pushed past this new low, the uptrend is probably over.
You can see the ascending broadening formation that begins in April 2021 and move, creating new higher highs till January 2022, where the price starts to lose its momentum. It subsequently creates a wedge with a series of lower highs but is still supported by the bottom support level, which is proving difficult to push past.
If you take note of the volume for each valley that hits this support level, you will see that it is above average. This happens every time the price moves there. This means that the support level in this area is a potent one. Not to mention if we look at the price here, you will find it sitting at a tidy round number (4000 EUR). From this, we can assume that buys have bought in here and are determined not to let price breakthrough.
However, if we look at the tightening wedge, along with the series of lower highs, the partial decline, and the volume just days prior signaling all the selling pressure, we can perhaps be inclined to think that a decline in price is on the way. Moreover, the wedge has formed what looks like a double top, but we will have to wait for the price to break the 4000 (Euro) mark in order for it to be confirmed.
I would suspect that if the price drops and closes below 4000, then there would be a potential short position. You might think that the previous valleys with their large volume would be a barrier to the short move if it does break, but I think they are too close within the price reach to be of any significance.
You could perhaps look at the first valley as your profit target. That would be approximately at a price 3853.
If you jump in at 4000 or just below as I suggest, you are looking at a target of 5 to 1. Remember that your stop would be just above 4000. This is because in the event that this is just a retracement, you would want to be out of the position immediately.
You could even tighten up your stop to increase your risk to reward, but I would wait to see what the indices does before taking this strategy.

SX5E: eyeing a rebounce from 3.9k, downward pressure remainsGame plan:
after the STOXX 50 drops into the target box around 3.93k, try to (not aggressively) long a short term rebounce.
Overview:
After a strong bull run off the covid low, the SX5E struct a major top in Nov '21. Since then we are in corrective territory, which makes me default to the ABC count of Elliott Wave.
Most commonly, C wave projects to the 1.0 to 1.382 extension of A wave. So if my count is correct, I'm expecting a local bottom to be struct just under 4k, from where I will try to play a short term rebounce.
The red arrows at the lower left corner come from two major lows struct in Jul and Oct '21. They might also have some indicative value.
As I previously, jokingly, noticed that the market seems to find a local bottom around the opening day of the Winter Olympics, Feb 4th might just be the day to watch ;)
Further I'm also expecting one more leg down after the rebounce, but that will depend on where this rebounce ends.
EW interpretation:
The initial drop in Dec '21 can be regarded as wave circle a, while circle b ran back to almost the top again, almost 100% retracement of circle a. These are marked in yellow and their fib levels help me put the yellow target box roughly between 3.87k and 4.01k.
Note that circle b itself has an outspoken 3 waves structure, marked in blue. Subwave (b) retraced to almost 100% of (a) while subwave (c) reached between 1.236 and 1.382 extension of subwave (a). Symmetry might be in play here.
By my count we are currently in progress of circle c, which should have a structure with 5 subwaves, marked in azure. The sharp decline in the last few sessions fits the impulsive character of wave (iii) of c, it's usually a reliable signal that a (stage of the) correction is near completion and a reversal is due.
Invalidation:
If SX5E recovers the top of subwave (ii) without dropping into the target box first, my count is likely wrong and no entry will be attempted.
On the other hand, if SX5E drops below the yellow bow, then I will have to reassess the entry and stop level.
The ideal entry signal will be when SX5E break out of the blue box to the upside, after fallen into it. Stop can be place just under the yellow box.

EURO STONXXXXX to follow RUTeuro stonks is looking a lot like the RUT chart b4 the damp
negative divergence been building for a while
Let's see what happens
GRI 2022


Broad market: It's the end of the world... until the WO beginsIn the past few years where the Winter Olympics were held, there was always a local dip to be bought around the day of the opening, to then ended up with a bigger crash a few months later.
The 2022 Games will be opened on 4 Feb, should be fun.
Disclaimer:
Given long enough time, market eventually goes up.

Europe 50 January 2022Based on my analysis: quick correction to 50 EMA and then we might see ATH by end of January

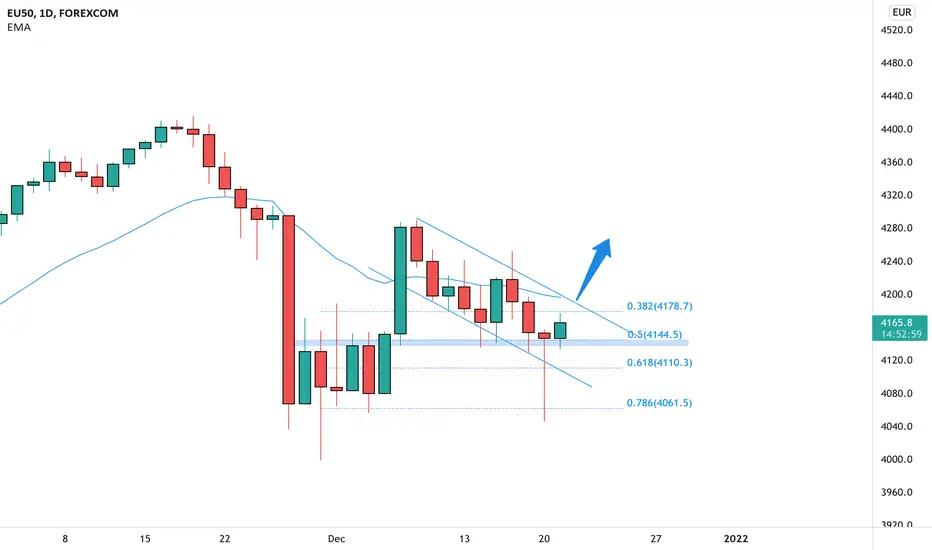
EU50 a turn at the 0.5 Fibonacci 🦐EU50 on the daily chart after the recent impulse retraced in a channel and perfectly retest the previous resistance now turn support at the 0.5 Fibonacci level.
According to Plancton's strategy IF the price will break above and satisfy the ACADEMY conditions we will set a nice long order.
--––
Follow the Shrimp 🦐
Keep in mind.
🟣 Purple structure -> Monthly structure.
🔴 Red structure -> Weekly structure.
🔵 Blue structure -> Daily structure.
🟡 Yellow structure -> 4h structure.
⚫️ Black structure -> <4h structure.
Here is the Plancton0618 technical analysis , please comment below if you have any question.
The ENTRY in the market will be taken only if the condition of the Plancton0618 strategy will trigger.

Europe 50 IndexUsed pivots and geometry here mainly
The only correction i'm calling initially is the retest
All depends on the euro, but i could see europe stonks outperforming us
NOT TRADING ADVICE

EUSTX50 Descending TrianglePrice closed below EMA 10, EMA 20, and Horizontal Support Resistance Level.

EU50 H4 LongReason for buy
D1 is uptrend.
H4 correction is broken by the volume increase.
enter the long trade right now.
Happy trading.

EU 50 TO 3KI'm bearish generally. I have taken the EU index. Selected major pivots- and arrived at a 3k target
This is the action-reaction method of TA
Also known as 'market geometry'
Trade at your own risk, folks
Timeframe 2-3 months

Buckle up.. Massive shorts about to kick in!European Markets and US Stocks made a massive bullrun during "the pandemic".
Pretty strange if you ask me for a scenario where the world was about to stop spinning...
But all over the world, moneyprinting seemed to be the way out.
And that money was given to those who needed the help, good to know
but it also made people lazy, it kept them comfortable.
They where not thinking about going back to work,
so the real economy could pick up its strenght.
And with that money things where bought, also Stocks..
Stocks bought on printed money, money that has no backbone or anything
to back it up, meaningless paper..
I dont need to explain anything further, i hope...
Trade safe and stay healthy!
Arthur

EU50 ShortEU50 led some bearish candlesticks on daily closes last week, despite it closing into a range we’re looking for a rejection off key level before taking trade. When we see that rejection we only expect it to drop to major support level however we could see some prolonged movement. Move SL to entry upon second TP hitting. RSI floating at 63 despite hitting 75.
R:R 1:2:2
GL
