HSI dipping, traders are flipping,stay Zen - Index is yoga-ing!Hello everyone!
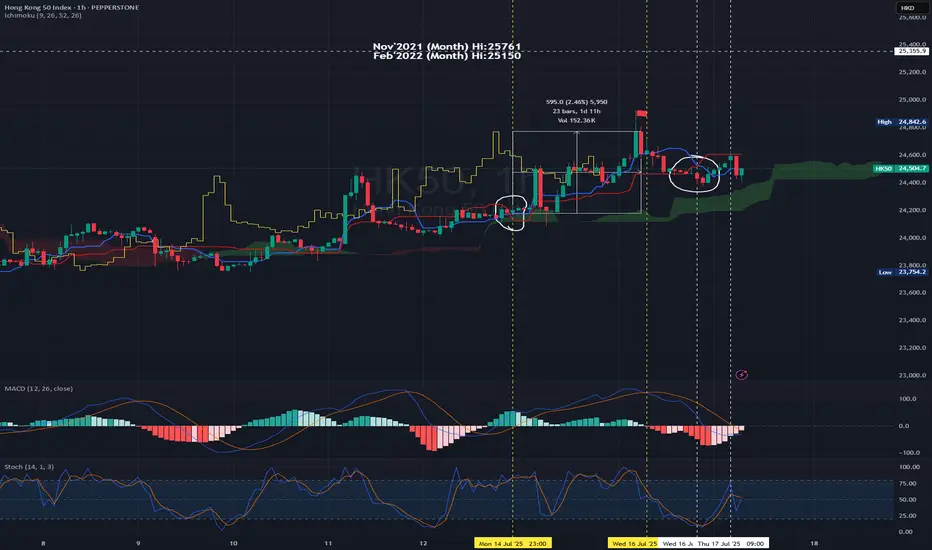
Today HK50 PEPPERSTONE:HK50 D open at 25350, Hi:25446 Lo:25164
IMO: Deep retracement is happening with profit taking from futures expiring tomorrow for traders & waiting for catalysts for talks next week.
For 4H - Index moving closer to Gravity Trend Line - look out for entry for

HK50 Index Robbery Plan – Bulls in Control, Load Up🚨💸💥**HK50 MONEY HEIST ALERT – Thief Trading Style Entry Plan!**💥💸🚨
"Swipe the Trend, Rob the Risk – The Hong Kong Vault is Open!"
🌍🌎Hey there, Global Money Movers, Heist Planners & Market Robbers!🕵️♂️💰
Welcome to another high-stakes operation brought to you by the Thief Trading Style – where strat

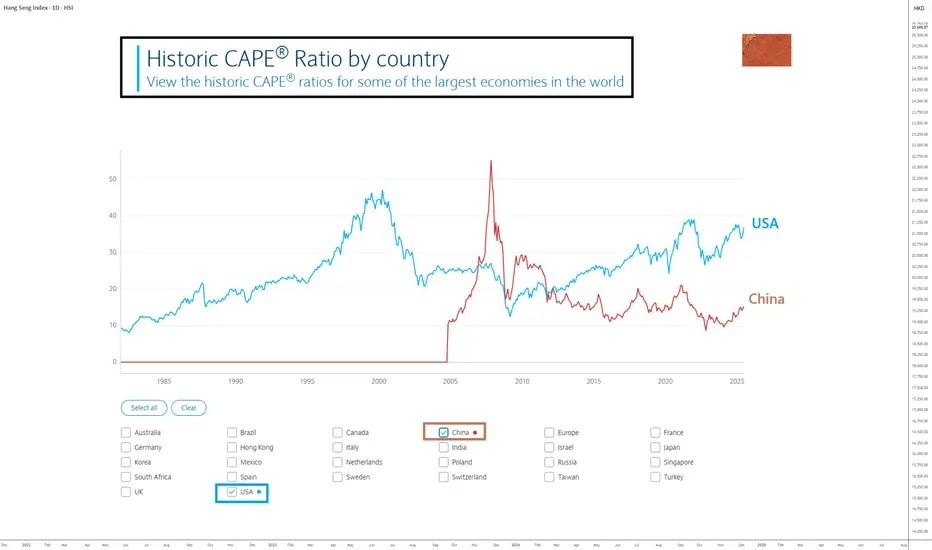
CHINA: Catch-Up Potential Remains AttractiveAs the U.S. stock market trades at all-time highs and has returned to its valuation levels of late 2021 (before the 2022 bear market), it may be wise to look at the Chinese stock market as a way to diversify your portfolio.
Regarding the analysis and potential of the S&P 500 Index, I encourage you
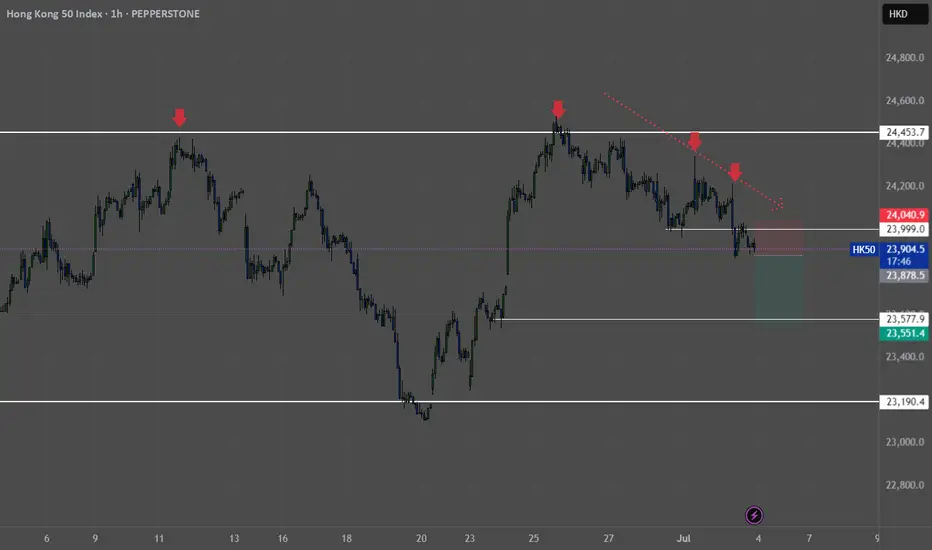
pull back of HK50 1. bearish BOS
2. after the bearish breakout retest did not go back to the last breakout momentum.
3. tend to sell around 25417 and TP 25212

HK50 LONG This trade is with the daily trend and the showing the momentum still being very up
There are multiple bat patterns on H1 and M15
This trade is oversold on all timeframes up to H4 and showing divergence
Stop loss of 200 pips

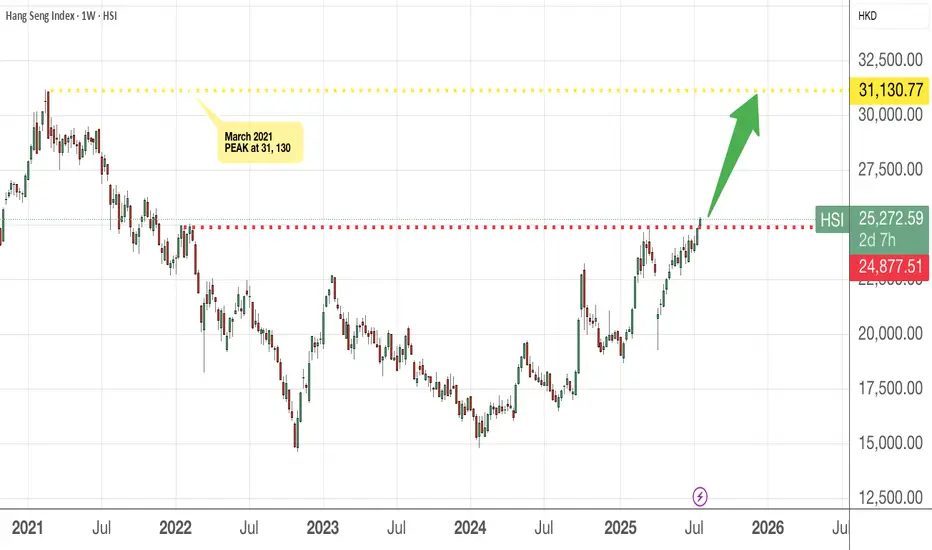
HSI has finally cleared the 25,000 level !!!!Congrats to all who are invested in the HSI index , ETF or individual stocks in HK. You should be smiling as the index crossed the 25k mark.
The next level I am looking at will be 27k mark and this will not be a straight line (as usual). Buy on pullback.
Of course, there are still many who think
Dont predict&anticipate the market - ask indicators for hints! Hello everyone! how was the HSI trade so far?
Apologies for not updating as I was allowing myself to take a pause journaling my trade also to pay attention on my own personal growth journey. However, am continue to trade HSI in sustainable and profitable way and have had trying and test using diffe
Will China's strong growth and ongoing stimulus lift the HK50?
Despite US-China trade tensions and weak domestic demand, China’s GDP growth has surpassed its 5% target for the first half of the year. According to the National Bureau of Statistics, Q2 GDP grew 5.2% YoY, with authorities noting that stimulus measures aimed at boosting consumption had some effec

(UPDATE) Hong Kong rally is evident to 26,944Hong Kong is shaping up nicely for upside.
We did this analysis in June and now it has broken above the breakout point and is showing signs of a rally.
🧧 1. Mainland Money Flood
Chinese investors are pouring cash into Hong Kong stocks, hitting record levels.
🚀 2. Big IPOs
Huge listings like

HK50 - H1 - ShortDirection - downwards rejection off 25000 level on the daily, and price moving back into the range.
Level - Price broken support and retested the 24000 level.
Price action - Multiple pin bar rejections off the daily level and hour levels.
See all ideas
Summarizing what the indicators are suggesting.
Oscillators
Neutral
SellBuy
Strong sellStrong buy
Strong sellSellNeutralBuyStrong buy
Oscillators
Neutral
SellBuy
Strong sellStrong buy
Strong sellSellNeutralBuyStrong buy
Summary
Neutral
SellBuy
Strong sellStrong buy
Strong sellSellNeutralBuyStrong buy
Summary
Neutral
SellBuy
Strong sellStrong buy
Strong sellSellNeutralBuyStrong buy
Summary
Neutral
SellBuy
Strong sellStrong buy
Strong sellSellNeutralBuyStrong buy
Moving Averages
Neutral
SellBuy
Strong sellStrong buy
Strong sellSellNeutralBuyStrong buy
Moving Averages
Neutral
SellBuy
Strong sellStrong buy
Strong sellSellNeutralBuyStrong buy
Displays a symbol's price movements over previous years to identify recurring trends.
Frequently Asked Questions
The current value of Hong Kong 33 is 24,856.5 HKD — it has risen by 0.33% in the past 24 hours. Track the index more closely on the Hong Kong 33 chart.
Hong Kong 33 reached its highest quote on Jan 29, 2018 — 33,495.3 HKD. See more data on the Hong Kong 33 chart.
The lowest ever quote of Hong Kong 33 is 8,328.3 HKD. It was reached on Apr 25, 2003. See more data on the Hong Kong 33 chart.
Hong Kong 33 value has decreased by −1.55% in the past week, since last month it has shown a 4.64% increase, and over the year it's increased by 47.31%. Keep track of all changes on the Hong Kong 33 chart.
Hong Kong 33 is just a number that lets you track performance of the instruments comprising the index, so you can't invest in it directly. But you can buy Hong Kong 33 futures or funds or invest in its components.