HK50 Short 1. This trade is against the H4 trend however, there is a pattern on M15 and M30
2. All timeframes are overbought, and there is a triple top with divergence
3. This is the week's high, and it will have a lot of resistance at this level.
4. Stop loss of 200 pips
5. 1st target is at 23150
HK33HKD trade ideas

HK50 Heist Alert: Snatch the Bullish Loot & Escape the Red Zone!🌎 Greetings, global fortune hunters! Bonjour, Shalom, Salut, Hola! 🌟
Dear Cash Commanders & Market Marauders, 💰⚡️
Forged in the 🔥 Rogue Trader’s crucible of technical and fundamental sorcery 🔥, here’s our sly scheme to plunder the HK50 “HongKong50” Index Market. Stick to the chart’s blueprint, homing in on long entries. Our endgame? Sneak out near the perilous ATR Red Zone, where overbought signals, consolidation, trend reversals, and traps await, with bearish outlaws ready to pounce. 🏴☠️💸 “Lock in profits and spoil yourself, traders—you’re unstoppable!” 🎉💥
**Entry 📈**: The safe’s wide open! Grab the bullish treasure at any price—the raid’s in motion!
For sharper moves, place buy limit orders on a 15 or 30-minute chart at the most recent swing low or high. Hot tip: set chart alerts to stay one step ahead!
**Stop Loss 🛑**:
📍 Rogue SL anchored at the recent swing low on the 4H timeframe (22700.00) for day or swing trades.
📍 Adjust SL based on your risk tolerance, lot size, and number of open orders.
**Target 🎯**: Aim for 24700.00—or slip away early if the market turns dicey!
🧲 **Scalpers, stay sharp!** 👀: Focus on long-side scalps only. Big bankroll? Jump in now! Smaller stack? Team up with swing traders for the heist. Use trailing SL to guard your gold 💰.
💵 **HK50 Market Heist (Swing Trade Breakdown)**: Sitting in a neutral zone with a bullish spark, driven by key market currents. ☝
🗞️ **Dig into the details**: Explore Fundamental Insights, Macroeconomic Trends, COT Reports, Geopolitical Shifts, Sentiment Signals, Intermarket Connections, Index-Specific Factors, Positioning, and Future Targets for the full picture! 👉🔗🌍
⚠️ **Trading Alert: News & Position Tactics** 📰🚨
News events can rattle markets like a tempest. To protect your profits:
- Steer clear of new trades during news releases.
- Deploy trailing stop-losses to secure gains and shield open positions.
💖 **Power up our raid!** 💥 Tap the Boost Button 💥 to amplify our profit-snatching prowess. Join the Rogue Trading Style posse and rake in riches daily with finesse. 🏆🤝🚀
See you at the next market ambush—stay vigilant! 🤑🐱👤🎯

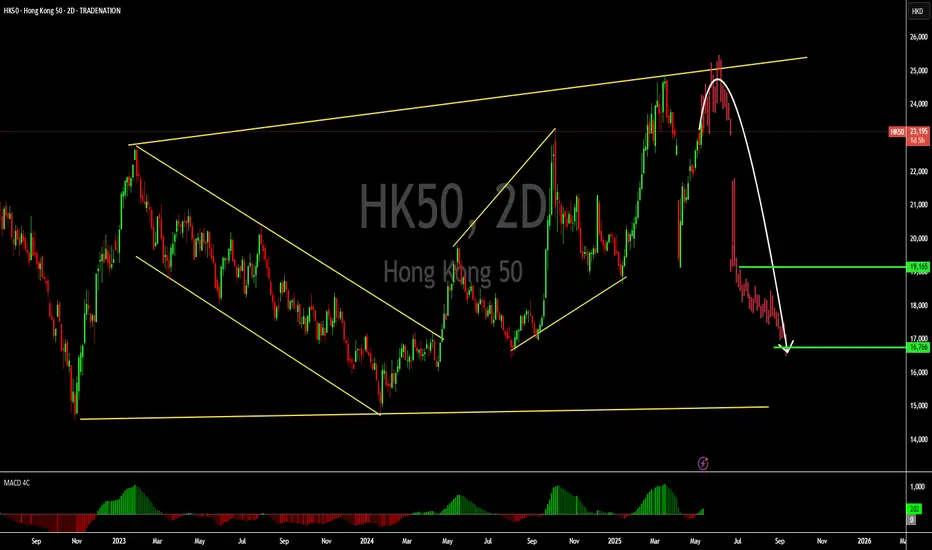
HK50: A medium term sell setup formingHello,
I see an opportunity for a short position on the HK50. The price is currently facing strong resistance at the upper range, struggling to break through, which suggests weakening bullish momentum. Additionally, the MACD indicator has aligned at a zero-line bearish crossover, reinforcing a potential downward move.
Trade Setup:
Entry Point: Initiate a short position on confirmation of a strong bearish candle forming at the current resistance level, indicating rejection from the top.
Target 1: HKD 19,165 – a conservative level where initial profit-taking could be considered.
Final Target: HKD 16,766 – the primary downside target based on key support levels and historical price action.
Stop Loss: Place above the recent high to protect against unexpected breakouts, ensuring disciplined risk management.
Disclosure: I am part of Trade Nation's Influencer program and receive a monthly fee for using their TradingView charts in my analysis.
Hang Seng Index Pulls Back as Trade Deal Optimism FadesHang Seng Index Pulls Back as Trade Deal Optimism Fades
Yesterday, Hong Kong’s Hang Seng Index (Hong Kong 50 on FXOpen) climbed above the 23,600 mark, supported by progress made during US–China tariff negotiations.
However, today the Hang Seng Index (HSI) has dropped towards the 23,100 level, which may be explained by fading optimism that dominated the market a day earlier.
According to Reuters, Christopher Hodge, Chief Economist at investment bank Natixis, stated that “these talks will yield nothing of long-term value. Ultimately, tariffs will still be significantly higher and will weigh on US economic growth.”
Technical Analysis of the Hang Seng Index (HSI) Chart
Price movements are forming an upward trend channel (marked in blue), with the following features:
→ The price is situated in the upper half of the channel (a sign of demand), and the upper boundary appears to act clearly as resistance;
→ Yesterday’s reversal suggests that bears became active above the former support area near the 23,385 level.
In this context, it is reasonable to assume that the Hang Seng Index (Hong Kong 50 on FXOpen) may test the support zone formed by the psychological level of 23,000 and the median line of the ascending channel. If the fundamental backdrop gives markets more reasons for caution, a deeper correction towards the lower boundary of the blue channel cannot be ruled out.
This article represents the opinion of the Companies operating under the FXOpen brand only. It is not to be construed as an offer, solicitation, or recommendation with respect to products and services provided by the Companies operating under the FXOpen brand, nor is it to be considered financial advice.

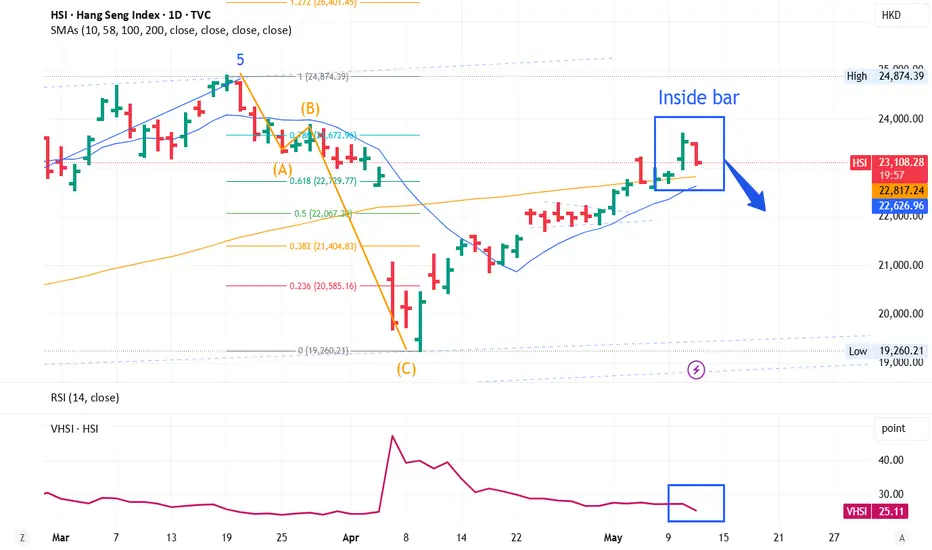
HSI may gap down tomorrowPrice Action Recap (Last 4 Trading Days):
Day 1 (8/5 Thu): High volatility
Day 2 (9/5 Fri): Inside bar — consolidation
Day 3 (12/5 Mon): Gapped up post-15:00 on tariff news
Day 4 (13/5 Tue): Failed to follow through → another inside bar
🧯 Volatility is now at recent lows, and today's price action lacked direction.
📊 Despite still trading above MA10 and MA58, the short-term momentum seems to be fading.
My View:
We're potentially in a short-term reinforcement or minor retracement phase.
Some wave-based projections see HSI in the 2nd wave of an irregular flat (335), aiming for 24,800+,
but I'm sceptical due to weak local fundamentals and earnings outlook.
📌 Watch for tomorrow’s open — a gap down would confirm short-term weakness.
HSI on the climb—ride the waves with your own strategy!6May2025
Hello everyone! how was the HSI trade so far?
From the previous updates trust everyone likely knows how the movement of the Index.
Paying attention on how it moved and the forecast of futures movement seems predicted. Of course, some times it may not go according to what you forecasted. Hence, to develop your own trade plan is essential.
From previous posts:-
MACD - Deadcross formed 20/3/2025 on D Chart.
MACD - Goldencross formed 21Apr2025 on D chart, although still within bearish zone but it did a short bull run since then; opened at 21015 on 22Apr and as of writing 22613; it gives around 1598pts ~7.6% gained.
CAPITALCOM:HK50
Fast forward to now:-
4H chart
at point of writing ✍️: the Index uptrend mode is on track again.
Trade for profit requires persistency and consistence. The constancy is kind of boring.
Buy into support Sell at resistance.
Set your TP/SL & protect your capital.
currently on D Chart -
20EMA:22065; 50EMA:22080 (both are sticking together at the moment and curving up)
🚨 as of ✍️ :
🗝️ Resistance Level : 22700-22730
🗝️ Support Level : 22360-22400
🗝️ Strong Support Level : 21950-21990
W Chart:- HSI:HSI
HSI continues its Bullish mode with strong pullback! Recovery could expected to see in end Jun - early Jul'25.
17Mar2025 -
24Mar2025 -
7Apr2025 -
6May2025 -
Continue the Long call for HSI:HSI with the forecast and repetitive of history the next 4-6weeks might be a good profit taking level; hold any long position and manage the risk as well.
Target to take profit: 24630-24910 (it may break 25000 level, and paused at 25300 strong resistance level, you may crosscheck with Month chart for the Bullish trend; last week the MACD signal line break above the zero level.)
For current markets condition, the CHN & HKG continue to be volatile with the continuing noise from tariff and on macro the numbers could be mixed.
🎯 Reminder: For long term (6-18 months) continue to accumulate China & HKG for the potential upside for the year! All retracement is a good entry point. Again, everything is impermanence. Manage your risk, position sizing. Take only the risk that you can afford.
🔎 DYODD and don't listen to anyone. Invest in yourself, do some study and learn along the way while you trying to verify or finding the answer if to start invest in CHN/HKG markets. If you don't know how or where, you may ask Deepseek/Chatgpt for most reputable Trading courses nearest to you.
Stay sharp, trade smart, and let consistency be your superpower. 📈🍵📙
Continue to trade; continue your life as it is!
Happy Trading!
** Please Boost 🚀/LIKE 👍, FOLLOW ✅, SHARE 🙌 and COMMENT ✍ if you enjoy this idea! Share your trading journey to encourage peoples who pursing the same journey.

HKMA's Bold Move: HK$46.5 Billion Purchase Fuels HKD SurgeA spokesman for the HKMA announced that the Hong Kong dollar activated the linked exchange rate mechanism at HK$7.75 to US$1 during New York trading on Friday, 2 May 2025. The HKMA purchased US dollars and sold HK dollars, amounting to HK$46.539 billion. By Wednesday, 7 May 2025, the total balance of the banking system will rise to HK$91.309 billion.
The spokesperson noted that the recent strength of the Hong Kong dollar stems from increased demand related to stock investments, which bolsters the exchange rate. Additionally, the appreciation of several regional currencies against the US dollar has contributed to the Hong Kong dollar's strength. The last activation of the strong side redemption guarantee occurred on 28 October 2020.
Reuters reported that European equity funds attracted their largest weekly inflow in over a year, totalling $14.64 billion for the week ending 30 April. In contrast, U.S. funds experienced outflows for the third consecutive week due to ongoing uncertainty regarding tariffs and their impact on global economic growth. Investments in Asian funds reached $6.68 billion.(source Reuters).
Although comparing the report time, they are reporting different fund flow; the inflow of money into Hong Kong is currently modest, at HK$46.539 billion (approximately $5.99 billion), it is comparable to the figures reported by Reuters for Asian funds.
In the Hong Kong property market, Sun Hung Kai Properties’ Sierra Sea project has sold all 318 flats in its first sales round last week and the second batch of 288 flats. In total, 606 flats were purchased over two weekends. Property agents report that 20 to 40 per cent of prospective buyers are from mainland China. Prices for these units range from HK$3.27 million to HK$8.99 million (US$422,000 to US$1.16 million), with a price per square foot between HK$9,992 and HK$13,533.(source: SCMP)
These cases indicate that money is flowing into Hong Kong, with the HKD strengthening to the strong side of 7.75. This influx will increase bank balances, suggesting that the Hang Seng Index (HSI) is unlikely to weaken in the coming weeks, despite the negative impact of US tariffs on business sentiment.
Technically, the HSI has potential for further gains, with targets set between 26,700 and 27,600. It remains within an upward channel, and cycle analysis indicates that this upward trend could continue until June.
Why is money flowing into Hong Kong? Is it due to the attractive price-to-earnings ratio, Chinese investors relocating funds from the US, or rumours about the government? These factors need to be validated in the future.


"HK50" Indices Market Bearish Heist Plan (Swing / Day Trade)🌟Hi! Hola! Ola! Bonjour! Hallo! Marhaba!🌟
Dear Money Makers & Robbers, 🤑💰✈️
Based on 🔥Thief Trading style technical and fundamental analysis🔥, here is our master plan to heist the "HK50" Indices Market. Please adhere to the strategy I've outlined in the chart, which emphasizes short entry. Our aim is the high-risk Green Zone. Risky level, oversold market, consolidation, trend reversal, trap at the level where traders and bullish robbers are stronger. 🏆💸Book Profits Be wealthy and safe trade.💪🏆🎉
Entry 📈 : "The heist is on! Wait for the breakout (23100) then make your move - Bearish profits await!"
however I advise placing Sell Stop Orders below the breakout MA or Place Sell limit orders within a 15 or 30 minute timeframe. Entry from the most recent or closest low or high level should be in retest. I Highly recommended you to put alert in your chart.
📌I strongly advise you to set an "alert (Alarm)" on your chart so you can see when the breakout entry occurs.
Stop Loss 🛑: Thief SL placed at (24200) Swing Trade Basis Using the 4H period, the recent / swing high or low level.
SL is based on your risk of the trade, lot size and how many multiple orders you have to take.
Target 🎯: 22000 (or) Escape Before the Target
🧲Scalpers, take note 👀 : only scalp on the Short side. If you have a lot of money, you can go straight away; if not, you can join swing traders and carry out the robbery plan. Use trailing SL to safeguard your money 💰.
"HK50 / HongKong50" Indices Market Heist Plan is currently experiencing a bearishness,., driven by several key factors.
📰🗞️Get & Read the Fundamental, Macro, COT Report, Geopolitical and News Analysis, Sentimental Outlook, Intermarket Analysis, Index-Specific Analysis, Positioning and future trend targets.. go ahead to check 👉👉👉🔗
⚠️Trading Alert : News Releases and Position Management 📰 🗞️ 🚫🚏
As a reminder, news releases can have a significant impact on market prices and volatility. To minimize potential losses and protect your running positions,
we recommend the following:
Avoid taking new trades during news releases
Use trailing stop-loss orders to protect your running positions and lock in profits
💖Supporting our robbery plan 💥Hit the Boost Button💥 will enable us to effortlessly make and steal money 💰💵. Boost the strength of our robbery team. Every day in this market make money with ease by using the Thief Trading Style.🏆💪🤝❤️🎉🚀
I'll see you soon with another heist plan, so stay tuned 🤑🐱👤🤗🤩

Hang Seng Short: Completion of correctionAs I mentioned, I was wrong in the previous analysis. And this time, I would short again with the stop loss above where I put the end of E wave.

A double sell pattern on HK50 at price21000 to 21100
Why?
1) This pair is still in a downtrend both of H4 and D1
2) We can see the pair had a pattern earlier yesterday for a sell, now it is a type 2
3) There is another pattern forming for the sell off around the same area
We will observe for another 1 hour to get the best price to enter.
The target if everything falls again would be 1:10 Risk to reward.

Hang Seng Short: Completion of ABCAs shown in the chart, I've updated the wave counts. Find a place to sell and stop above C high.

HK50: Time to begin looking for buys from the bottomHello,
The Hong Kong 50 index seems to be forming a great pattern for investors to begin looking for buys at the bottom. The Hang Seng dropped to its lowest since the high reached in March 2025 as the Trump administration moved forward with sweeping tariffs on major trading partners, including a 104% levy on Chinese goods set to take effect today.
News of that Hong Kong may offer aid to firms affected by U.S. tariffs will help cushion markets from further falls. Discussions may be the catalyst for the next rise in the index and Hong Kong stocks.
From a technical perspective the index is trading in a sideways corrective pattern, and further falls will provide even better opportunities for buys. We see prices below 18,000 HKD as great entry areas for this index. The recent top of HKD 24,600 will be our medium-term target.
Disclosure: I am part of Trade Nation's Influencer program and receive a monthly fee for using their TradingView charts in my analysis.

HSI Long: Potential Completion of Wave AThis is a short-term trading idea. I see that there is a chance that HSI has completed a 5-wave structure, even though wave 5 itself is a bit short. I'll go tactical long with stop below the low of the day.

Hang Seng Index Plunges by Around 13%Hang Seng Index Plunges by Around 13%
Hong Kong’s Hang Seng Index (Hong Kong 50 on FXOpen) tumbled by over 13% as trading resumed after the weekend with a sharp bearish gap.
According to media reports, this marked the biggest single-day drop since the 1997 Asian financial crisis.
Hang Seng Index Chart
In our analysis of the upward trend on the Hang Seng (Hong Kong 50 on FXOpen) chart a month ago, we noted that:
→ investor enthusiasm around artificial intelligence was still fuelling the rally;
→ however, the price appeared vulnerable to a correction.
We also highlighted that the outlook would largely depend on the fundamental backdrop, particularly the tariff standoff between China and the United States.
Since then, the Hang Seng Index (Hong Kong 50 on FXOpen) has fallen by around 17%, following the announcement of harsher-than-expected tariffs by President Trump, with China responding in kind.
Despite the drop, Hang Seng is outperforming peers
Despite Monday’s dramatic decline, the Hang Seng is still outperforming several other markets. As shown in the chart above, it remains in positive territory for 2025, unlike:
→ the ASX 200 (Australia 200 on FXOpen);
→ the S&P 500 (US SPX 500 mini on FXOpen);
→ and other global indices, including those in Europe and Japan.
What lies ahead?
Market sentiment remains highly sensitive to tariff-related news. For instance, Bloomberg reported that a post on social media platform X claimed President Trump was considering a 90-day pause on tariffs (excluding China), sparking hopes of a rebound.
Should Trump choose to soften the recently announced tariffs, this could act as a catalyst for a strong recovery across global equity markets.
This article represents the opinion of the Companies operating under the FXOpen brand only. It is not to be construed as an offer, solicitation, or recommendation with respect to products and services provided by the Companies operating under the FXOpen brand, nor is it to be considered financial advice.

what's next after historic plunged? what's next after historic plunged?
HSI needs to claw its way back - resistance now takes the spotlight!
🚨🚨🚨
🔎🎯 Always ask before you open a position, what's your time frame!?
Follow this principle for your trade for entry and exit so you will not lost on that particular trade. Happy trading everyone! 💰
From previous posts:-
MACD - Deadcross formed 20/3/2025 on D Chart.
4H chart:
at point of writing ✍️: the Index uptrend mode is broken where we have been reviewing the movement of the Index.
For this week trade plan: Most likely short the index for days to few weeks until get confirmation of reversal back to uptrend.
For swing trade: Buy into support Sell at resistance.
Set your TP/SL & protect your capital.
PEPPERSTONE:HK50
On 7Apr25 - special Monday, HSI dropped 13.22% ; 3021.51pts to close at 19828.30. The Index below its 20MA@22814 (currently); 50MA@22509 (currently)
This is the historic largest single day plunge since 1997 Asian Financial Crisis.
Historically, the HSI has experienced significant single-day drops during major financial crises. For instance, that was on October 28, 2008, amid the global financial crisis, the HSI fell by 12.7%, marking its biggest single-day percentage drop since 1997.
Well, human beings shape history. While it may not repeat the same way, but often returns in similar forms and familiar contexts. We are the innovative and creativity creatures on this earth, hence we are free to craft the stories eventually become history.
PEPPERSTONE:HK50
currently the 20MA:22581; 50MA:22423
🚨 as of ✍️ :
🗝️ Resistance : 20632
Resistance Level : 20143 20266
Support Level : 18830 19450
🗝️ Support : 18751
W Chart:- HSI continues its Bullish mode with strong pullback! Recovery could expected to see in end Jun - early Jul'25.
17Mar2025 -
24Mar2025 -
7Apr2025 -
For current markets condition, the CHN & HKG can be volatile with the continuing noise from tariff.
🎯 Reminder: For long term (6-18 months) continue to accumulate China & HKG for the potential upside for the year! All retracement is a good entry point.
🔎 DYODD and don't listen to anyone. Invest in yourself, do some study and learn along the way while you trying to verify or finding the answer if to start invest in CHN/HKG markets. If you don't know how or where, you may ask Deepseek/Chatgpt for most reputable Trading courses nearest to you.
Let's follow our own zentradingstrategy , continue to trade and zen with 📙 and 🍵 for profits.
** Please Boost 🚀/LIKE 👍, FOLLOW ✅, SHARE 🙌 and COMMENT ✍ if you enjoy this idea! Share your trading journey to encourage trading and investment buddies.

mid term down trendHSI in mid term will decline. if 16550 support act again, new lag will emerge with 90% gain.

hong kong 50 shortshort to the end of April
under 20000.
i hope 19000 or even 18000.
but 19000-20000 is enough.

Hang Seng Index Long: Super Bull Case?I did a short video about how entire chart of Hang Seng Index can also be interpreted as a Super Bullish case for Hang Seng Index, and generally the entire Chinese and Hong Kong Market.
This was originally my primary count which I then replaced with a combination (W-X-Y-X-Z) when I thought the risk-reward favours the short side. Now, I've switched back and dare myself to put up this super bull case again.
Note how shallow I had placed the primary wave 2. If I am right, then wave 3 is going to literally rocket up.

QUICK SHORTSSell for the short range, price is bound to make a bottom on the level indicated for a reverse bull trend that will last multi-months. Trade safe

Hang Seng Short: Expecting Wave 2 of 3 and 3 of 3Hang Seng had been amazingly resilient on Friday, falling much lesser than the US indices. However, I believe it is just lagging by 1 impulse wave.
If you have seen my last few updates on the wave counts, you will know that I counted completion of wave 3 of 3 for the tech stocks and that Nasdaq itself is nearing the target completion of 5 waves of wave 3 (now on wave 4 of 3). Thus, to me, Hang Seng is lagging by 1 impulse wave.
Back to this analysis, for the last down wave on Friday, you will see that I've plotted a purple minute wave with the 5th wave further broken down into orange minuette waves. The orange minuette wave is only on it's 4th wave. However, I believe that we might not actually see a proper wave draw by price movement. I propose that the fifth wave will be unseen. How so?
Gap down on Monday opening (marking the end of minuette wave 5) and then a shallow retracement up that is likely to happen during the 1st hour of HK trading session to complete purple minute wave 2 before we see Hang Seng crashing for a wave 3. It might be similar to what happened to Nikkei on Friday's Japan trading hours.
Good luck!

HK50 HongKong Index ShortMore pro-active policies in China
More tariffs on Copper
This will put the asian indices more under pressure
3 apporaoches
and 3 different targets
My entries are aggressive and conservative
Where others use the stop zone,there I aggressively buy/sell into my targeted potential direction(cover more shorts in this case)
More details: Please take a look at the chart above

HSI testing resistance levels —will it break through or bounced?25/03/2025
🚨🚨🚨
HSI resistance is being tested for short-term!
Investors tend to take profit towards quarter end.
HSI:HSI
MACD - Deadcross formed 20/3/2025.Resistance 24750-24600 level.
4H chart: PEPPERSTONE:HK50
at point of writing ✍️: the Index uptrend mode is paused and moving out of bound from the uptrend channel.
MACD : moving below zero line - Bearish mode.
KDJ: below 30 level in the bearish zone. Hopefully the divergence cycle completing soon for a strong reversal.
BB - ranging at lower BB; mid-line:23986 (this is your 🗝️ level for your long/short TP/SL level)
Set your TP/SL and let the markets works.
For this week trade plan: Most likely short the index for days to few weeks until get confirmation of trendline back to uptrend channel. Buy into support Sell at resistance. Set your TP/SL.
🚨 as of ✍️ :
Support/Resistance Levels :
22979
23030
23242(23374)
23526
23997
24385
24586
24648
24945
🗝️🗝️🗝️Level: 23526-23620
HSI continues its Bullish mode.
W Chart:-
17Mar2025 -
24Mar2025 -
📰 another -ve news, but this might be distraction. 🚨
www.tradingview.com
Shares in Hong Kong slumped 487 points or 2.0% to 23,417 on Tuesday morning, reversing gains from the prior session amid concerns over U.S. recession risks and China’s deflation threat.
www.tradingview.com
** Hong Kong's benchmark Hang Seng Index declined 2.2%, and the Hang Seng Tech Index
HSTECH lost 3.5%.
For current markets condition, the CHN & HKG can be volatile with the continuing noise from tariff.
🎯 Reminder: For long term (6-18 months) continue to accumulate China & HKG for the potential upside for the year! All retracement is a good entry point.
🔎 DYODD and don't listen to anyone. Invest in yourself, do some study and learn along the way while you trying to verify or finding the answer if to start invest in CHN/HKG markets. If you don't know how or where, you may ask Deepseek/Chatgpt for most reputable Trading courses nearest to you.
Let's follow our own strategy and zen with 📙 and 🍵 for profits.
** Please Boost 🚀/LIKE 👍, FOLLOW ✅, SHARE 🙌 and COMMENT ✍ if you enjoy this idea! Share your trading journey to encourage the trading buddies.
