WEEKLY reaction to these zones Looking for the weekly order block fvg and LTF BREAKER to make an effort down….hopefully because this week has been bullish non stop
NAS100USD trade ideas

X2: NQ/US100/NAS100 Short - Day Trades 1:2X2:
Risking 1% to make 2%
NAS100, US100, NQ, NASDAQ Short for day trade, with my back testing of this strategy, it hits multiple possible take profits, manage your position accordingly.
Risking 1% to make 2%
Use proper risk management
Looks like good trade.
Lets monitor.
Use proper risk management.
Disclaimer: only idea, not advice

"Just another day at the office." Price"You won't have to look far..."
Sit back and wait for the market to show its hand at key levels and AOI.

NASDAQ (US100) still bullish?US100: this one is only breaking new highs, no sign of a reversal, so still very bullish in my view...

Price Outcomes"This Is For The Record"
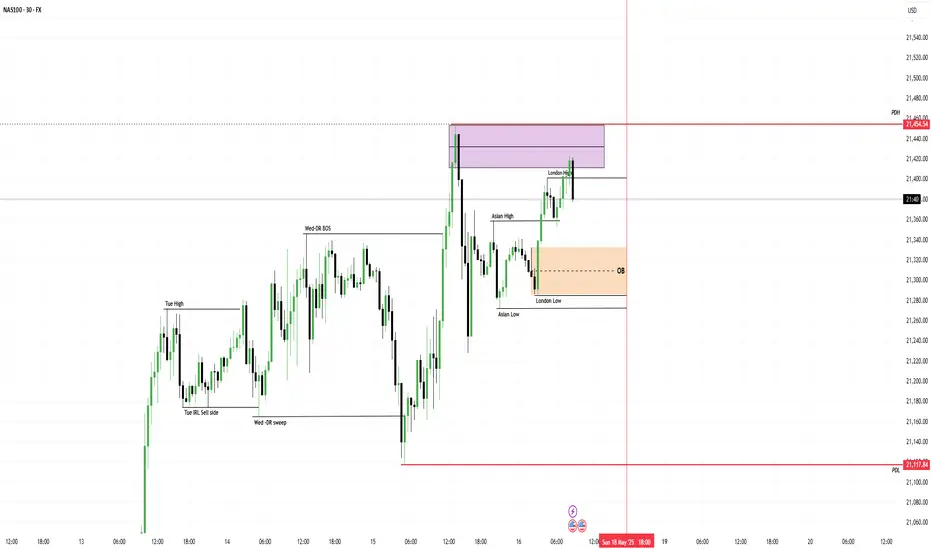
Dealing Range(DR) -Previous day High and Low
Seeing that Wednesday sell side liquidity DR swept by Thursday London sweep.
To confirm Thursday sweep, Wednesday high broken by Thursday
Price retraced 61% of Thursday DR to AOI-"iFVG" as support to go higher
Today London open showed support to Asia Low displacing to Asia high and breaking through it
Clear 1hr OB left in London session for NY to retrace and balance price
Now that NY opened and went higher we can still be open to PDH challenged as no Session lows or major key levels PDH-PDL broken
If still bullish price will have to break PDH and sweep internal liquidity lows
If bearish previous day high- PDH to be sweep area of interest AOI in NY and show clear bearish rejection,
NY now at 30min order block -OB in premium area of dealing range-DR, if there is rejection to the OB, Price must displace NY low and respect any form of resistance made to the NY low eg. FVG or OB
I wont participate in sell unless previous day low displaced.
Sit back and wait for the market to show its hand at key levels and AOI.
Bravo Six. Badged member of the SAS. Task Force QT17
NSDQ100 INTRADAY uptrend continuationTrade Tensions – Trump’s Tariff Plans
Donald Trump said he will set new tariff rates on trading partners within the next 2–3 weeks. China tariffs may remain at 30% through late 2025, according to a Bloomberg survey.
Relevance:
Renewed tariff threats could pressure Nasdaq 100 names with global exposure, especially semiconductors and large-cap tech (e.g., Apple, Nvidia).
Heightened inflation and supply chain risks may weigh on broader risk sentiment.
Geopolitical Risks – Russia, Middle East
Trump is open to meeting Vladimir Putin, though peace talks in Istanbul remain unproductive. Meanwhile, he returns from the Middle East with $200 billion in UAE investment deals.
Relevance:
Limited direct impact on Nasdaq 100, but reinforces broader geopolitical uncertainty, which may influence market volatility and global risk appetite.
Meta Under Pressure – Competition and Regulation
ByteDance, owner of TikTok, is reportedly on track to match Meta’s revenue this year. Meta shares fell on reports of delayed AI development and increasing EU regulatory pressure around user age restrictions.
Relevance:
Meta (META) faces increasing headwinds from both competition and regulation.
Sentiment could spill into other ad-driven or AI-exposed Nasdaq 100 names.
xAI Controversy – Grok AI Glitch
Elon Musk’s xAI chatbot Grok posted controversial content due to unauthorized system tampering. The company has since corrected the issue.
Relevance:
Raises concerns about oversight and content control in the AI space.
May indirectly affect sentiment around AI-related names in the Nasdaq 100, including Tesla and other emerging AI platforms.
Conclusion – Nasdaq 100 Implications
Caution warranted around large-cap tech, especially Meta and AI-focused companies.
Trade war rhetoric and geopolitical risk could add volatility to the broader index.
Watch for market reactions to tariff announcements, regulatory headlines, and key AI developments.
Key Support and Resistance Levels
Resistance Level 1: 21540
Resistance Level 2: 21710
Resistance Level 3: 21900
Support Level 1: 20890
Support Level 2: 20730
Support Level 3: 20600
This communication is for informational purposes only and should not be viewed as any form of recommendation as to a particular course of action or as investment advice. It is not intended as an offer or solicitation for the purchase or sale of any financial instrument or as an official confirmation of any transaction. Opinions, estimates and assumptions expressed herein are made as of the date of this communication and are subject to change without notice. This communication has been prepared based upon information, including market prices, data and other information, believed to be reliable; however, Trade Nation does not warrant its completeness or accuracy. All market prices and market data contained in or attached to this communication are indicative and subject to change without notice.

NASDAQ100 (US100) Testing Key Supply Zone – Big Move Loading?The NASDAQ100 (US100) is currently testing a major supply zone around 21,380 – 21,400, marked clearly by repeated price rejection and visible range resistance from LuxAlgo’s Supply & Demand indicator.
After a strong bullish move from the 20,688.51 demand zone, price is consolidating just below resistance, forming what looks like a potential distribution range. If bulls fail to break this level cleanly, we could see a sharp drop toward the next key supports:
First target: 21,044.29 (Minor support / previous resistance)
Second target: 20,688.51 (Major demand zone, confirmed by volume)
Why this setup matters:
The supply zone has already rejected price multiple times – showing seller strength.
RSI is flattening out, showing momentum loss.
U.S. economic events are coming up (marked on the chart) – these could trigger volatility and confirm direction.
Trading Plan:
Watch for a clean rejection or breakout from the blue zone.
A confirmed rejection + bearish candle pattern = short entry with stops above the zone.
A breakout with volume = bullish continuation above 21,400.
Comment below:
Are you buying the breakout or selling the rejection?
Follow for more clean NASDAQ setups every week!
#US100 #NASDAQ #TradingSetup #SupplyAndDemand #LuxAlgo #PriceAction #TechnicalAnalysis #DayTrading #Forex #Indices #RejectionTrade #Breakout

Nas100 Minor Sell viewI would appreciate if we sold just now. so we can buy later during New York open.

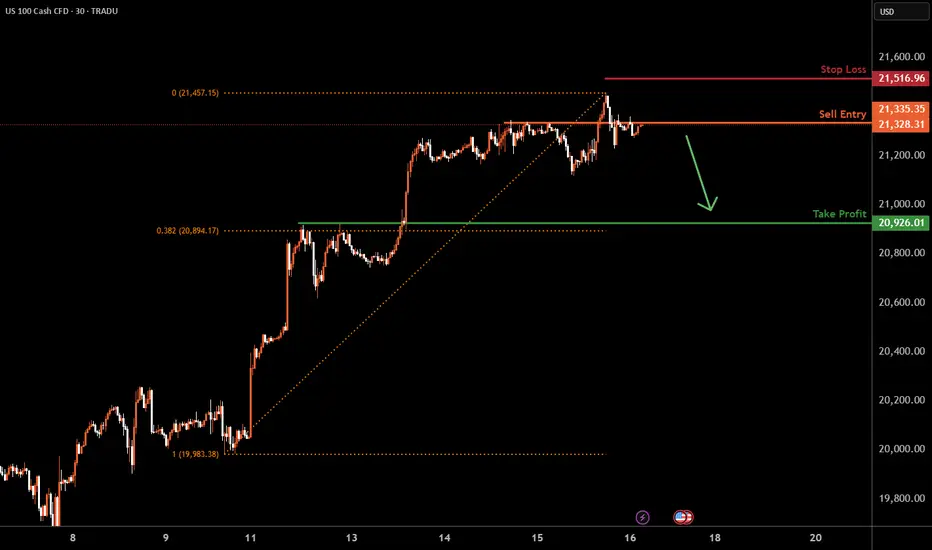
NAS100 I Bearish Drop Based on the H4 chart analysis, we can see that the price is testing our sell entry at 21,335.35, an overlap resistance.
Our take profit will be at 20,926.01, a pullback support that aligns close to the 38.2% Fibo retracement
The stop loss will be placed at 21,516.96, above the swing-high resistance.
High Risk Investment Warning
Trading Forex/CFDs on margin carries a high level of risk and may not be suitable for all investors. Leverage can work against you.
Stratos Markets Limited (tradu.com):
CFDs are complex instruments and come with a high risk of losing money rapidly due to leverage. 63% of retail investor accounts lose money when trading CFDs with this provider. You should consider whether you understand how CFDs work and whether you can afford to take the high risk of losing your money.
Stratos Europe Ltd (tradu.com):
CFDs are complex instruments and come with a high risk of losing money rapidly due to leverage. 63% of retail investor accounts lose money when trading CFDs with this provider. You should consider whether you understand how CFDs work and whether you can afford to take the high risk of losing your money.
Stratos Global LLC (tradu.com):
Losses can exceed deposits.
Please be advised that the information presented on TradingView is provided to Tradu (‘Company’, ‘we’) by a third-party provider (‘TFA Global Pte Ltd’). Please be reminded that you are solely responsible for the trading decisions on your account. There is a very high degree of risk involved in trading. Any information and/or content is intended entirely for research, educational and informational purposes only and does not constitute investment or consultation advice or investment strategy. The information is not tailored to the investment needs of any specific person and therefore does not involve a consideration of any of the investment objectives, financial situation or needs of any viewer that may receive it. Kindly also note that past performance is not a reliable indicator of future results. Actual results may differ materially from those anticipated in forward-looking or past performance statements. We assume no liability as to the accuracy or completeness of any of the information and/or content provided herein and the Company cannot be held responsible for any omission, mistake nor for any loss or damage including without limitation to any loss of profit which may arise from reliance on any information supplied by TFA Global Pte Ltd.
The speaker(s) is neither an employee, agent nor representative of Tradu and is therefore acting independently. The opinions given are their own, constitute general market commentary, and do not constitute the opinion or advice of Tradu or any form of personal or investment advice. Tradu neither endorses nor guarantees offerings of third-party speakers, nor is Tradu responsible for the content, veracity or opinions of third-party speakers, presenters or participants.
NASDAQ Potential Bullish Reversal OpportunityNASDAQ price action went through a massive correction during the global tariff war.
However after potential recent developments, we may finally see a direction towards the resolution of widespread tariff based uncertainty across the macro economic landscape.
This presents us with a potential Reversal opportunity if we see the formation of a credible Higher High (given a potential proper break out) on the Daily and shorter timeframes.
Trade Plan :
Entry @ 20440
Stop Loss @ 19500
TP 1 @ 21380

The NDX knows what it has to doAs you can see, breaking above the red line would be crucial for the NDX. If that happens, the blue line is next. It's only a matter of time, imo.
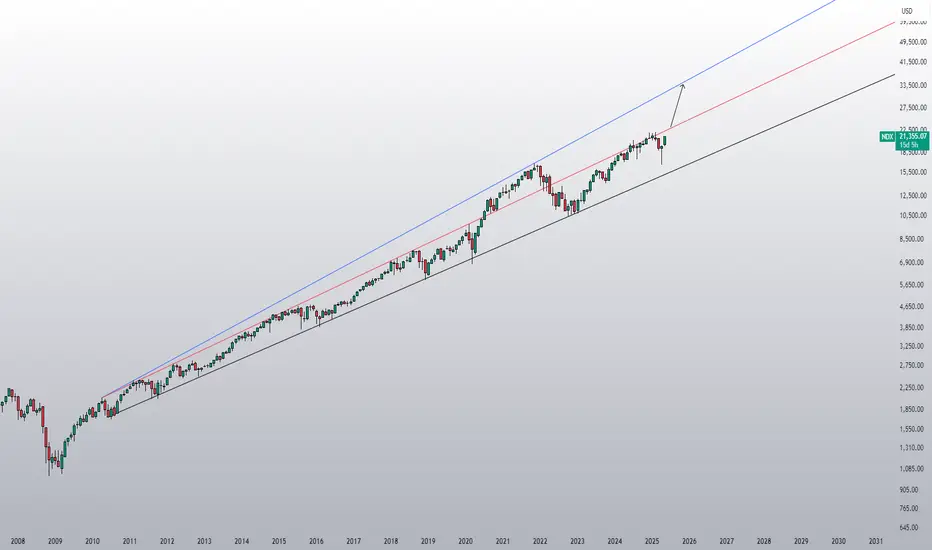
If the red line breaks during a Nasdaq meltdown…If the red line breaks during a Nasdaq meltdown…
Game over.
Gold wins.

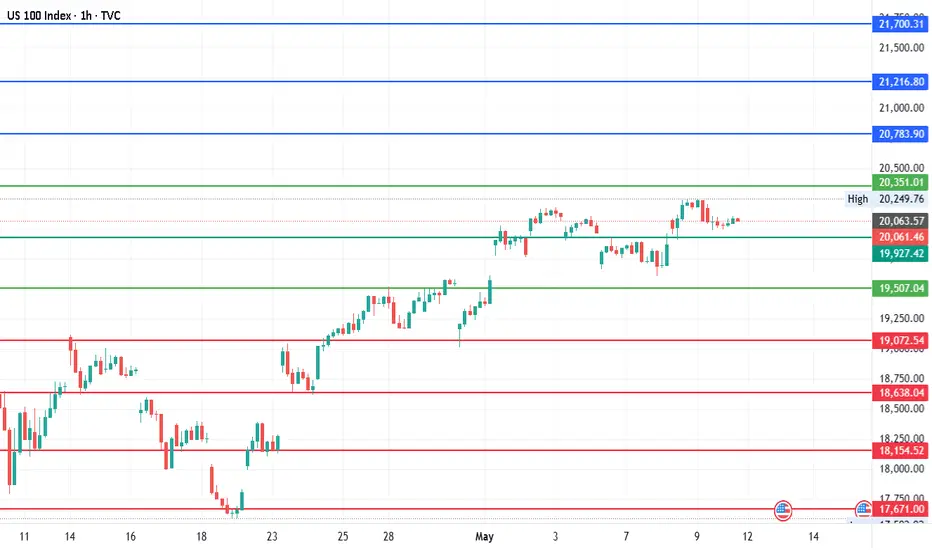
#NDQ - What does these lines say? Do they work?Hey, hope you are all doing great!
I strongly believe that you are looking at these charts to your advantage. Are the lines marked in these charts make any sense? Do these lines really work? check out these charts at a lower time frames and see. Since these are directionless, how to read?
Current Price: 20061.45
Mid-line: 19927.42
Upside: 20783.90, 21216.80, 21700.31 and 22183.83
Downside: 19072.54, 18638.04, 18154.52 and 17671.00
#NDQ

SHORT NAS100Updated Market Read on NAS100 Footprint
🟠 1. Trend & Price Action:
The overall short-term structure remains bearish.
The rally seen around 07:00–08:00 AM failed to hold above 21,220 and got rejected quickly.
Price has rotated back below the 21,200 key level and is currently printing at 21,194.5, below the VWAP-style center line.
🔴 2. Delta & Volume Shifts:
Look at 06:30–07:00 AM:
Strong positive delta: +290 with 11.51K total volume → Buyers were active.
However, the next few candles (07:00–08:00) show delta flipping negative again (-303) despite decent volume (13.49K).
This indicates buying effort was absorbed, and sellers regained control.
📉 3. Sell Imbalances Reappear:
From 07:30 onward, you see clear sell imbalances (left-side red/black clusters) starting to stack again.
Especially at the top of candles — typical of aggressive selling into buyer attempts.
🧊 4. Absorption Failed at Resistance:
The previous support zone at 21,220–21,240 is now acting as resistance.
Price was rejected right at this level, with sellers stepping in forcefully.
✅ Current Bias: Bearish Continuation
Key Supporting Evidence:
Failure to hold above 21,220 resistance.
Return of negative delta dominance.
Rejection after attempted bullish response (failed absorption).
Sell imbalances resuming into highs.
⚠️ Levels to Watch:
Support: 21,140 – held earlier and could still see responsive buyers.
Breakdown Level: If 21,140 breaks on heavy sell delta, next move could extend lower.
Resistance: 21,220–21,240 – current supply zone.
🔁 Trade Implication:
Short bias below 21,200, targeting 21,160 → 21,140.
Invalidate if price closes above 21,240 on strong positive delta and imbalance flip.

NAS100 | Footprint Chart UpdateKey Developments:
Price just closed above the 21,200 key level with a modest bullish footprint.
Positive delta (+18) with relatively light total volume (~110 contracts) suggests controlled buying rather than aggressive initiative buyers.
Buyers successfully absorbed the heavy selling pressure from the previous candle (delta -293) and pushed price higher — a short-term bullish signal.
📊 What This Means:
The market is showing signs of potential reversal after holding 21,160 and reclaiming 21,200.
If buyers can maintain strength above 21,200, we may see a move toward the 21,240–21,260 resistance zone.
Watch for increased buy imbalances and stronger delta on the next candles to confirm follow-through.
⚠️ Caution:
A failure to hold 21,200 and a drop back below it could signal a bull trap, leading to a re-test of 21,160 or even 21,120.
📍Levels to Watch:
Support: 21,200 → 21,160 → 21,120
Resistance: 21,240 → 21,260 → 21,300
🧩 Current Bias: Cautiously Bullish – Awaiting confirmation from next candle’s order flow.
📌 Stay disciplined. React, don’t predict.
