UK100UK100, the price is in the strong resistance zone 7880, expect the price to drop, sell the red zone, the first target is 7663.4,
if the price breaks through. Next targets 7545 and 7393.6 >> GooD Luck 😊
UK100GBP trade ideas

fste 100 weekly 5th wave Ending So this is the weekly of the ftse 100 and I have posted the monthly today as well . The end not the beginning Best of Trades Wavetimer

FTSE HIT A NEW ALLTIME HIGH DEGATIVE/ RSI The chart posted and the labeling on it has not changed since I wrote and posted it back in dec 2021 .What comes next in 5 TH WAVE DIAGONAL IS NOT GOOD AT ALL BEST OF TRADES WAVETIMER

UKX to 9090?FTSE100 (UK100, UK stocks index) been laggard for many years in comparison with many of it's peers. Now it seems the UKX will finally make new all-time high🍾 and will go even higher. I think we are in continuation move up after breaking out of the consolidation in form of triangle. Target @ 9090 being measured move - height of the triangle projected from midpoint of local range. Invalidation would be the local range low @ 4791 which is too far away meaning unfavourable reward risk ratio but this idea is rather about directional bias. Bear in mind this is monthly chart so the move will not happen over night obviously.
Check my other stuff in related ideas.
Please boost🚀, comment🗣️, follow me✒️, enjoy📺!
⚠️Disclaimer: I'm not financial advisor. This is not a financial advice. Do your own due dilingence.

UK100The majority of traders have been short on this market since the3rd of November and currently 92% of traders are selling. In combination with the price moving upwards, this creates a bullish indicator. We can see how they get it wrong all the time, This market is very aggressively heading higher. A pullback would be welcome

Uk100Reason for taking this trade
- overall bullish trend
- daily resistance broken and turned support
- 38.2% and 50.0% fib confluence

SHORT FTSE100/ UK100: WEAK INFLATION & RECESSION TRADEValue/ uk100 been over pumped only 4% off ATHs.
commods have pumped it higher, global recession will SMOKE this.
also any continued weak inflation = growth trade back on = ppl dont want value = uk100 dump.
SHORT: TP -20% SL 8000 (multiple closes above) 4/1RR worst case.
7640
7700
7800
7900

Elliott Wave Suggests FTSE Should Extend HigherFTSE shows an incomplete bullish sequence from 10.13.2022 low favoring further upside. Up from 10.13.2022 low, rally is unfolding as a 5 waves impulse Elliott Wave structure. Wave (1) ended at 7599.7 and dips in wave (2) ended at 7303.68 as the 1 hour chart below shows. Wave (3) higher is in progress with internal subdivision as another 5 waves in lesser degree. Up from wave (2), wave (i) ended at 7389.92 and wave (ii) ended at 7366.88. Wave (iii) higher ended at 7540.31 and pullback in wave (iv) ended at 7462.80. Final leg wave (v) ended at 7547 and this completed wave ((i)). Pullback in wave ((ii)) ended at 7434.64.
Up from there, wave (i) ended at 7516.36 and pullback in wave (ii) ended at 7448.69. Index then rallies higher in wave (iii) towards 7772.37 and wave (iv) is either completed or expected to complete soon. Index should rally higher 1 more leg to end wave (v) and this should complete wave ((iii)) in higher degree. Afterwards, expect a pullback in wave ((iv)) to correct cycle from 12.29.2022 low before the rally resumes. As far as pivot at 7303.68 low stays intact, expect pullback to find support in 3, 7, or 11 swing for further upside.

FTSE 100 rockets to 1 year high! Will it reach 8,000?Today, London's stock market is experiencing a bonanza, as the FTSE 100, which is the index that includes the 100 most prestigious and well capitalized blue-chip companies which are listed on the London Stock Exchange, has rocketed to an astronomic 7,741 points.
This represents the highest level that it has reached in over one year, by quite some margin.
In fact, today's lofty value demonstrates a level that the FTSE 100 index did not even come close to during the entirety of 2022.
It was only a year and a half ago that the news channels were awash with sensationalism as the FTSE 100 index broke past the 7,000 mark, and now, at over 7,740, it is heading for the 8,000 mark!
There has been tremendous volatility within corporate stocks over the past two years, especially within the indices because these contain a range of different companies in different sectors, and whilst in 2020 and 2021 the big pharmaceuticals boomed, the travel and hospitality industries paid a large price for draconian lockdowns.
Equally, traditional goods manufacturers had their fortunes hampered by logistical problems which meant getting materials and goods from suppliers was difficult enough to cause them to be unable to deliver enough goods to meet orders. House builders did well because of the short-term break in stamp duty resulting in investors buying up smaller value properties, however the reintroduction of that plus rising interest rates curtailed that boom swiftly.
In 2022, it was all about energy companies and 'big oil', which boomed as the supply could not meet the demand, whereas some tech stocks and airline stocks languished.
Some analysts are saying that today's FTSE 100 high value, which comes after a continued upward direction since the beginning of this year, has been helped by seasonal retail buying as JD Sports and Sainsbury's made bumper profits.
JD Sports, one of Britain's largest national chains of sportswear, reported revenues growth for the 22 weeks to 31 December of more than 10%, which compared with growth of 5% over the first half of its financial year.
Sainsbury’s, one of the UK's largest supermarket chains stated that trading in general merchandise had been stronger than expected, with overall like-for-like sales growth of 5.9% in the 16 weeks to 7 January reflecting inflation and “relatively resilient” volume trends.
There is certainly a lot of volatility in the blue-chip stocks, which is a relatively new dynamic as such large firms which go to make up indices such as the FTSE 100 are traditionally very slow movers in terms of stock value, largely due to their conservative positions and need to please long-term shareholders.

UKX - Neckline BO analysisComment :
1) UK100 has fell below Neckline A and closed the week at 7018.61. Although UK100 has BO the neckline for several times before, but those one still able to close above the neckline. Unless UK100 could rebound to above Neckline A, else it would face another round of downturn below the neckline.
Support & Resistance :
R : 6355 +/-
DISCLAIMER :
Analysis above SOLELY for case study purpose, not a PROFESSIONAL ADVISE. This analysis does not provide any trading advise and buy or sell. Trade at your own risk. Trade only after you have acknowledged and accepted the risks involved.

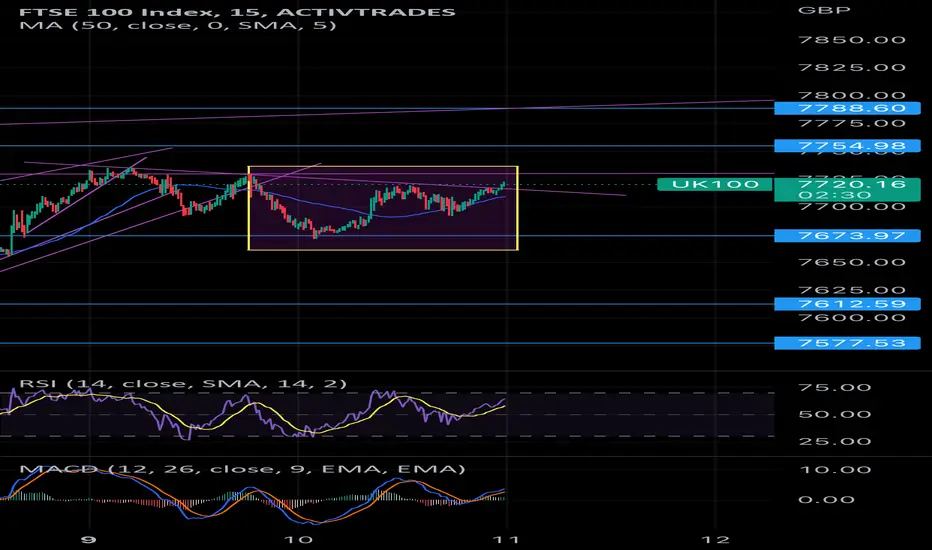
FTSE 100 Cup & Handle at 15 min timeframe?FTSE 100 has recently experienced golden cross on 1-day charts. Resistance in 7600s was surprisingly easily bypassed Friday / Monday, and 7700+ was comfortably reached again post uneventful JP speech. Is this a bullish cup & handle on 15 minute, suggesting push towards 7800? Or will the FTSE face trouble with upcoming earnings this week, given last nights data outline sales haven’t outstripped inflation. Technicals and fundamentals appear divergent, as do RSI / price. Extensive resistance exists ~7775-7800, and above too where ATH sits. Is a turnaround nigh, or a new ATH. Thoughts?
Bullish patternHere we have cup and handle pattern with breakout with momemtum candle...a bullish candle in daily and weekly period.

UK100 ?
Before we put in a trade/ticket.
Does it make sense ?
Why would it rebound here ?
Why this price is have got any value ?
I mean; pause a while.
It's slow but make it worth the effort.
Again ; not your guru.
All the best

UK 100 INDEXIt seems FTSE has passed the important level and it's time to find good opportunities among London stocks for buying.

SHORT IDEA FOR UK100We have been hovering close to all time highs. This is the 1-5 structure of EW, with a corrective ABC to below 6700 GZ marked on the chart.
Alternative could be extension of the last V. wave above 8100 (unlikely).
Look for shorts at:
-CMP
-7820
-7908 as the top.
Goodluck.

UK100 ?
Now we are at a junction. North or South.
Any currently at multi month highs.
In the scenario.
>> What's the sentiment at ground level ?
You'll have to dig some info: find out more in local papers.
The answers not gonna come up straight forward. Once you get in touch with this knowledge.
It will build up for the trade.
Buy or sell only within 20% of range. If it moves away, stop.
If price moved 60% and leaves you with 40% margin. That's not gonna be smart.
That's is smart-ass.. hehe
All the best
I'm not your guru, but I hope it made sense.
