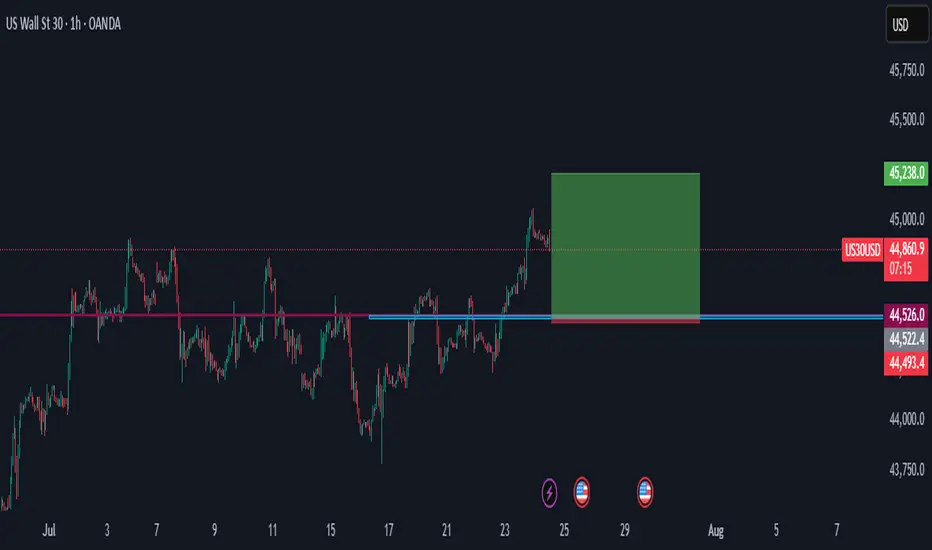
US30 LONG US30 has recently broken out of a multi-session consolidation range and tapped into the 45,000 psychological resistance zone, forming a temporary high around 44,950. With this in mind, I’m seeing two opportunities based on the market structure:
Short-Term Sell Setup
Bias: Counter-trend (retracement)
Entry Zone: 44,850 – 44,950 (rejection at resistance / liquidity grab)
Target Zone:
TP1: 44,400
TP2: 43,950
Stop Loss: Above 45,050
Reason: Price is overextended; likely to pull back before continuing uptrend. This is a scalper/intraday short opportunity.
Long-Term Buy Setup
Bias: Trend continuation
Ideal Buy Zones (Fibonacci):
Zone 1: 44,400 (23.6%)
Zone 2: 43,775 – 43,550
Stop Loss: Below 43,400
Targets:
TP1: 45,250
TP2: 45,750
Reason: Market is in a bullish structure. A pullback to golden ratio (50%–61.8%) offers an ideal entry for a swing continuation. Watch for bullish confirmation at these zones.
US30USD trade ideas
US30 - LONGPrice has reached a key level after yesterday's push back down. Had a buyers come into the market this morning at market open before dropping once again. Expecting buyers to take back control and retest previous highs.
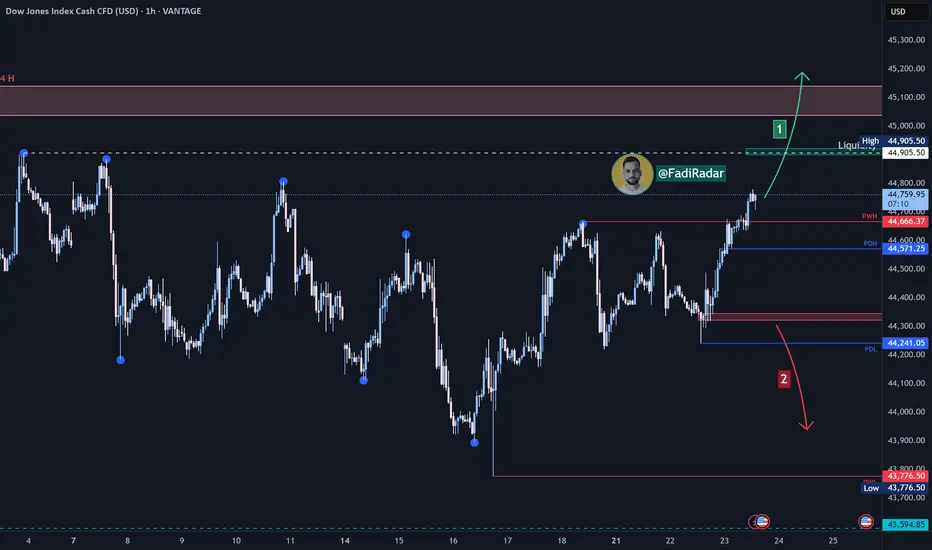
Dow Jones Index US30 Analysis:🔹 The index is approaching a key liquidity zone near 44,905 USD.
1️⃣ If price breaks and closes above 44,905, this could trigger a bullish continuation toward 45,100 USD.
2️⃣ However, if the price fails to break above and bearish momentum appears, a pullback is expected to test 44,570 and 44,320.
🔻 A confirmed break and close below 44,320 could resume the bearish trend and open the way toward 43,900 USD.
⚠️ Disclaimer:
This analysis is not financial advice. Please monitor the markets carefully before making any investment decisions.
US30 Update – 07/23/2025📍 US30 Update – 07/23/2025
The bulls are back in control 🚀
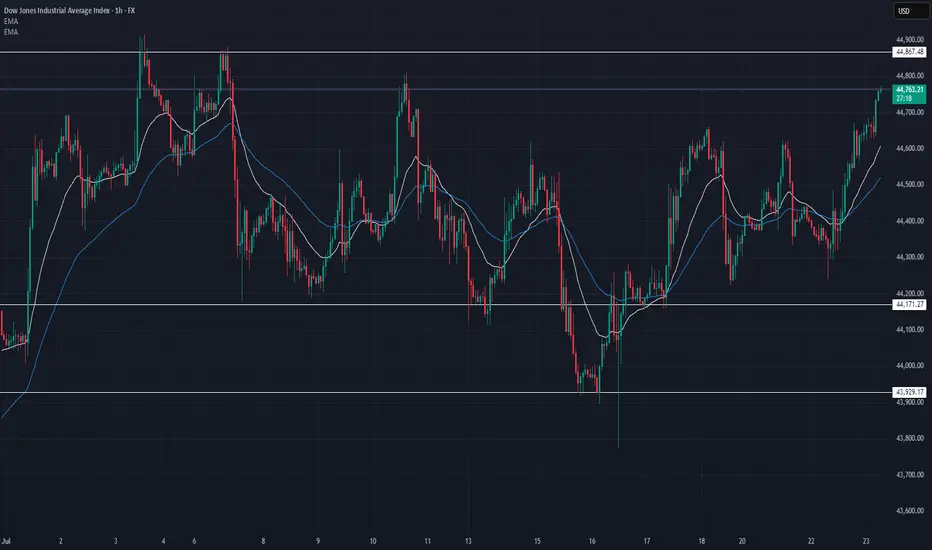
After consolidating below 44,450, we finally saw a strong breakout above the mid-range and EMAs. Price surged straight into the 44,760–44,867 resistance zone with strength, riding the 9/21 EMA crossover 🟢
We're now testing a major supply zone, so momentum traders should watch for a reaction here.
📊 Market Structure:
✅ Clean higher lows
✅ Breakout above 44,600 resistance
✅ EMAs aligned bullish on 1H
✅ Bullish engulfing + follow-through
🔑 Key Levels:
🔼 Resistance: 44,764 → 44,867
🔽 Support: 44,450 → 44,171
🧠 Market Bias:
Short-term bullish ✅
➡️ Holding above 44,600 = bullish continuation
➡️ Rejection at 44,867 = possible pullback/retest
💡 Trade Scenarios:
📈 Breakout Continuation (Aggressive Long):
Entry: Above 44,780
TP1: 44,867
TP2: 44,950
SL: Below 44,700
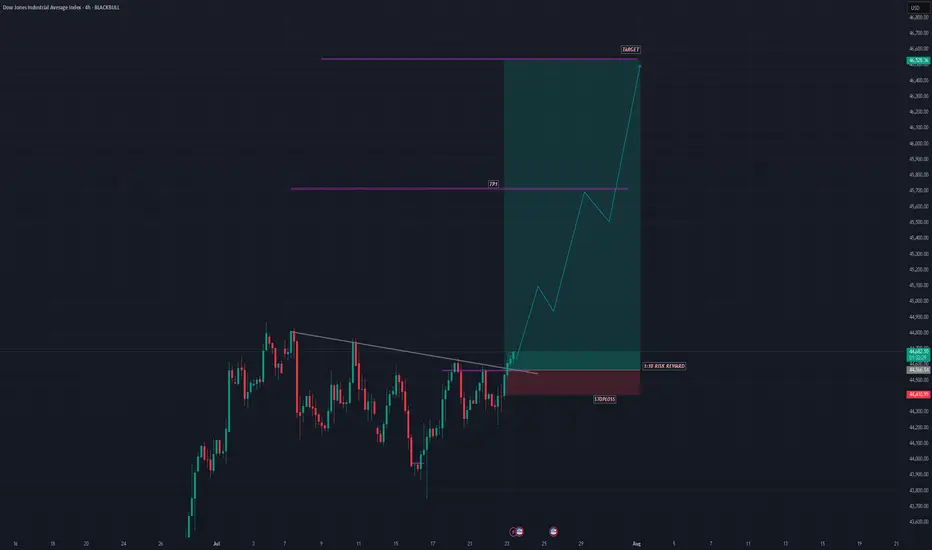
US30 SHOWING A GOOD UPWARD MOVE WITH 1:10 RISK REWARDUS30 SHOWING A GOOD UPWARD MOVE WITH 1:10 RISK REWARD
DUE TO THESE REASON
A. its following a rectangle pattern that stocked the market
which preventing the market to move any one direction now it trying to break the strong resistant lable
B. after the break of this rectangle it will boost the market potential for break
C. also its resisting from a strong neckline the neckline also got weeker ald the price is ready to break in the outer region
all of these reason are indicating the same thing its ready for breakout BREAKOUT trading are follows good risk reward
please dont use more than one percentage of your capital follow risk reward and tradeing rules
that will help you to to become a better trader
thank you
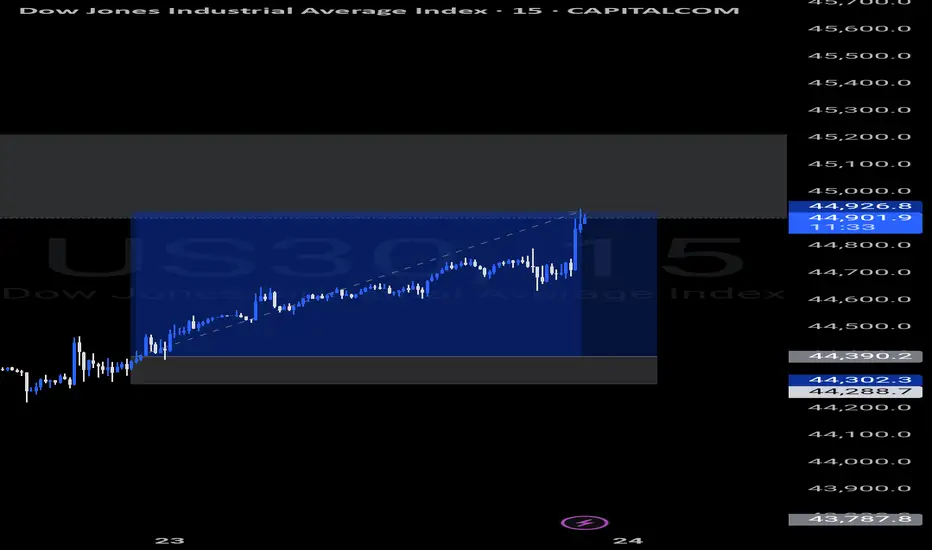
US30 BUYS!!!I see price creating a 4hr bullish structure to take price towards those equal highs because Equal Highs is a magnet for priice.

07/22 Trade for US30The variation was tricky so i had to take my patience and set the stop loss with the low of the candle bar with volume.
1. Variation(Yellow) : Downtrend losing momentum
2.Wick(Blue): Wick rejecting going down
3. Volume(Red): Wait for momentum to go up

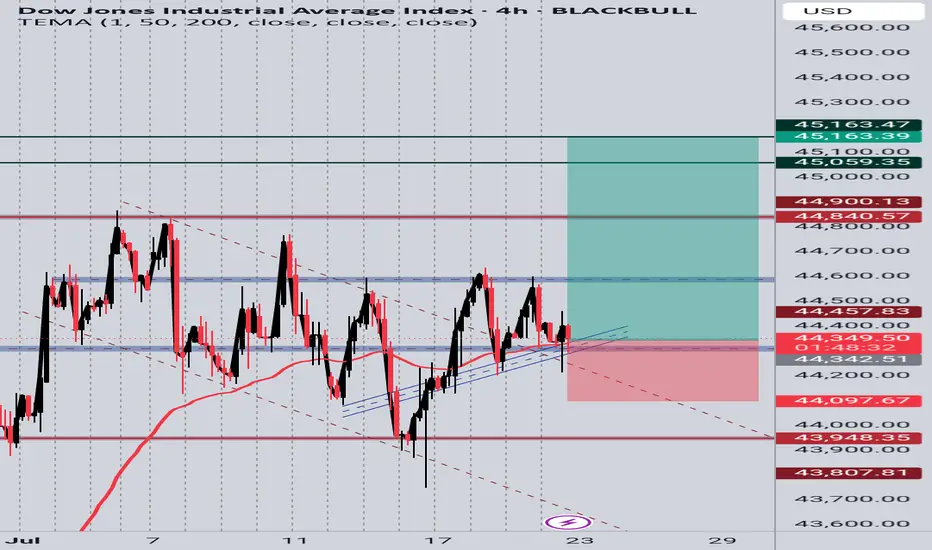
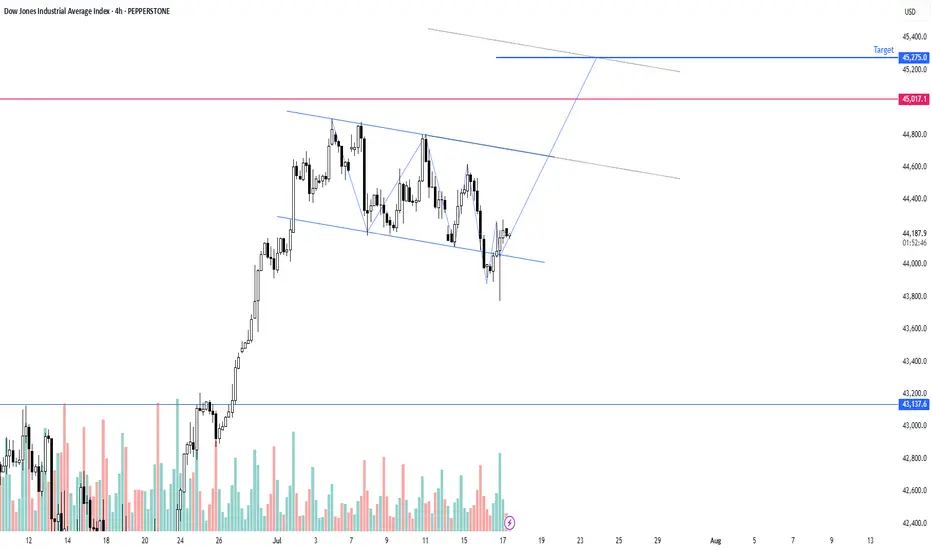
US30 4H Long SetupPrice is respecting a rising trendline and holding above a key support zone. After multiple rejections at the trendline and EMA bounce, current candle shows bullish intent. Targeting previous resistance zones around 45,059 and 45,163. SL placed below the trendline and recent structure low at 44,097. Setup based on structure support, EMA reaction, and potential bullish continuation.
Possibility of uptrend It is expected that the triangle pattern will form according to the specified direction and then we will see the start of the upward trend. If the index breaks through the support area and consolidates, the continuation of the downward trend is likely.

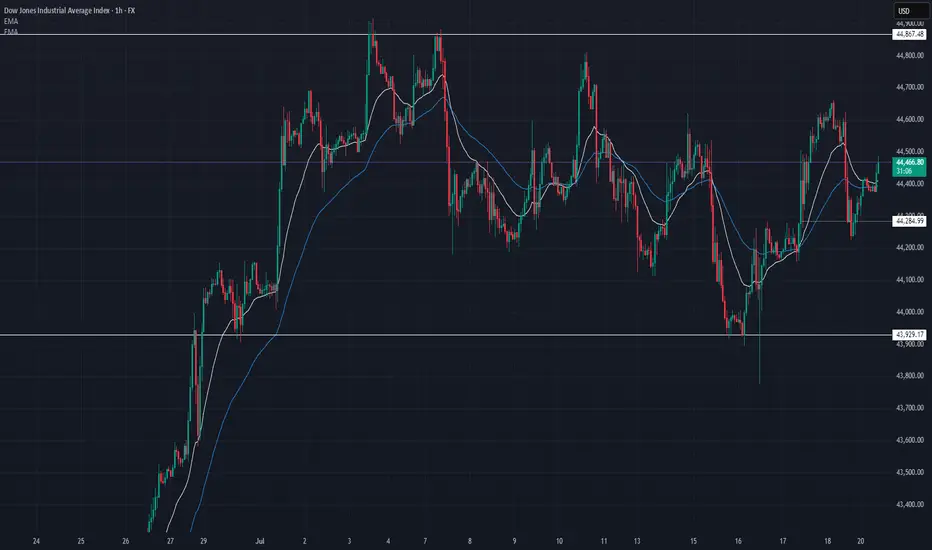
US30 Update – 07/21/2025📍 US30 Update – 07/21/2025
Sideways chop continues on US30 🌀
We’re still range-bound between 44,285 and 44,867, with price currently hovering mid-range around 44,470. Structure remains indecisive — buyers tried to push higher but got faded near the 44,600 level again.
EMA structure is flat on the 1H — confirmation that we’re consolidating.
📊 Market Structure:
🔄 Consolidation Zone: 44,285 → 44,867
📉 Failed to hold above 44,600
📈 Bulls defending 44,285 zone (demand still active)
📊 1H EMAs flat — neutral/slightly bullish
🔑 Key Levels:
🔼 Resistance: 44,600 → 44,867
🔽 Support: 44,285 → 43,929
🧠 Market Bias:
Neutral short term ⚖️
➡️ Clear breakout above 44,867 = trend continuation
⬇️ Breakdown below 44,285 = bearish structure confirmed
💡 Trade Scenarios:
📈 Range Buy (Support Play):
Entry: 44,300–44,285
TP1: 44,500
TP2: 44,700
SL: Below 44,200
📉 Range Sell (Resistance Fade):
Entry: 44,600–44,650
TP1: 44,400
TP2: 44,300
SL: Above 44,700
⚔️ Breakout Setup:
Long above 44,870 (confirmation)
Short below 44,280 with volume
📵 No trade in the middle of the range unless scalp — wait for edges to act.
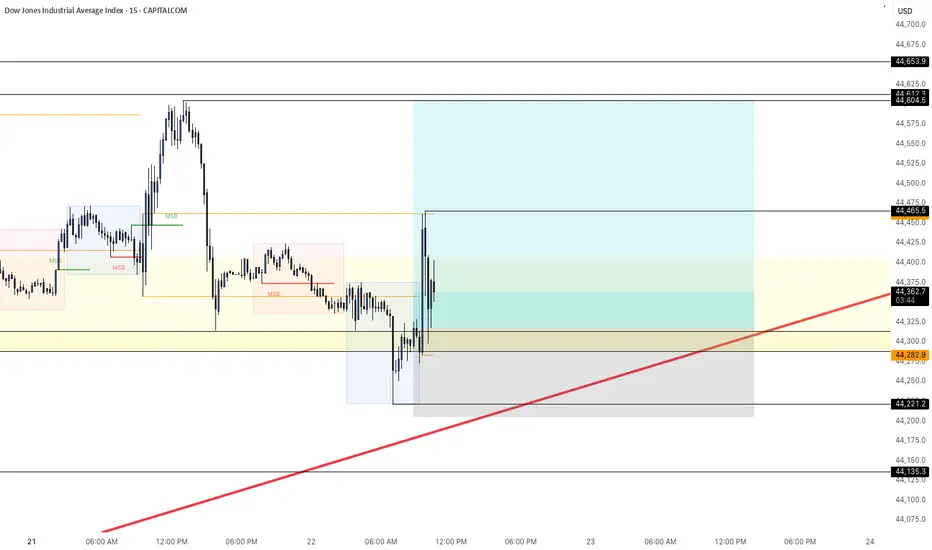
US30: Move Up Expected! Long!
My dear friends,
Today we will analyse US30 together☺️
The price is near a wide key level
and the pair is approaching a significant decision level of 44,325.14 Therefore, a strong bullish reaction here could determine the next move up.We will watch for a confirmation candle, and then target the next key level of 44,425.56.Recommend Stop-loss is beyond the current level.
❤️Sending you lots of Love and Hugs❤️
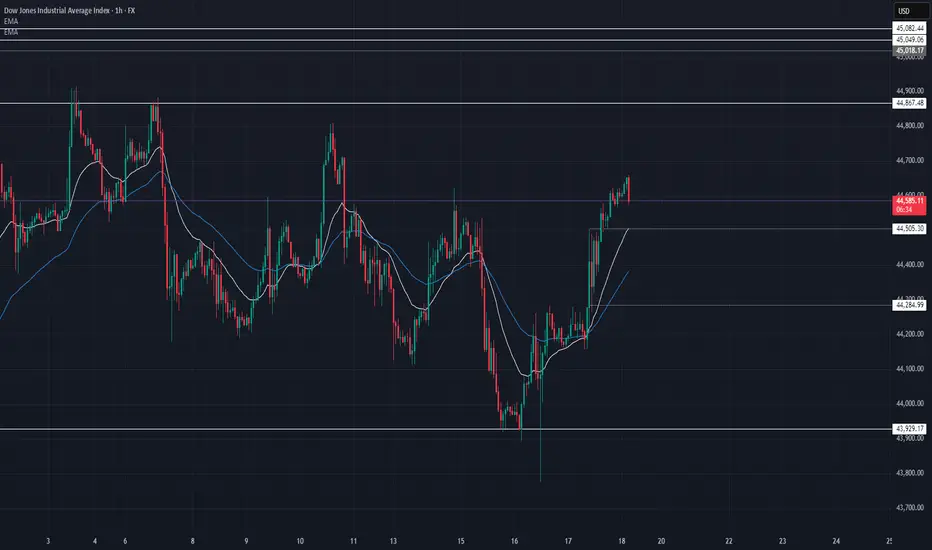
US30 Update – 07/18/2025📍 US30 Update – 07/18/2025
Massive recovery off 43,929 👀
US30 has broken above the 44,500 resistance and is holding strong around 44,590. The EMAs are now sloping bullish on the 1H — this is the first solid bullish structure since the early July top.
If buyers hold above 44,500, we could see a run to retest 44,867, the local high.
📊 Market Structure:
🔄 Bear trend possibly shifting → early signs of reversal
📈 Higher lows forming — EMAs crossed bullish
🔼 Break of 44,505 confirmed strength
🧭 Eyes now on 44,700–44,867 zone
🔑 Key Levels:
🔼 Resistance: 44,700 → 44,867
🔽 Support: 44,505 → 44,285 → 43,929
🧠 Market Bias:
Short-term bullish — but buyers must defend 44,500.
A drop below 44,285 would invalidate this move.
💡 Trade Ideas:
🔼 Long Setup – Continuation:
Entry: Pullback to 44,505–44,530
TP1: 44,700
TP2: 44,850
SL: Below 44,450
🔻 Short Setup – Fade Rejection:
Entry: Rejection at 44,700–44,850
TP1: 44,500
TP2: 44,300
SL: Above 44,900
⚠️ Patience — wait for clean retests or candle rejections at key levels. No need to force entries.
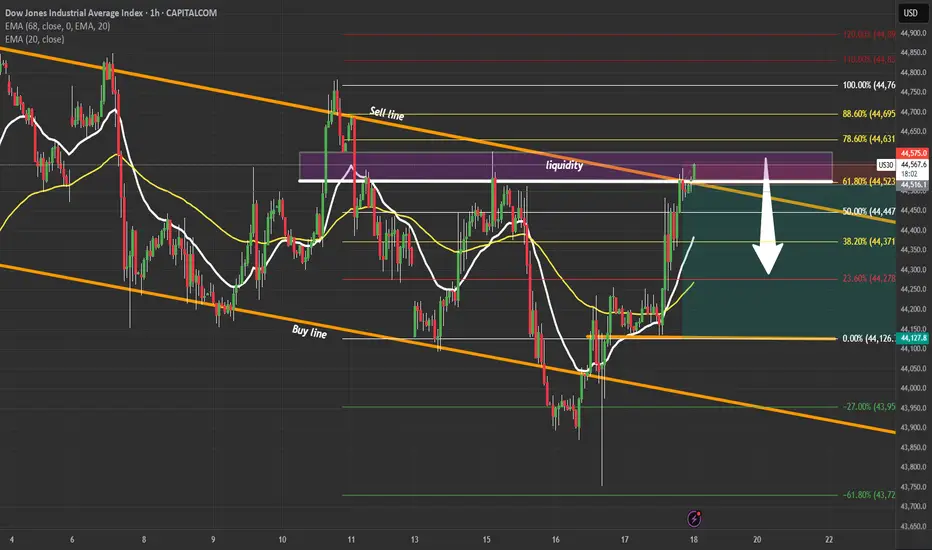
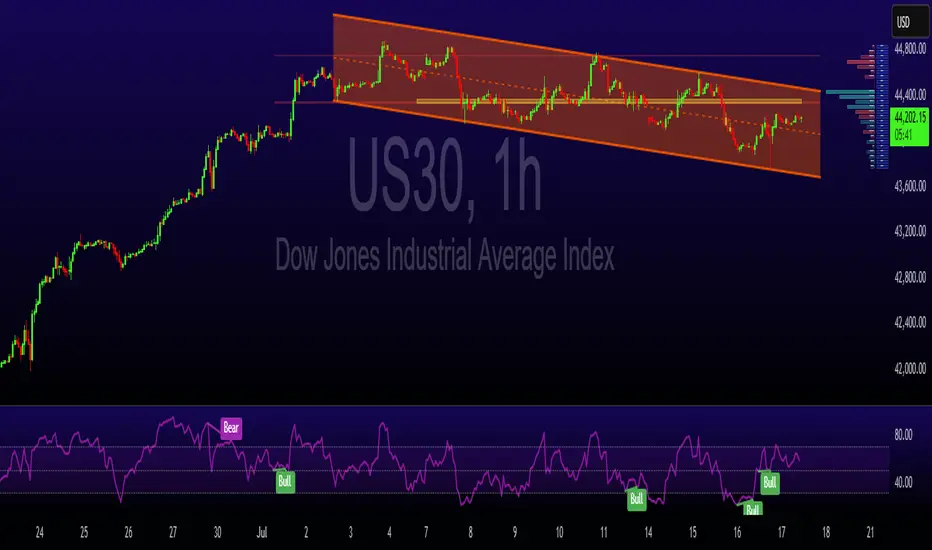
US30 High-Probability Short SetupUS30 | Liquidity Grab at 61.8% Fib 🔍
Price tapped a major liquidity zone inside the descending channel near the 61.8% Fibonacci level.
Plan: Waiting for confirmation to short toward 44,150.
Breakout or rejection? Drop your thoughts below!
Part 2 Overview of Market Week 13-19Thanks for tuning in guys, giving my knowledge to you guys free cause. AU,UJ,EU market overview mixing in a lot of fundamental confirmation.

Sonarlab Sessions: The Best Indicator!!Sonarlab Sessions allows you to edit and craft the different sessions on your chart. Using this tool and indicator allows you to decide what time you would like to get into the market. This allows to frame set ups and rules around that specific session.

Bulls Steady Ahead of Key Earnings and Economic DataU.S. equities are holding steady in what has been a week of conflicting signals. President Trump’s aggressive stance on trade, including potential 30% tariffs on EU and Mexican goods, has shaken market sentiment, but his public commitment to retain Jerome Powell as Fed Chair brought some temporary relief. That stability, at least for now, is helping underpin stock indices.
Focus has now turned to corporate earnings, with key players like TSMC and Netflix reporting shortly. These names could set the tone for the broader Q2 earnings season. At the same time, traders are closely monitoring incoming U.S. data — including retail sales and jobless claims — to gauge the health of the consumer and labor market. The combination of strong earnings and resilient macro data could provide the momentum
Technical Structure:
• Resistance: 44,350 — a potential breakout point
• Support: 44,000 and 43,800
• Pattern: The index is trading within a descending channel, but recent strength suggests a breakout may be developing.
• Upside potential: If earnings and macro data support risk appetite, a breakout toward 44,800 becomes plausible.
Takeaway: Sentiment remains fragile but stable. Traders should keep a close eye on both corporate results and macro data releases for direction cues.
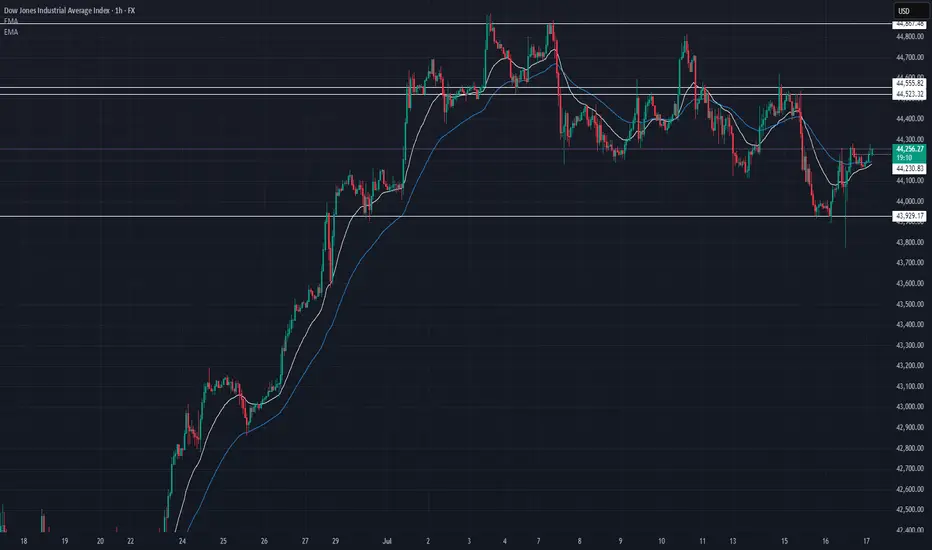
DOW JONES 1H ANALYSIS – JULY 17, 2025📉 DOW JONES 1H ANALYSIS – JULY 17, 2025
🔎 Tracking structure | key levels | trade ideas
🔹 Current Price: 44,248
📆 Timeframe: 1H
📈 Bias: Neutral → Short-term bullish ✅
📌 MARKET STRUCTURE UPDATE:
Price held strong at 43,929 – key support from earlier July lows 🔁
After a deep pullback from 44,800s, we’re seeing a bounce with price reclaiming the 21 & 50 EMA 🧠
This signals short-term buyer momentum stepping in – but caution: we’re still trading below key resistance 👀
🔹 KEY LEVELS TO WATCH:
Support:
🟢 43,929 → major bounce zone (held)
🟢 44,182 → short-term EMA support
Resistance:
🔴 44,523 → former support, now flipped resistance
🔴 44,555 → breakdown origin
🔴 44,857 → major supply zone top
💡 TRADE SCENARIOS:
🔼 Bullish Case:
If price holds above 44,200 and pushes through 44,523–44,555, we likely see 44,700+ retest 🔥
A breakout + hold above 44,555 = trend shift confirmed 📈
🔽 Bearish Case:
If rejection at 44,523/555 holds, watch for rotation back to 44,000 → 43,929
Below 43,929 = possible slide to 43,700–43,600 demand 🚨
US30 in the US stock market will also set a new highUS30 in the US stock market will also set a new high
He is a little slower but will reach the goal
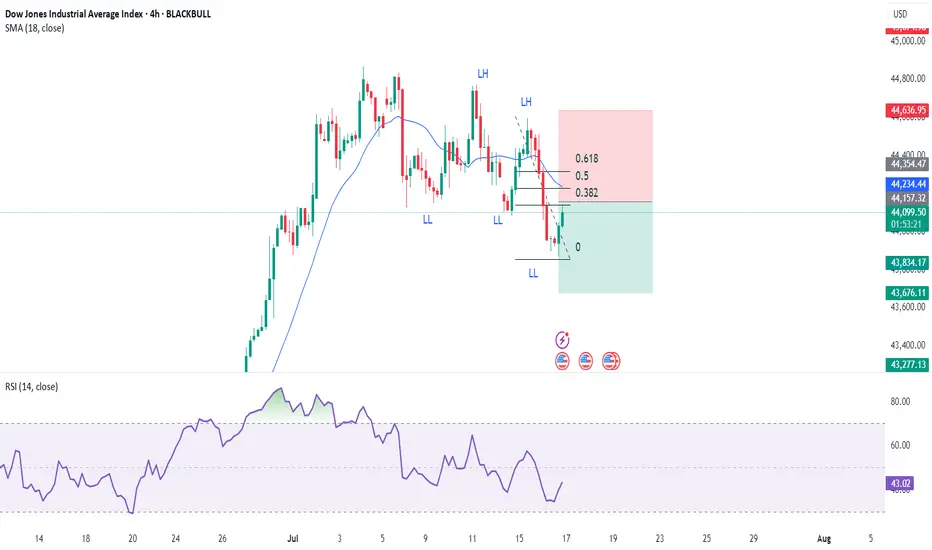
Dow Short IdeaDow jones has started making LL's so it is effectively in a downward trend on 4Hr chart so shorting on pullback to key Fib Retracement levels would be a good idea.
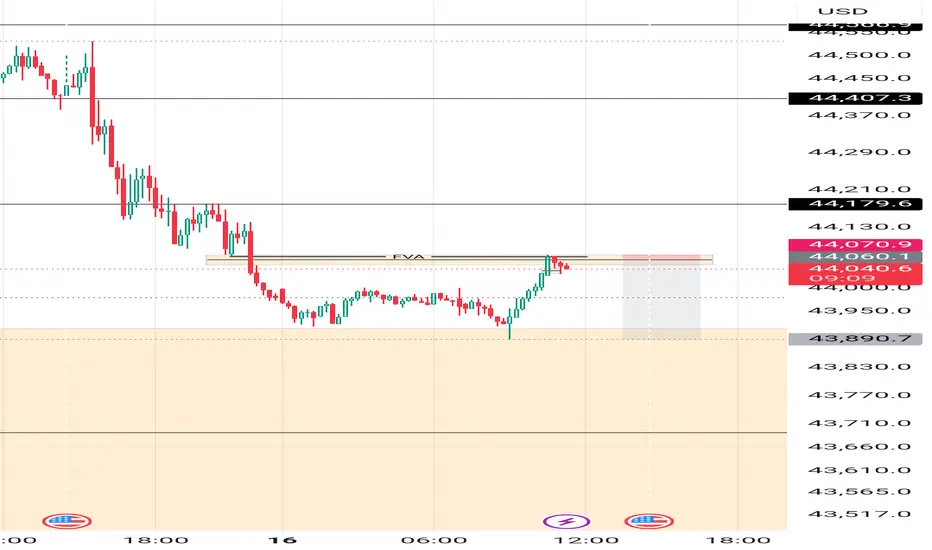

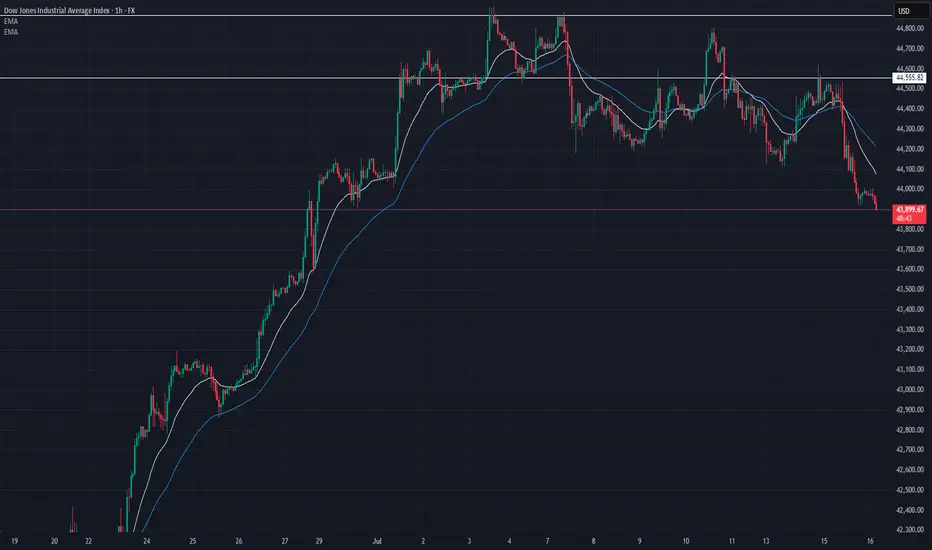
US30 Update – 07/16/2025📍 US30 Update – 07/16/2025
The bearish momentum continues — and it's clean.
After rejecting 44,555–44,600 supply last week, US30 has been in a clear downtrend, and now we’ve broken below 44,000, tapping into the 43,900 zone. Sellers are dominating, and buyers haven’t shown strength on any retrace yet. ⚠️
📊 Market Structure:
✅ Lower highs, lower lows locked in
🧭 Rejected 44.6k supply on lower volume = bearish intent
📉 Price now below EMAs (20 & 50), which are sloping down hard
📉 Current price printing near multi-week support
🔑 Key Levels:
🔽 Support: 43,800 → 43,600 → 43,300
🔼 Resistance: 44,100 → 44,220 → 44,555
💣 Break of 43,800 = high probability for further downside flush
💡 Trade Ideas:
🔻 Short Setup – Trend Continuation:
Entry: Pullback into 44,100–44,200
Confirmation: Bearish rejection candle
TP1: 43,800
TP2: 43,600
SL: Above 44,300
⚠️ No long bias unless bulls reclaim 44,400 with conviction.