OBOL $0.15 as soon as possibleHello,
I think Obol pump as soon as possible and very fast price go to the $0.15 and more.
The total tokens in circulation are less than 100 million, but volumes above 200 million on a particular exchange are unusual and indicate a price manipulation that is caused by lowering the price and collecting tokens on other exchanges.
You can buy on other exchanges and transfer to your wallet and expect a pump and profit of over 300%.
What do you think?
Thank you
OBOLUSDT trade ideas

OBOL/USDT inverse H&S OBOL has been trading in a range between $0.10 – $0.16 over the past 44 days, forming a clear Inverse Head and Shoulders pattern — a classic bullish reversal signal.
The price action is now showing strong signs of upward momentum, suggesting a potential breakout from this consolidation zone.
Pattern: Inverse Head and Shoulders
Range: $0.10 – $0.16
Target: A 50% move from the current price zone
If bullish confirmation continues, OBOL could be setting up for a strong leg upward.

OBOL/USDT Bullish continuationOBOL is creating higher highs and higher lows with clean structure. We have just created the last higher low at 0.1420 and I am expecting to see a new high created above structure.
My target is 0.1665
SL is 0.1345

OBOL/USDT – Bullish Breakout with Retest in PlayOBOL/USDT
Analysis Summary:
The chart shows a potential breakout from a horizontal consolidation range after a period of accumulation. A range breakout is highlighted, with a projected target based on the height of the range.
Key points:
Price is currently retesting the breakout zone, a common bullish confirmation.
Moving averages are converging, signaling a possible trend shift upward.
The measured move projection suggests a potential target around $0.28–$0.30.
TP: 0.30 USD
Conclusion:
Technical structure indicates a bullish continuation is likely, provided price holds above the key support zone at $0.135–$0.14. Retest and hold could confirm further upside momentum.

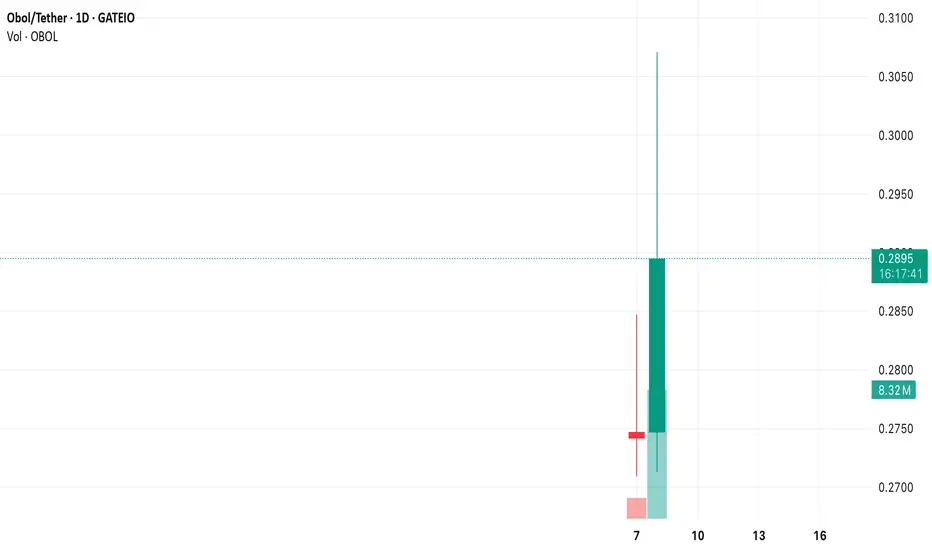
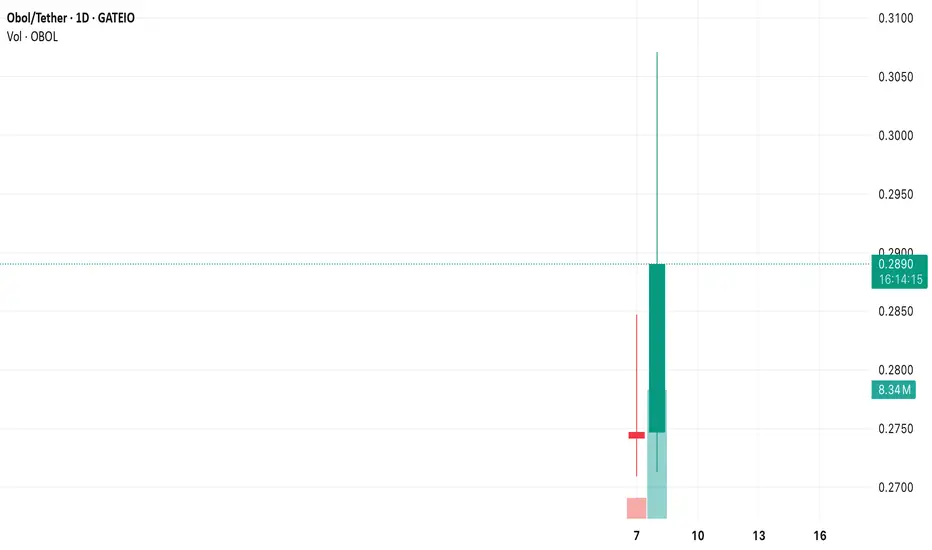
Post-Airdrop FOMO Fade Drives Selling PressureAnalysis: X posts suggest $OBOL’s recent price action is driven by a post-airdrop FOMO fade, with strong selling after the May 7, 2025, Token Generation Event (TGE). The price is below the 50-day EMA, and the Chaikin Money Flow (CMF) indicates capital outflows. A short targeting $0.215 is viable if $0.285 breaks. Entry: $0.288. Stop Loss: $0.30. Take Profit: $0.235, $0.215.

Fibonacci Retracement Points to Deeper CorrectionAnalysis: Applying Fibonacci retracement from the all-time high ($0.380077) to the all-time low ($0.284628), $OBOL is below the 0.236 Fib level ($0.305). The next support lies at the 0.382 Fib level ($0.25), aligning with major support noted in X posts. The lack of bullish volume and a bearish MACD crossover support a short setup. Entry: $0.29. Stop Loss: $0.31. Take Profit: $0.25, $0.215.

Volume Profile Shows Thin Support Below $0.29Analysis: The volume profile indicates low buying interest between $0.29 and $0.25, creating a “value gap” where the price could slide quickly. The price is below the Volume Weighted Average Price (VWAP), and the 20-day EMA is sloping downward, confirming bearish momentum. A break below $0.285 targets $0.235. Entry: $0.288. Stop Loss: $0.295. Take Profit: $0.235, $0.215.

Bearish Trendline Resistance Caps UpsideAnalysis: $OBOL is trading below a descending trendline formed since its all-time high of $0.380077 on May 7, 2025. Attempts to break above $0.30 have been rejected with low buying volume, signaling weak bullish conviction. The Stochastic Oscillator is in the overbought zone on the 1-hour chart, suggesting a pullback. A short entry below $0.29 targets $0.25. Entry: $0.289. Stop Loss: $0.31. Take Profit: $0.25, $0.22.

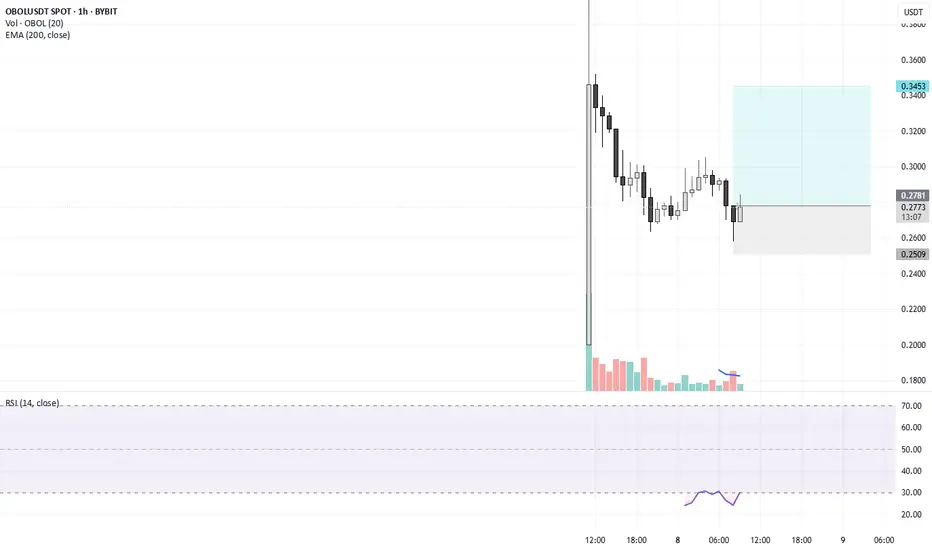
OBOL USDTCP 0.2776
BUY: 0.026 TO 0.29
SELL 0.345 OR MORE
SL: 0.25
high volume
new project can b pump any time.
Oversold CRSI Signals Short-Term Bearish ContinuationAnalysis: Recent X posts note that the Composite RSI (CRSI) for $OBOL is in extremely oversold territory, typically a bearish signal post-FOMO airdrop. The price is below the 200-day SMA, and the MACD histogram is deepening, indicating sustained selling pressure. A drop to $0.235 is plausible if the price fails to reclaim $0.30. Entry: $0.29. Stop Loss: $0.305. Take Profit: $0.235, $0.20.

Short Opportunity on Retest of Broken SupportAnalysis: After breaking $0.29161, $OBOL may attempt a pullback to this level, now acting as resistance. The 4-hour chart shows high-volume bearish candles, and open interest suggests short positions are accumulating. A rejection at $0.295–$0.30 with volume >150M could confirm the short setup, targeting $0.235. Entry: $0.295 (on retest). Stop Loss: $0.315. Take Profit: $0.235, $0.215.

High-Volume Breakdown Signals Further DeclineAnalysis: The 29% price drop in 8 hours on Binance, coupled with surging trading volume, indicates strong bearish sentiment. The price is below the 50-day Simple Moving Average (SMA), and the RSI is declining without bullish divergence, suggesting no immediate reversal. Key support at $0.25 is the next target, with a potential further slide to $0.215 if volume remains elevated. Entry: $0.288. Stop Loss: $0.31. Take Profit: $0.25, $0.215.

Bearish Momentum Confirmed Below $0.2916 SupportAnalysis: $OBOL has broken below the critical support at $0.29161 with high selling volume (>150M), as highlighted in recent X posts. This confirms a markdown phase with lower lows and bearish candlestick patterns on the 4-hour chart. The Moving Average Convergence Divergence (MACD) shows a bearish crossover, and the price is trading below the 20-day EMA, reinforcing downside pressure. A retest of $0.25 is likely if selling continues. Entry: $0.29 (on pullback to $0.295). Stop Loss: $0.305. Take Profit: $0.25, $0.235.
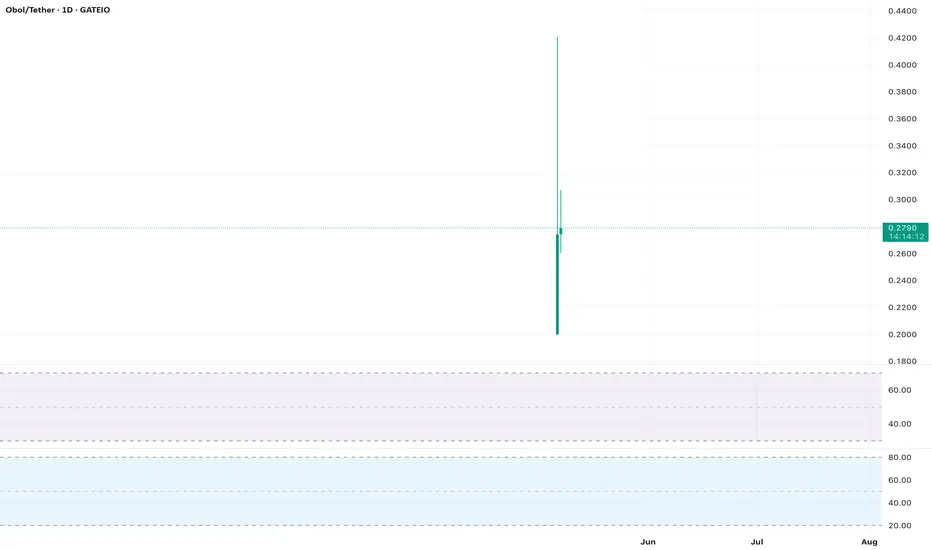
Accumulation Phase Near All-Time LowsAnalysis: $OBOL’s recent drop to $0.276294 (24-hour low on May 8, 2025) places it near its all-time low of $0.284628, suggesting a possible accumulation zone for long-term buyers. The Bollinger Bands show the price hugging the lower band, often a precursor to a bounce in low-liquidity assets. Open interest on exchanges like Binance indicates short positions may be overextended, increasing the likelihood of a short squeeze if positive catalysts (e.g., Obol Collective ecosystem updates) emerge. A breakout above $0.31 could target $0.44, a major resistance level. Entry: $0.29–$0.30. Stop Loss: $0.275. Take Profit: $0.35, $0.44.

Bullish Reversal Potential at Key Support ZoneAnalysis: $OBOL is currently trading near a critical support level at $0.2916, as noted in recent market commentary. This level has historically acted as a strong base, with high trading volume in the past 24 hours ( GETTEX:37M –$44M across exchanges). The Relative Strength Index (RSI) is approaching oversold territory (below 30), suggesting a potential exhaustion of sellers. A 4-hour candle close above $0.295 with volume exceeding 100M could signal a reversal, targeting resistance at $0.33975. The Exponential Moving Average (EMA) 50 is flattening, indicating weakening bearish momentum. Entry: $0.295. Stop Loss: $0.285. Take Profit: $0.34, $0.38.

OBOL's Fibonacci Retracement Levels: Support and ResistanceApplying Fibonacci retracement levels to OBOL's recent swing high and low reveals key support at the 38.2% level (around $0.2600) and resistance at the 61.8% level (around $0.3200). These levels can act as magnets for price action, providing potential entry and exit points.
OBOL's Bollinger Bands Squeeze: Impending Breakout?The Bollinger Bands for OBOL have been tightening, suggesting a period of low volatility. This "squeeze" often precedes a significant price move. Traders should prepare for a potential breakout, with the direction determined by the next move beyond the upper or lower band.

OBOL's Stochastic Oscillator: Overbought ConditionsOBOL's stochastic oscillator is currently in overbought territory, indicating that the token may be due for a pullback. Traders should be cautious of chasing the price at these levels and consider waiting for a dip or a move back into oversold territory for potential long entries.

OBOL's Volume Profile: Identifying Key LevelsAnalyzing OBOL's volume profile reveals significant trading activity around the $0.2800 level, suggesting it as a key support area. If this level holds, it could act as a springboard for another leg higher. Conversely, a breakdown below could lead to a deeper correction.

OBOL's MACD Divergence: A Bearish Signal?A divergence has formed between OBOL's price and its MACD, with the price making higher highs while the MACD makes lower highs. This bearish divergence could foreshadow a potential reversal in the uptrend. Traders should monitor this closely and consider reducing exposure if the divergence persists.

OBOL's Trading Range: Opportunities for Day TradersWith OBOL establishing a trading range between $0.2500 and $0.3500, day traders may find opportunities to capitalize on short-term price swings. Look for entries on pullbacks to the lower range boundary and exits on rallies towards the upper boundary, using stop losses to manage risk.

OBOL's Post-Listing Surge: A Technical OutlookThe OBOL token has experienced an initial surge following its listing on Gate.io, reflecting strong market sentiment. Traders are advised to watch for consolidation patterns around the $0.3000 level, which could signal a continuation of the uptrend or a reversal point. Keep an eye on trading volume as it can confirm the strength of the move.