SCALPING OCEANUSDT FOR PROFITShello guys , an opportunity to short for profits. follow the chart , we can see the strong resistance zone .
tradehubng
OCEANUSDT trade ideas


Is Ocean Protocol accumulating for next big move?Welcome Nice Trading Bro´s & Ladies! Is Ocean Protocol accumulating for next big move? Well, right now Ocean found good support and bounce already 3 times from it here on the 4h chart. The POC is coming in at 0,22 $ also a lot of resistance because of the 4h EMA Ribbons. I really don´t like the fact that Ocean already made a lower low comparing to the initial price after the launch. Come on Bulls where are you?

OCEANUSDT - LONG - POTENTIAL 11.14%Bounce from lower ascending trendline, I'd suggest a quick close out if lower trendline breaks down.

OCEAN/USDT BUYING SETUPOCEAN breakdown the support but rejection one symmetrical triangle resistance become support trendline, potential continue upward movement EMA 20 & EMA 50 Nearly crossover
Buy zone : 2.238 - 0.21
Target : 0.25888 - 0.2765 - 0.2941 - 0.3118 - 0.3294
Stop : 0.19

Ocean Huge Bearish Triangle Breakout In a daily and 4h chart we can clearly see that ocean has failed to overcome the long term downtrend with a major bullish wave and as it is showing now it looks like it is about to lose one of the most important Support areas which can be a sign of a bearish market until it hits a good trend changing demand area which could be anywhere from 0.2 to 0.3 (fibbonacci levels) .

Ocean - Tsunami is near 🌊🌊🌊🌊 BTC bullish and did a false breakout
🌊 Mirror level is visible on daily timeframe
🌊 Volume is at bottom
🌊 5th touch
🌊 Level is 4 days old
🌊 40 ATR
🌊 Over VWAP
Will enter when price squeezes to the level on lower timeframes, the base will form and the strip will get faster.
Fix profit by parts:
1% - 1/3
2% - 1/3, stoploss to breakeven
What's left, hold to the maximum
What do you think of this idea? What is your opinion? Share it in the comments📄🖌
If you like the idea, please give it a like. This is the best "Thank you!" for the author 😊
P.S. Always do your own analysis before a trade. Put a stop loss. Fix profit in parts. Withdraw profits in fiat and reward yourself and your loved ones

Ocean Protocol (OCEAN) Buy ZoneOcean Protocol (OCEAN) Buy Zone
--------------------
BIAS
Mid-Term : Bullish
Risk : Medium
Short term scenario has become neutral with our latest $BTC and $ETH move down, Ocean Protocol has reached mid-term support zone which is possible to reversal.
--------------------
$OCEAN/USDT LONG SETUP
Leverage : x3 - x5
Entry Price : 0.45 - 0.43
TP 1 : 0.46
TP 2 : 0.472
TP 3 : 0.491
TP 4 : 0.505
TP 5 : 0.518
TP 6 : 0.5345
TP 7 : 0.538
TP 8 : 0.5625
Stop Loss : 0.415
*Maximum 3% of Portfolio.
*Unload 12.5% at each TP. Whenever TP 2 hits, Move stop loss to entry.
--------------------

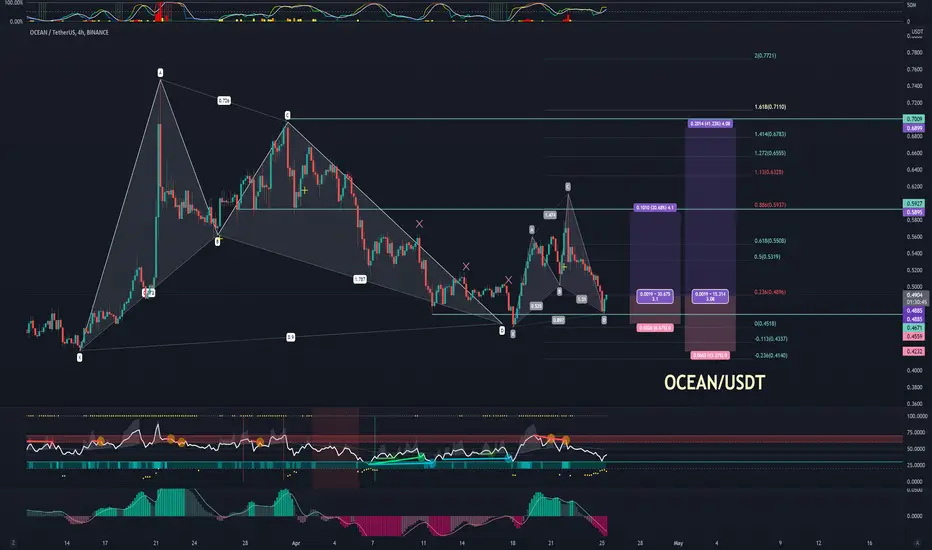
$OCEAN Bullish SharkBack down to support and at the .886 retracement off the local highs with hidden bullish divergence on the RSI. This bullish Shark is also the confirmation low of the larger structure.
Stop losses are just set 3:1 RR, they can be tightened to play the momentum, because ideally you really dont want to see another low, even though the shark could do the 1.13 without invalidating.
OCEAN - Bears are out, now we can hit rock bottom⚓️BTC direction is uncertain, so use only half of usual volume .
- Formation is clearly visible
- 4th touch
- Volume at top
- False breakout
- Under VWAP
- Squeezing to support
- Lenth of formation is >400 bars
- Will enter when the base on 5m tf will form and the strip will get faster.
What do you think of this idea? What is your opinion? Share it in the comments📄🖌
If you like the idea, please give it a like. This is the best "Thank you!" for the author 😊
P.S. Always do your own analysis before a trade. Put a stop loss. Fix profit in parts. Withdraw profits in fiat and reward yourself and your loved ones

TRADE PLAN FOR OCEANhello trader, follow the chart it has been simplified for entries and with patience you are there.
tradehubng

OCEAN TRADE UPDATEOcean has broken out nicely and so far so good for our second huge swing on this great project.

Ocean opportunity!!!Hello my bros....as you can see in my chart in 4H timeframe we have a reverse head and shoulders and after passing our major resistance we expect to have a good rising....

Great Opportunity For Scalper Entry Price : 0.5408 - 0.55
TP1 : 0.5885 $
TP2 : 0.615 $
TP3 : 0.638 $
Stop Loss : 0.514 $
As it turns out, A flag pattern is finishing in 1 hour time frame. It is a good opportunity for scalper by entering in sweet zone .

Ocean the time has come to have a ConversationOcean is a bit overextended and due for some pull back, We want to be taking entry in the entry band, However at Lower leverage you may take entry on the first wick that breaks the 0.55 resistance level and is rejected.
Stop Loss is 0.63, What does this mean- Hand me my lightsaber.

OCEAN TRADE ENTERED As per the chart we have entered again after a huge 50% spot a few weeks ago and we have a nice flag breakout looking for another 30% swing here.

OCEAN OCEAN / USDT
in high time frames we are near the stronggest support for this coin since late 2020 !
If the lower trendline hold for next days expecting Strong bullish rally


ocean to the end !!!OCEANUSDT : as you can see guys in chart OCEAN in the more critical zone the price above the blue support which was the the first step to ocean make (1.2864 usdt) well if this day candle close under this support OCEANUSDT will drop to 0.3765 usdt which is the most predicable because all the crypto coin are in falling trend well we really need to focus on this coin because our entry point for the interested people is the break of the trend well let me know your opinions guys in the comment or you can message me well i can read your message and reply you :) finally cheer me if you find this post informative and if not message me bye to the next post


LONG OCEANUSDT 2022.01.04Hi everyone,
Please hit the like button or leave a comment if this can make you some money.
LONG OCEAN: RR 1.72
- ENTRY : 0.6175
TP1: 0,639
TP2: 0.6638
- SL: 0.5856

#OCEAN/USDT 20% Up and Still My Target is $3#OCEAN/USDT TA Update:-
$OCEAN currently trading at $0.67 and went upto $0.7
Its almost 20% Profit from our entry.
Entry 1:- $0.55 filled ✅
Targets still same.
TPs:- $1/$1.64/$3
Stop Loss:- $0.48
Support:- $0.55/$0.48
Above $1.64 $OCEAN will be Sky Rocket.

IHS Ocean ProtocolI see an inverse head and shoulders in Oceans chart... wait for breakout then open your position
