OCEAN HEAD AND SHOULDER PATTERN !Hi everyone , i just check the Oceanusdt and i see the beautiful head and shoulder pattern , so you should just wait to Confirm CandleStick in 4hr Time Frame and After going to Short !
DO NOT TRADE UNTIL CANDLE CLOSED IN BEARISH !
NOT FINANCIAL ADVICE
DO IT WITH YOUR OWN RISK
OCEANUSDT trade ideas

OCEAN/USDTIt is suitable for entering this price area. The goals are clear. We enter in a step.
Be profitable


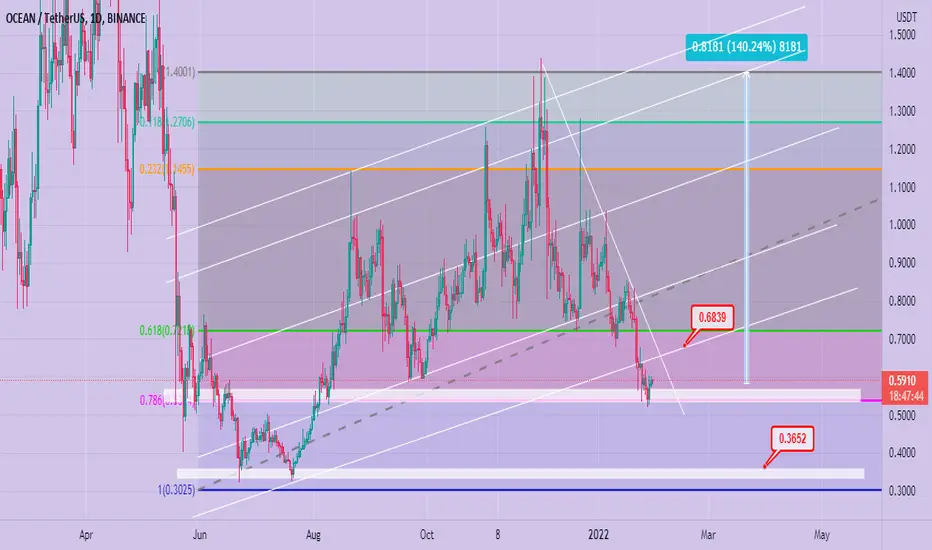
Ocean range chartAnalysis details is on chart, the daily close will confirm the expected support and if it fails to hold, the trade will be invalidated

#Ocean / Usdt(Risky!)
❇️Buy zone 1 : 0.534~0.52
🎯Targets : 0.547 / 0.562 / 0.582
⛔️Stop loss : 0.517 (-3.24%)
🛑Don't risk more than 3% of capital.

$Ocean As always a falling wedge.Ocean moves in a falling wedge pattern, but here the situation is a bit more interesting than on other coins. We have a support zone (0.53-0.57) at these levels, as well as support from the bottom bolinger band. In the near future I expect a resistance level test (0.63-0.67). IMPORTANT: Bitcoin price movements can make adjustments to the coin's price, keep an eye on bitcoin first.


BREAKOUT COMING OCEAN FOR PROFITShello traders, we are expecting breakout coming soon on ocean . follow the chart and you can see the buy zones and projections.
tradehubng
OCEANUSDT - Falling Wedge PatternOCEANUSDT (4h Chart) Technical analysis
OCEANUSDT (4h Chart) Currently trading at $0.587
Buy level: Above $0.585
Stop loss: Below $0.525
TP1: $0.624
TP2: $0.673
TP3: $0.7272
TP4: $0.80
Max Leverage 3x
Always keep Stop loss
Follow Our Tradingview Account for More Technical Analysis Updates, | Like, Share and Comment Your thoughts.

OCEAN short?- overbought RSI
- large gap between the conversion line and base line
- target is between the 0.382 fib, 0.5 fib and the 0.618 of the 1st elliott wave

Bearish shark pattern Hi as we see here , we have bearish shark pattern, so i think we will going to D at 1.2199

Spot trade on oceanusdtThe pink lines are the target prices
The orange line is the stop loss
Entry price is when the price make a pullback to de green trend line.
The drawn pattern is predicted.

Time to take a dip in the OCEANOCEAN has been trading within this shallow ascending parallel channel since Oct 2021. With BTC's recent drop, it has begun to trade below its 200 day EMA but there is an opportunity to buy for a short-term ~15% gain or long-term ~45% gain.
We can see that OCEAN could bounce from the bottom of the channel but it is worth waiting for an initial green candle (or signs that BTC has finished its correction) from the ascending support before opening a trade as currently, we are in free fall. Of course, the idea is cancelled if there is a candle close below the ascending line.
Please note I am not a financial advisor and this is not financial advice. All ideas are for educational purposes only :)
Please feel free to leave your comments, questions and thoughts below!

OCEAN LONG HEREOcean staying inside channel for a wile.
Im longing here because small trendline broken (Blue Line)
Long with 4 Targets.
#OCEAN #OCEANUSDT
Buy Between: 0.90 - 0.95
Targets: 1.05 - 1.15 - 1.25 - 1.50
Stop Loss: 0.8

oceanusdtocean good project that may hit new top in the near future
ocean now the price is between ( 0.88 - 0.80 )
target 2$
everything shown in the chart you can follow
good luck send it.

#OCEANUSDT 4H Chart
Price is currently ranging in an uptrend creating higher highs and higher lows also leaving a freshly printed 4h demand zone at $0.956. MACD is now bullish, RSI is bought and EMAs are working as support. I expect price to bounce from the 4h demand zone and head towards the major daily supply zone at around $1.184.


Ocean currency in USDT marketOcean currency in USDT market
It has its own 155-day long-term uptrend channel.
With a good candle separated from the bottom of the canal and broke the midline line, ate a very good volume.
If this trend continues, it can touch the midline line of the channel again. This means 25% profit.
If this analysis is realized and the candle above the channel midline closes, we can hope for the next target, ie 40% profit.
Tip: Draw a long-term 155-day uptrend channel and use support and resistance lines to estimate good points for potential future targets


OCEANUSDT BREAKDOWN ALLERT SHORT OR WAITING THE DEEPOCEAN/USDT
OCEAN after the break , we can SHORT with retest
OR wait the price going deep
Please dont hurry, market in bad condition
ENJOY AND KEEP SPIRIT

