OGNUSDTHELLO Traders
I hope you start a good trading week.
On the chart, we see a formed side range between 0.32~0.18 , which has been active for more than a month.
If the Bitcoin price remains in the current stable position and does not lose its value in the following hours, we can expect a rise in the price of OGN from its current price 0.322 to 0.470 in the next week .
However, if the bitcoin loses its value again, the price will go down to the support area that is 0.238 ~ 0.200which can be a good opportunity for mid-term investment. See the image below for more details.
If you like this post or have any comments, leave a comment for me here and share it with your friends.
OGNUSDT trade ideas

OGN, reliable level to go in. Hi, it's very logical in my opinion. First of all, bitcoin is $20k and every other asset has big discount. If you believe in this project and you check history you see $0,27 isn't very much for OGN. If you look at the left side, history shows that on this level we are NOW on, traders are most confident in buying/selling. So I expect heavy price action. Also, you see a tripple bottom (recently made) The green area is a level that is tested, failed, tested, failed and now I hope that it is going to find support.
Don't mind my English, I'm a foreigner.

OGNUSDT | SETUPOGNUSDT has once again approached to support trendline after rejection from falling resistance. As highlighted on the chart, the trendline acted as good support in the past. We are watching out price action at support level and If we have a good price action on the support meaning bullish candle and followed by strong candle then one can enter long.Alternatively, breaking below the trendline will bring bears in the party.
Trade your levels accordingly.

OGNUSDTHi dear friends
The price has been very nice in its movement, respecting the previous ranges, and until the orange uptrend line is broken to the bottom, I have no mentality for a downtrend.
In my opinion, there is a high possibility of forming an upward trend from the $0.2458 or $0.2348 price range.
The yellow range ($0.3454) is not so valid and probably there are no special orders in this range!!!
If the uptrend line doesn't break down, the longer term downtrend line is more likely to break, isn't it!?!?

OGNUSDT
Hello Crypto Lovers,
Mars Signals team wishes you high profits.
This is a one-day-time frame analysis for OGNUSDT
In this chart, there is R1 as our resistance area and it expresses that the price was unable to rise. And then we have S1 that is our support line and shows the support of the price at some points since the past. At the present, we see the price fluctuating on S1 and we have a long position for it and we believe it will rise to R1. In case the price loses the support at the area of its fluctuation over S1, then we will predict a decline for it below the mentioned line.
Warning: This is just a suggestion and we do not guarantee profits. We advise you to analyze the chart before opening any positions.
Wish you luck

OGN/USD - Gann Box Outlook As the Gann Box is no silver bullet, it provides a nice outlook on levels for OGN, here's my Gann Box :) enjoy

OGN/USDT #OGN/USDT 10-20X LONG
OGN/USDT looks good on 4HR time frame moving along rectangular support price has taken reversal several times from this region. Currently in Fib Golden Pocket. POC is also aligning with in the demand zone
◼️Entry: $0.2752 - $0.2681
🟢 Target 1 : 0.2770
🟢 Target 2 : 0.2880
🟢 Target 3 : 0.2988
🟢 Target 4 : 0.3059
🟢 Target 5 : 0.3270
🛑SL : 0.2437

OGNUSDT short position BINANCE:OGNUSDT
I suppose, since we see a downtrend, and breakdown in such situations, resistance plays a key role for stop-loss, and stop-loss is 0.36, the entry price is 0.312 - 0.32, targets are 0.3, 0.29,0.28 and goes to 0.2.
Patience is key to success in crypto. Manage your risk-to-reward ratio.
Sincerely, Ammad Shakoor!

OGNUSDT - Long by Supertrend, Pivot & ADX 7/5/2022- 4h timeframe: Supertrend > Long.
- Pivot High/Low: left: 10, right: 10 > Long.
- ADX 1h & 4h > 25: Strong Uptrend.
>>> Open Long (Buy) at 1h timeframe's Supertrend.


OgnUSDTPERP Above 40 it's a bull scenario... below .30 it's only pain for longs. short from .38. SL above.40

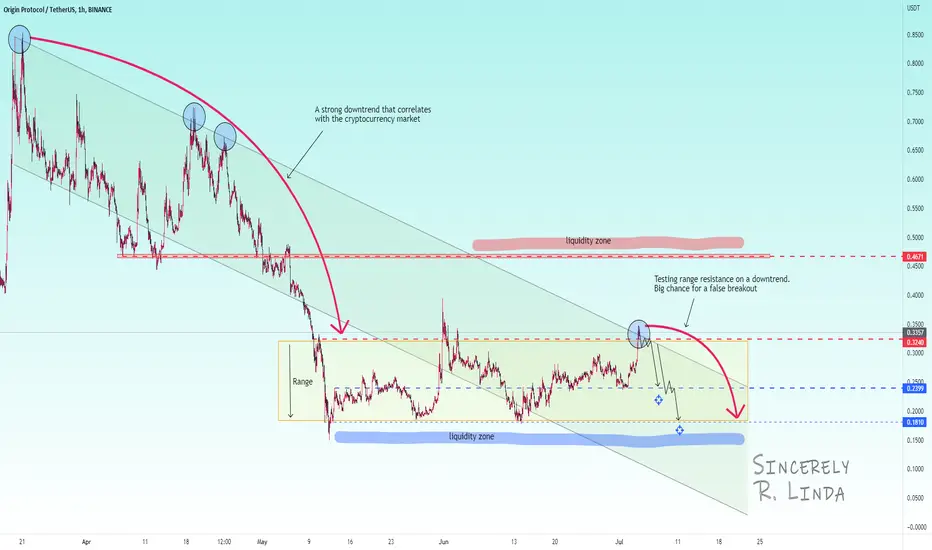
OGNUSDT ! How will the coin behave relative to bitcoin? 🙈OGNUSDT , like the entire cryptocurrency market, does not show anything interesting, except for the price drop. On the chart, we see a formed side range between 0.3240 and 0.1810, which has been active for more than a month.
Price testing resistance ( down channel and range resistance) on high volatility (after momentum)
I suppose, since we see a downtrend, and in such situations, resistance plays a key role, then it is worth waiting for a false breakdown and consolidation under the level. I think that after a false breakout, the price can reach the short-term target of 0.2399 and the medium-term liquidity zone of 0.1810
Sincerely, R. Linda!

ORIGIN PROTOCOLOGN/USDT Strong Resistance zone forming Bearish Fllag waiting to drop Down in SHORT on this Coin

OGNUSDT | TOUGH RESISTANCEOGN is facing tough resistance both Trendline and Horizontal resistance. Seems to be an easy call or the bears so stay short with the given target.


OGN/USDTOGN / USDT
It is in a bearish channel that has lost its support of 26 cents and pulled back.
We are expected to fall to the level of 11 cents.
#OGNUSDT #OGN #BTCUSDT #BTC #ETHUSDT #LUNA #LUNC

ogn/usdtogn/usdt
short position
wa are in down trend and storng weekly resistance
good luck and trade your plan

OGN LONG TRADE 20220616Blue -> Green * N
ORIGIN PROTOCAL, OGN, OGNUSD , OGNUSDT , CRYPTO,CRYPTOCURRENCY
DISCLAIMER
This is only a personal opinion and does NOT serve as investing NOR trading advice.
Please make your own decisions and be responsible for your own investing and trading Activities.

OGNUSDT wants the demand zone on 0.15$The price bounced on the daily support on 0.1835 and now the price is testing the dynamic 4h resistance.
The price got the liquidity from the 4h resistance and now wants to retest the demand zone on 0.15$
How to approach it?
IF the price is going to lose the daily support, According to Plancton's strategy , we can set a nice order
–––––
Keep in mind.
🟣 Purple structure -> Monthly structure.
🔴 Red structure -> Weekly structure.
🔵 Blue structure -> Daily structure.
🟡 Yellow structure -> 4h structure.
–––––
Follow the Shrimp 🦐

OGNUSDT 0.45 or 0.65
Some people don't like bungy diving, sky diving, fast cars.. Some don't.
We accept people as they are!
Know your ground and don't mess in unfamiliar territories when you re not ready.
My fav quote :
Opportunity awaits the prepared mind.
Love from Malaysia

