Possible Long on Origin ProtocolSo as we can see at 4h chart seems like we are on bullish trend, if price for this sunday-monday reaches 0,30 and crosses EMA-200 with big candle, we might see next push to our TP1 at 0,33 with 10% raise (x3 or x5 leverage would give 30-50% profit).
ADX still on strong trend above 30 and buy pressure trend is raising.
Tomorrow it will be decisive day for BTC if we still keep at accumulation or the price goes up again to 31-32K.
Remember to DYOR as always :) !
OGNUSDT trade ideas

OGN/USDT BUYING SETUP (SWING) OGN has retest on resistance become support area, potential continue upward movement
very interesting at weekly RSI showing bullish divergence
Just hold i think can 50-100%
Buy zone : 0.238 - .22
Target : 0.2703 - 0.2984 - 0.3284 - 0.3987 - 0.5
Stop : 0.215

OGN Potential long tad is setting up there on the chart
let see for the next few days if it will hot the target

Origin Protocol (OGN)Price action for a number of alternative coins has obviously taken a beating over the past several weeks. How do you take advantage if you’re already sitting on losses? Easy.. look for those that have fallen even harder.
Spent the last couple of hours calculating ratios from recent highs to current price action on Binance listed tokens.
Coming in at a ratio of 5/1 since a high of $3.20 is Origin Protocol now at 65 cents.
On the above 1-day chart a number of bullish signals exist:
1) The oscillators indicate a ‘great buy’ opportunity (orange column).
2) Look left, price action is showing support on previous resistance. Furthermore on the OGN / BTC chart (below) price action is showing the same support and resistance whilst testing support on the 200-day SMA.
3) Price action has now corrected to the 0.618 golden ratio (not shown here).
Is it possible price action falls further? For sure.
Is it probable? Unlikely - but what is certain, the risk / reward ratio is very appealing given all this volatility.
1st target $3 / 5x from current levels.
Good luck,
WW

OGNLOSINNG this level will create a masacre
30 min close below will open my short
there is clean room to downside

OGN is Good on Daily chartHello , Guys Look at chart and decide
OGN is targeting the white targets on the chart specially the Yellow one next days .
It is not a financial advice and plz DYOR.
Good luck

OGNUSDT , DESCENDING TRIANGLE , WHAT'S NEXT ?Hello Traders!
Before we start to discuss, I'll be so glad if you share your opinion on this post's comment section and hit the like button if you enjoyed it!
- Checking OGN on 1D time frame chart is trading inside a descending triangle making lower highs while making equals lower lows , local S/R exist on 0.369$ price re-tested this zone suggestion that buying will take price higher from
there , we already faced a S&D pattern before ( RALLY DROP RALLY ) , local S/R is acting as a good zone for buyers we might see the price could consolidate before approaching to the next resistance level on 0.5201$
- It will be a trigger if buyers managed to break the upper trendline of the descending triangle , if not sellers will push the price again towards previous local S/R 0.3369$ and even lower towards strong support zone on 0.2000$ which act as an psychological support , meanwhile i will be monitoring BTC performance suggesting that it could trade lower towards 34k -30k levels , taking the Market cap down below.
Good Luck Traders.

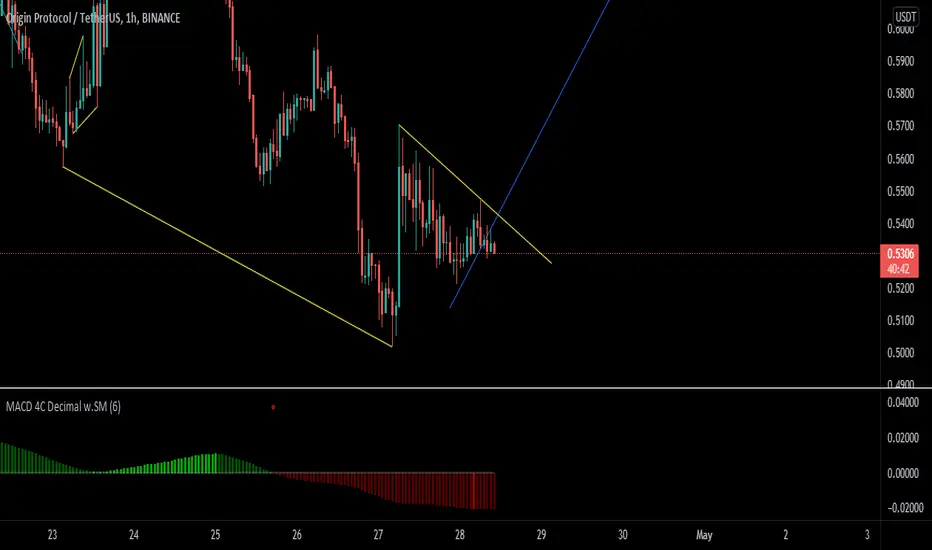
OGNUSDT BuyThis analysis is based on the wave count and rtm presented. I think the price return is from 0.36 to 0.34.

OGNUSDT is creating a descending channelThe price is creating a descending channel on the 4 timeframes and now the market is getting the liquidity from the daily demand.
At 0.5 $ the price has a resistance.
How we can approach it?
If the price is going to have a breakout from the descending channel and retest the 4h resistance as new support, According to Plancton's strategy , we can set a nice order
–––––
Keep in mind.
🟣 Purple structure -> Monthly structure.
🔴 Red structure -> Weekly structure.
🔵 Blue structure -> Daily structure.
🟡 Yellow structure -> 4h structure.
–––––
Follow the Shrimp 🦐

OGNUWait for break out or break down. Used risk management and fix RRR. Put stop loss for TA invalidation. TAYOR

LONG OGN !!!I saw a strong divergence in the RSI! Given that we are on strong support and also the RSI is out of the downtrend channel, I prefer LONG positions

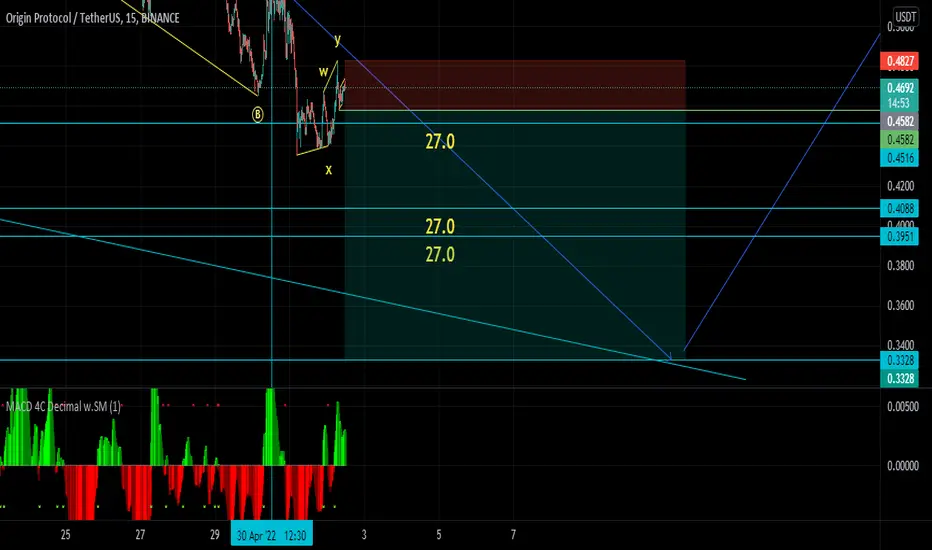
OGNUSDTThere is an Aggressive Entry forming in the chart although it's a good trade since 5:1 ratio trade. Wait for the pattern to break. Then enter to sell trade. If it reaches 1st 27.0 level breakeven it. After that you know the drill. Keep tightening the Stop loss. Manage the trade closely since it's an aggressive trade. Trading is serious business and it carries a high level of risk and may not be suitable for all investors. Do your own due diligence before putting your funds to work on anything; you should make yourself an expert. There will be up to date ideas. So be kind enough to follow me for more updates.
Still in correction wave, $0.35Right now, OGN is trading around 0.47 and it's in lower third wave which might be at 0.42
That case, OGN come down to around 0.35
Besides, BINANCE:OGNUSDT has a invalidation level below 0.32
What next, wait and see

OGNUSDTThere is a short sell trade after that with the confirmation we can enter for the buy we were waiting for long time. You can see the levels that I am interested in Please do your own due diligence. Trading crypto is a serious business. Don't Forgot to follow me. There are more to come.

A combination of EMA, Fib, RSI, Fractal, and ADXIt's my first time to apply my own indicator using fib and fractal as confirmation.

OGN : This scenario OGN chosen this scenario
ENTRY : wait for pull back n confirmation again
this support that broken was very strong


Very bullish OGN chartOGN been consolidating for a while , let’s see if it can do what ape and gmt did.

OGNUSDT04/25/2022 New Update on OGNUSDT. Here is the move expected. It should drop to the levels I have shown. Then Make a crossover the go for a buy.

OGNUSDTNew Entry Option in OGNUSDT. If it breaks the trend line wait for the confirmation the enter the trade.
OGN 150% PUMP SIGNAL!!!OGN had performed best last week togetther with luna,ape and gmt.
It had made multiple higher highs on 4h timeframe and is not going back to demand zone as I posted that it will .
Demand zone drawn on chart is area which I am gonna be entering long positions from.
This is just my opinion!!!

OGNUSDTUpdates on OGNSDT. There is new market Conditions affected. If anyone is in long Trade on OGNUSDT breakeven the trade when it comes to 0.7998 Level. I am expecting another confirmation on this trade. So there are two Possibilities on this Pair so far.
1. The trade should move to level 1.0193 Rapidly and create another correction then go for the 1.7184 level
2. Comes back down make another correction for a more than 8days (I do not know exact days only the correction expected is more than 8 days) Then go for a long.
Due to these conditions we should be on a breakeven if it goes for the 0.7998 level. If the second options is on act we can enter the trade from far down so we could gain a good risk to reward. I am so sure if it comes back then we can see bigger moves in no time. Trading crypto is a serious business. Please do your own due diligence your self. Trade with care. Feel free to comment bellow your ideas. Don't forgot to follow me and support me.

OGN, Time to send! As soon as we reach our box area, I believe we will accumulate for a bit before we start to really fly.
DYOR, trade safely! Patience always wins!
