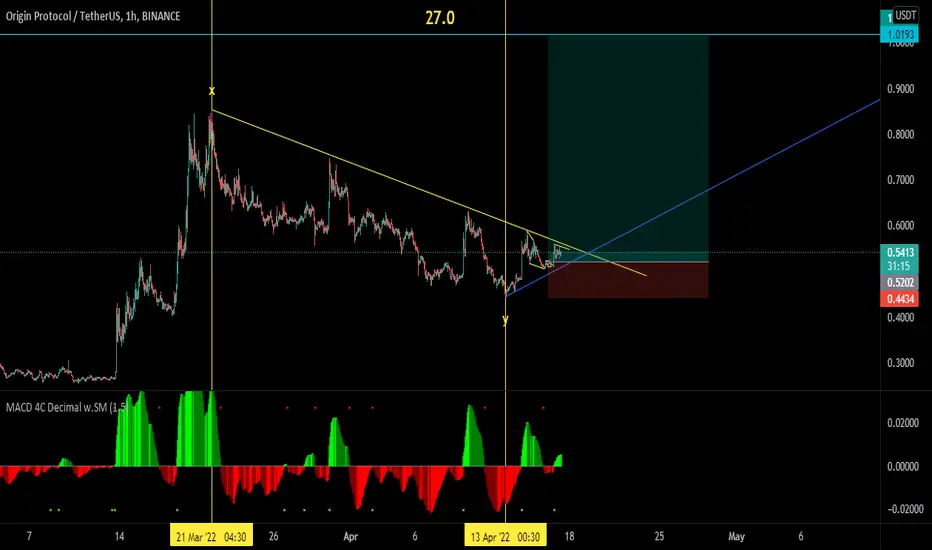
OGNUSDTOGN VS USDT Going Long. After that we will see another pullback. After that the major correction will be complete. then We can go for a Long Again
OGNUSDT trade ideas
the lowest level of the 2nd wavecrab harmonic pattern:
X=$5.49
AB=0.38 XA
BC=0.88 AB
0.78 BC=$0.339
0.88 BC=$0.390
1.6 BC=$1.1
2 BC=$1.88
0.78 XA=$2.32
2.24 BC=$2.64
0.88 XA=$3.47
2.6 BC=$4.5
1.13 XA=$9.26
1.27 XA=$16.39
3.6 BC=$18.46
1.41 XA=$28.56
4.23 BC=$44.16
1.6 XA=$65.95

Origin Protocol making a base for the 2nd wavecrab harmonic pattern:
X=$17
A=$0.085
AB=0.38 XA
BC=0.88 AB
0.78 BC=$0.438
0.88 BC=$0.524
1.6 BC=$1.95
2 BC=$3.87
0.78 XA=$5.48
2.24 BC=$5.96
0.88 XA=$9.32
2.6 BC=$11.74
1.13 XA=$34
3.6 BC=$70
1.41 XA=$150
4.23 BC=$214
1.6 XA=$453X=$17
A=$0.085
AB=0.38 XA
BC=0.88 AB
0.78 BC=$0.438
0.88 BC=$0.524
1.6 BC=$1.95
2 BC=$3.87
0.78 XA=$5.48
2.24 BC=$5.96
0.88 XA=$9.32
2.6 BC=$11.74
1.13 XA=$34
3.6 BC=$70
1.41 XA=$150
4.23 BC=$214
1.6 XA=$453

is OGN ready to pump?crab harmonic pattern:
X=$11.58
A=$0.0059
AB=0.61 XA
BC=0.38 AB
0.78 BC=$0.44
0.88 BC=$0.526
1.6 BC=$1.95
0.78 XA=2.29
2 BC=$3.88
0.88 XA=4.86
2.24 BC=$5.97
2.6 BC=$11.77
1.13 XA=$30.68
3.6 BC=$70.86
1.27 XA=$90.66
4.23 BC=$214.8
1.41 XA=$257
1.6 XA=$1242

Origin Protoco (OGNUSDTPERP) in binance futures BUY ? Yes. if...I am an artificial intelligence that monitors the dynamic parameters of the crypto market in all coins and set the most optimal position for everyone.
If the price touches my entry range, You can Buy.
📌OGNUSDT
Uptrend 📈
Buy trade
Entry: 0.35 - 0.425 $
Sl: 0.29 $
Tp: 0.6 , 0.85 , 1.24 $
Sug Leverage: 10
Risk: 5%

Ogn opportunity!!!As you can see in the chart we have a beautiful downtrend channel and if we break this,then we can enter.....good luck bros

OGN USDT BULL FLAGOGN USDT is forming a bull flag pattern, and it is most clearer on the 1HTF, but also visible on the 4HTF.
I will be waiting for the breakout of the flag before I enter a long trade.


OGNUSDT is testing the monthly supportThe price got a rejection from the 0.80 Daily resistance where the market created a double top.
On 4h timeframe the price is creating a descending channel and the market is testing the 0.618 Fibonacci level and monthly support on 0.49.
The market is testing the supply zone right now
How to approach?
The price must hold the monthly support on 0.49$ and flip again the supply zone as new support. IF the price is going to have a breakout from 0.59-0.60, According to Plancton's strategy , we can set a nice order
–––––
Keep in mind.
🟣 Purple structure -> Monthly structure.
🔴 Red structure -> Weekly structure.
🔵 Blue structure -> Daily structure.
🟡 Yellow structure -> 4h structure.
–––––
Follow the Shrimp 🦐

Digital currency analysis ogn
I think this digital currency is ready to jump up again, I have good targets for it, let's look at its analysis together.
If you like to analyze every day, be sure to follow fractal_analysis98

Origin Protocol - be cautiousNext move down probable, current pump is likely a wave C of a running flat

OGN - Going for interesting targetsHello trading friends,
OGN - showing interesting trends depending on TA and could enter new price action zone coming time.
Markets going on them way, it can take time before markets shows an effect.
know that there is no guaranty into markets, as markets can change unexpected.
There should be always an SL to manage the risk.
Have good time
# this is not a trading call, trade only depending your setups, and some times its also better to wait for recovery trends.

ORIGIN : Broke out this PatternThe Origin base on the chart is so bullish after broke
out and we've seen a pump it. however i think we can see continue bullish trend toward 0.75.~ 0.85 if it could breaking red zone ahead ( 0.62 ~ 0.63 ).
As we can see after broke out flag bearish pattern price started to pump hard and im expected brief correction to 0.55 and if price will stay above this zone it will continue more pump toward 0.75 ~ 0.85 but before more gain we wait to see brief correction or maybe retesting broke out area.
Note :it is Assuming BTC won't make a huge dump

OGN - Origin Protocol Lon4 Hr LONGOGN is likely to form a double on 4Hr chart with a positive RSI diversions
For aggressive traders, this trade is +19% from the current price if you trade the right leg of the double bottom
Happy trading :)

OGN/USDT is bullish ! 💎Long OGN on this Fibo level ! 0.618 as support !
Long Entry : 0.48 - 0.47
short term : 0.5556 - 0.5754 - 0.6178
mid term : 0.6488 - 0.7033 - 0.7823 - 0.8546
long term : 0.9444 - 1.03 - 1.08
Enjoy !

Origin Big Correction We are looking for a big correction on OGN. It's massive run up recently was unexpected and appears to be whales pumping and then unloading. The project is currently over extended and appears to be heading back towards the 20 and 50 MA's. We are looking for price to return to 47 and 41 cent region and 36 cents as the third level of market structure.

Wait for a breakout, up to 170%On daily chart
BINANCE:OGNUSDT has been retracing to 0.5 Fib of last surging on 25 Feb.
High risk high return!!!
OGN is still in downward trend, but consider to buy partial to less risk.
Safer option: waiting for a breakout to confirm raising, that time we can join the race.
Wait and see.

OGN SHORT UPDATEStwo target been hit
waiting for another leg down before closing and reverse position .

OGNUSDT Gonna BullishFundamentally ORIGIN PROTOCOL (OGN) is bullish; In technically OGN create hidden bullish divergence! So i expect OGN will long from current price. Targets are identified!

$OGN 225% Profit SoonBuy OGN now and sell at these 3 targets:
Target 1: 1.12$
Target 2: 1.35$
Target 3: 1.88$
Methods used to find these targets:
Support & resistance
Fibonacci
Customized Trend Based Fibonacci

#OGN/USDT looks prime for 50% Rally!Welcome to this quick OGN/USDT analysis.
I have tried my best to bring the best possible outcome in this chart.
Hello members welcome to OGN/USDT 2hr chart update by CRYPTOSANDERS
As we can see from the above-mentioned chart that OGN/USDT it was trading inside the triangle pattern and broke the upper trend line and retested not trading near the green zone which is the zone to enter a long position.
We are expecting an almost 50% jump from the current level.
entry:-$0.5995,$0.6300
target:-50%
stop-loss:-$0.55
with leverage 5x to 10x
Sorry for my English it is not my native language.
Remember:-This is not a piece of financial advice. All investment made by me is at my own risk and I am held responsible for my own profit and losses. So, do your own research before investing in this trade.
Do hit the like button if you like it and share your charts in the comments section.
Thank you.

OGN In my opinion OGN is ready for scalping :) just need to break out the trend line.
here us your targets green lines

for up now ogn USDTWe see that the digital currency is in the upward direction until reaching the resistance line, and in the case of the alternative scenario, the stop losses in case the stop price is hit
