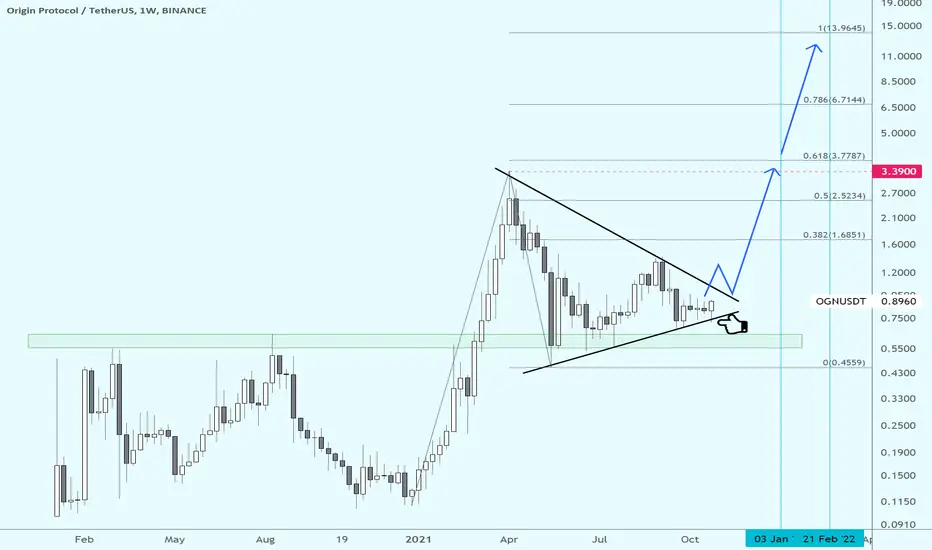
OGN held support and bouncing for breakoutIt's at $321 million mcap, I expect $13.96 target (the fib extension) which puts it at a $5 fixed billion mcap.
Nice setup, giant flag structure, these have absolutely minted money all year long, just look at the flag on SOL that delivered.
Here is the SOL flag for reference.
OGNUSDT trade ideas
OGN DEMAND ZONEOGN/USDT
🌳 BUY: around 0.8~0.9 $ (or any price above 0.54 $)
⚠️ STOPLOSS : WEEKLY CLOSE BELOW 0.54 $
♥️ USE TRAILLING STOPLOSS AFTER 50% PROFIT


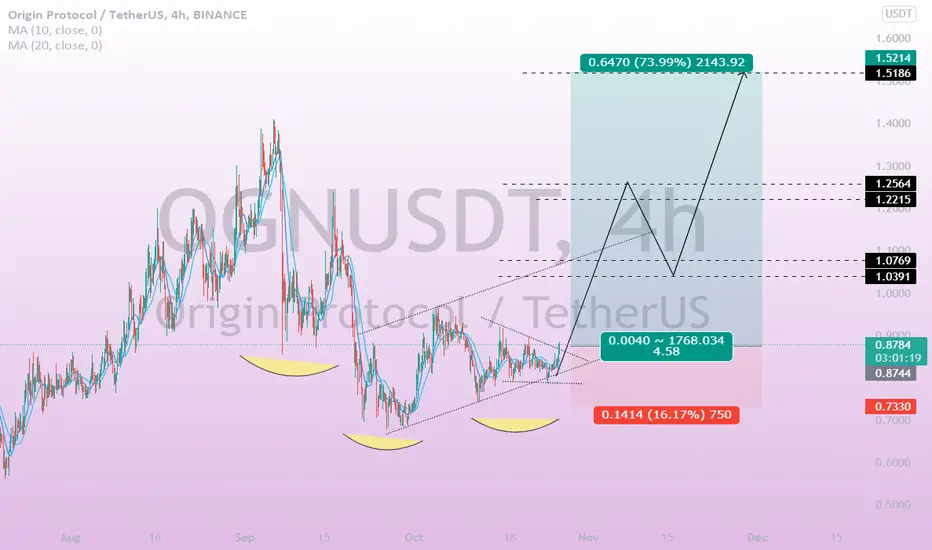
The opportunity of ONGUSDTThe opportunity of ONGUSDT
The entry point is 0.88–0.84 $
First target 1$
second target 1.2 $
third target 1.5$

OGNUSDT , Maybe we'll jump ...Hello everyone
According to the chart , we are in near support zone dynamic area , and the price was supported these days and according to the condition of market it can be jump to the target , but we should attention to money management and use stop loss for these trades .
You can buy in this price or you can wait for a little lower price and please at first take signal from the market , like hammer or ascending cover and check the chart in multi time frame then take position and buy some OGN
Follow and share us in every where you can :D :D :D :D :D
Good Luck
Abtin

ogn desending channel and triangle pattern for long ogn price is underated now . you can see desending channel in 1day and 4 hour chart and also triangle pattern in day chart .
the red line which is our support for both pattern . desending channel will be for day traders and triangle for long holders

OGNUSDT Analysis: Origin Protol before huge PUMP! OGN is under down-trend resistance.
If we manage to break through the resistance wall and confirm it in the support wall, there will be place for bullish movement.
We have Fibonacci levels ahead of us.
There is resistance in every level.
The resistance zones of this coin are perfectly connected with Fibonacci levels.
In order for the bullish movement to continue, the upcoming Fibonacci level will need to be broken through and confirmed as support so that the bullish movement can continue to the next level.
The red line shows us the Point Of Control, this is a fair price area.
When we switch to a lower time frame, the situation is clearer.
Now you need to find out, on lower time frames, what's going on inside the candles and decide whether there is a good opportunity to buy or sell.
I will discuss all the essentials with my students today and based on our Price action strategy we will look for a suitable place to enter.
Of course, all the conditions of our strategy must be met in order to increase the probability of a successful trade.

OGNUSDT OGN is also seen to be moving within a narrowing channel after a big drop. It is highly probable that the vertical lines I put at the end of this channel will go up close to their dates.
-Of course, there is no certainty, we are in a risky period in crypto, but this is my expectation.
-Practicing technical analysis charting.
-If you like my analysis, you can like and add comments. It is very important for me to improve myself. Thank you all.
-Good Luck.

OGNUSDT AnalysisHello friends.
Please support my work by clicking the LIKE button(If you liked).Thank you!
Everything on the chart.
open pos: market
target: 1.4 - 1.6 - 1.8
after first target reached move ur stop to breakeven
stop: ~0.7 (depending of ur risk). ALWAYS follow ur RM .
risk/reward 1 to 5
Good luck everyone!
Follow me on TRADINGView, if you don't want to miss my next analysis or signals.
It's not financial advice.
Dont Forget, always make your own research before to trade my ideas!
Open to your questions or suggestions(Looking for investors!).

🆓Origin Protocol (OGN) Oct-8 #OGN $OGNOGN has important support at 0.9$ zone, it could keep moving up to 1.1$, 1.4$ and 1.8$ zones. But if it loses 0.9$ zone, it will fall down sharply to 0.8$ or even 0.6$ zone in this October.
📈RED PLAN
♻️Condition : If 1-Day closes ABOVE 0.9$ zone
🔴Buy : 0.9
🔴Sell : 1.1 - 1.4 - 1.8
📉BLUE PLAN
♻️Condition : If 1-Day closes BELOW 0.9$ zone
🔵Sell : 0.9
🔵Buy : 0.8 - 0.6
❓Details
🚫Stoploss for Long : 10%
🚫Stoploss for Short : 5%
📈Red Arrow : Main Direction as RED PLAN
📉Blue Arrow : Back-Up Direction as BLUE PLAN
🟩Green zone : Support zone as BUY section
🟥Red zone : Resistance zone as SELL section
🅰️A : The Close price of 1-day candlestick is Above the zone
🅱️B : The Close price of 1-day candlestick is Below the zone

OGN Looking like an early buy with 200%+ to the upside OGN hasn't moved much compared to other alts, it is a good rr with 200%+ to the ATH. If BTC keeps the upward momentum, OGN should follow as well as after it breaks the resistance of the flag it is forming.

OGN/USDT : Reached the trendline, Attempt to break ?BINANCE:OGNUSDT
Hello everyone 😃
#OGN has reached the bearish trendline for the 2nd time.
- EMA200 ( Source : 4Hours ) is supporting the movement from below.
- Support/Breaker zone has been formed by recent wicks.
- There's sharp bullish trendline has been formed recently.
Trade setups :
- Enter LONG on a retest of broken trendline ( current bearish trendline ), SL will be located below 4H's master candle ( ~$0.8094 ).
- Enter SHORT on a retest of broken support/breaker zone, SL will be located above recent stop-hunt's wick on current zone ( ~$0.9230 ).
Attention: this isn't financial advice we are just trying to help people on their own vision.
Have a good day!
@Helical_Trades

OGN SHORT TERMsepertinya OGN akan mencoba kembali retest Trendline support, akan sangat menarik bila OGN dapat berhasil retest dan tembus strong resistennya


OGN/USDT - Potential 355% Investment SetupHello Traders!
OGN price returned to the active trading range of $0.59 - $0.87
Mid-to-long term purchases can be sought in anticipation of a continued correction of the asset.
The first part of the position can be bought in the $0.59 - $0.70 range
The second part of the position can be bought within the range of $0.36 to $0.45.
Stop-loss can be placed under the $0.30 price level.
The targets for buying will be price levels of
$1,46
$1,95
$2,35
The excellent risk-to-reward ratio for long-term buying (over 8)
Good luck and watch out for the market
P.S. This is an educational analysis that shall not be considered financial advice


OGN Technical AnalysisUsed Fib from ATH to ATL and
ATL to current high
Used trend lines to view it's channel and diagonal support and resistances.
Seems like until it breaks the red trend line, it won't become a rocket.
#NFA, #DYOR


OGNUSDT TECHNICAL ANALYSIS Bollinger signals says, it may lose value more if the candle stay below the line. The candle on the edge of up trend-line and one of the candle already break out the up trend-line. We can see symmetrical triangle over there but I can highly recommend for not trade at the moment. Wait for clear time then start your trade. Also our risk/reward ratio above 2.40 as well. Need to be really careful. If it lose value, it may go down till our support line.
“NFA”

OGN Hits major trendline going up. I recently added about 5% of my total cap into OGN. The reason being is due to the huge ascending triangle formation. Once September passes, It will pump AT LEAST 3-4x. Planning to take some profit at 3 bucks.

OGN SHORT TRY SETUPThats my plan, If the price would come to 0,8702 my order filled with 3x leverage. Or I will missed.
its just a try.
