OGN the origin of the ALT seasonAs much as I'd like to see this rallying to prev ath, i'd prefer a pull back to swing this for the whole bull run. dyor, non-finantial advice
if this harmonic plays out , expect the pull back to 1086 down to 1048/6 mid range chn area.
I missed this on 2020 wont happened this time around. will update in the comments with the projection to the upside, perhaps an explosive extended 3rd wave on the macro tf
OGNUSDT trade ideas

OGNusdt trade opportunityOGN is presenting a potential double-bottom pattern, a classic bullish reversal setup. The plan is to accumulate within the identified buyback zone while closely monitoring price action near the setup's neckline.
Confirmation of the pattern will occur upon a decisive breakout above the neckline, signaling potential continuation toward the projected target of $1.50, as illustrated on the chart.
This setup carries inherent risks, especially if the price fails to sustain above critical support levels within the buyback zone. Patience is key while awaiting confirmation of the breakout.

OGNUSDT | Buy Now, Thank Later | Near Term (4HR)OGNUSDT | Buy Now, Thank Later | Near Term (4HR)
Its Ready to Go.
BTCUSDT | Alts Poised to Explode | Near Term (2H)
MYRIAUSDT | Interested to see where this goes | Mid Term (2D)
Mock Up Price Action for VRA w/ Timeline | Mid Term (3D)
Mock Up Price Action for XCH | Mid Term (12HR)
OGNUSDT | Interested to see where this goes | Mid Term (3D)
Mock Up Price Action for CSPRUSDT | Near/Mid Term (2D)
VIDTUSDT | Interested to see where this goes | Mid Term (3D)
RAREUSDT | Interested to see where this goes | Mid Term (3D)
Mock Up Price Action for ALGOUSDT | Mid Term (12HR)

OGNUSDT | Buy Now, Thank Later | Near Term (4HR)OGNUSDT | Buy Now, Thank Later | Near Term (4HR)
Money flow... BTC, then ETH, then Large Caps, Then Mids and Smalls
Additional altcoin near term and midterm chart ideas listed below
Timeline of events for the Bull Market indicated on chart
XCHUSDT | Buy Now, Thank Later | Near Term (4HR)
VRAUSDT | Buy Now, Thank Later | Near Term (4HR)
CSPRUSDT | Buy Now, Thank Later | Near Term (4HR)
PERPUSDT | Buy Now, Thank Later | Near Term (4HR)
TLMUSDT | Buy Now, Thank Later | Near Term (4HR)
DODOUSDT | Buy Now, Thank Later | Near Term (4HR)
LPTUSDT | Buy Now, Thank Later | Near Term (4HR)
VRAUSDT | Buy Now, Thank Later | Near Term (4HR)
XCHUSDT | Buy Now, Thank Later | Near Term (4HR)
CSPRUSDT | Buy Now, Thank Later | Near Term (4HR)
VELOUSDT | Buy Now, Thank Later | Near Term (4HR)
UMAUSDT | Buy Now, Thank Later | Near Term (4HR)
OGNUSDT | Buy Now, Thank Later | Near Term (4HR)
DOTUSDT | Buy Now, Thank Later | Near Term (4HR)
VIDTUSDT | Buy Now, Thank Later | Near Term (4HR)
BTCUSDT | Alts Poised to Explode | Near Term (2H)
Mock Up Price Action for ALGOUSDT | Mid Term (12HR)
MYRIAUSDT | Interested to see where this goes | Mid Term (2D)
Mock Up Price Action for VRA w/ Timeline | Mid Term (3D)
Mock Up Price Action for XCH | Mid Term (12HR)
OGNUSDT | Interested to see where this goes | Mid Term (3D)
Mock Up Price Action for CSPRUSDT | Near/Mid Term (2D)
VIDTUSDT | Interested to see where this goes | Mid Term (3D)
RAREUSDT | Interested to see where this goes | Mid Term (3D)

OGNUSDT 1WOGN ~ 1W
#OGN This support block is a very good buy spot for now. Buy gradually on this support block with a minimum target of 20%+

Origin Protocol - Waking UP?OGN is another kind of an older coin i use to trade even before it had a USDT pair on binance.
They offer some DEFI products
Super OETH
Liquid Staking from L1 + Compounded Rewards on L2
Earn better ETH yield with Super OETH, the first Supercharged LST that earns L2 incentives on top of Beacon Chain staking rewards.
Origin Ether
Stake ETH, Stay Liquid, Earn Superior Yield
Stake any amount of ETH and receive equivalent Origin Ether. Use OETH cross-chain across DeFi to compound returns, while still earning staking yield.
Origin Dollar
Compound USD Returns Seamlessly
Earn superior stablecoin yield while retaining full capital control with Origin Dollar. Watch your OUSD balance grow with automatic reward distribution and zero lockups.
Origin ARM
Minimum risk,
better yield than LSTs
Start earning passively in our stETH Redemption Vault
TVL
$6.17M

OGNUSDT | Interested to see where this goes | Mid Term (3D)OGNUSDT | Interested to see where this goes | Mid Term (3D)
- Couldn't help but allocate some of my speculative alt funds at these levels

MYRIAUSDT | Inverse Chart, Dump Inbound | Mid Term (1W)OGNUSDT | Inverse Chart, Dump Inbound | Mid Term (1W)
The inverse chart of OGN definitely does not look like the chart of something I would buy...

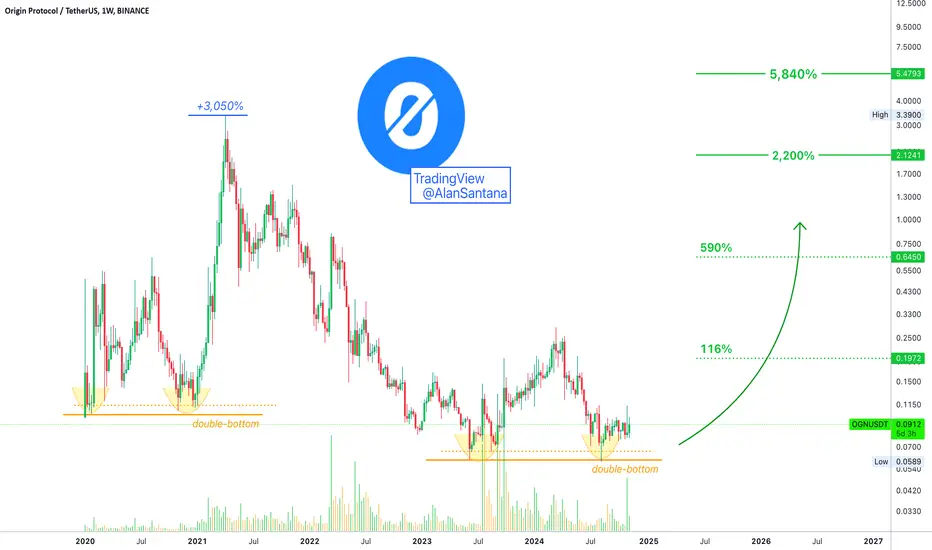
Origin Protocol 5,840% Growth Potential (Or 2,200%)Good afternoon my fellow Cryptocurrency trader, I hope you are having a wonderful day.
We are getting closer and closer... The month is November, only December left and 2025 is here. Two months and we will navigating the most bullish territory since 2021, amazing. The anticipation and excitement is starting to build up.
What are you going to do to make the most of the fact that you know Cryptocurrency will be ultra-bullish? How are you going to make money out of this information? How are you going to approach this market?
Imagine the year is 2011 and you know Bitcoin is going to boom, wouldn't you buy a load of it and hold it long-term?
Imagine the year is 2014 and you know the Altcoins are going to boom, wouldn't you make some moves in order to make the most of this knowing?
It is the year 2024 and we know that Cryptocurrency will be ultra-bullish next year, 2025, how can you best make use of this knowing, this information?
➖ Origin Protocol (OGNUSDT) is doing the same. Back in 2020/21 it produced a double-bottom and then massive growth, more than 3,000%. The second bottom resulted in high bull volume. High volume precedes the start of a major bullish wave.
➖ The same is happening now, 2023/24. OGNUSDT produced a double-bottom and we know growth is coming in 2025. We are seeing high bull volume now.
Growth potential can go to 2,200% easily and even up to 5,800% with a new All-Time High. Many opportunities like this will be available all across the Cryptocurrency market. Many pairs grew many times more in 2023/24. If some projects can grow 5,000%, 7,000%, 9,000% and even 15,000% within a neutral year, what happens when the full-blown bull-market comes?
It will be wild.
What are you going to do now to make sure you are on the winning side when prices go up?
Thanks a lot for your continued support.
Namaste.
Origin Protocol (OGN) to $3On the above 3-day chart price action has corrected 98% since April 2021. A number of reasons now exist to be long, including:
1) Price action and RSI resistance breakouts.
2) Trend reversal. Higher highs higher lows replace lower highs lower lows.
3) Support and resistance. (Orange circles). Look left. Price action confirms support on past resistance, which is also legacy support.
4) Strong positive divergence between price action and the oscillators.
5) The falling wedge is a reliable chart pattern for forecasting future targets. A measured move from the lowest to the highest touch points (blue circles) inside the wedge is taken to forecast future price action. From the breakout point the target is $3.
6) Has a USD-BTC score of 35-21. Some of you know what this means, some of you don’t!
Is it possible price action corrects further? Sure.
Is it probable? No.
Ww
Type: trade
Risk: <= 6%
Timeframe for long: Yesterday
Return: 20-30x depending on entry

Origin Protocol: Interesting?Origin wants to make it easier for people to buy and sell goods or services directly with each other, cutting out the middleman. This means you could rent out your car, sell your art, or offer any service without needing traditional platforms that take a cut of your earnings.
Origin uses blockchain technology to create a marketplace where transactions are peer-to-peer. This means there's no central entity controlling or taking a large fee from every transaction.
Origin has moved towards integrating DeFi elements, where financial products like loans, interest accounts, or asset trading can be done without banks, using smart contracts on the blockchain. This includes features like yield farming or staking with their token, enhancing its utility.

OGN ANALYSIS🔮 #OGN Analysis 💰💰
🌟🚀 As we can see that #OGN is trading in a symmetrical triangle and given a perfect breakout with a huge volume. But there is an instant resistance. If #OGN breaks the resistance 1 then we will see a good bullish move in few days . 🚀🚀
🔖 Current Price: $0.0940
⏳ Target Price: $0.1260
#OGN #Cryptocurrency #DYOR

OGN going down?After good volume and series of Fbuy prints, the Sell print has gotten at the right time and we can see a good dump from here or trend continuation if our sell area is breached.
DYOR
For indicator access drop a message.

OGNUSDT.4HReviewing the OGN/USDT 4-hour chart, we see a well-defined trading range that the asset has been navigating over the recent weeks. This offers a straightforward analysis with distinct levels to monitor for potential trading opportunities.
Key Observations:
Support and Resistance: The chart features two main horizontal resistance levels, 'R1' at $0.0864 and 'R2' at $0.0945. 'S1' at $0.0751 acts as the primary support, with 'S2' at a lower level not specified on the visible chart. The price is currently moving towards 'R1', suggesting a near-term bullish inclination.
Trendlines: There is an ascending trendline ('S1') that has been supporting price action since the start of this pattern. This trendline not only supports prices but also forms an ascending triangle pattern with resistance 'R1', typically a bullish setup in technical analysis.
Technical Indicators:
Stochastic RSI: This momentum oscillator is currently in the middle range, implying that there is room for the price to either ascend or descend without immediate pressure from being overbought or oversold.
MACD: Positioned slightly above the signal line, the MACD provides a mild bullish signal. However, the proximity of the lines and the near-zero histogram values call for caution, as the momentum is not strongly defined.
Strategic Approach: Given the ascending triangle pattern and the current positioning of the price near 'R1', my strategy would be to prepare for a potential breakout. A decisive close above 'R1' would likely lead to a test of 'R2', where I might consider taking profits, especially if the price shows exhaustion near this higher resistance level.
Conversely, should the price reject at 'R1' and subsequently break below the ascending trendline ('S1'), it would necessitate a reevaluation of the bullish scenario, potentially shifting focus to 'S2' as the next target for support.
Conclusion: The OGN/USDT pair presents a bullish setup that could unfold positively if the ascending triangle resolves upward. I would closely monitor the price action at 'R1' and the integrity of the trendline ('S1'). Trading should be approached with a clear risk management strategy, setting stop-loss orders below the trendline to mitigate potential losses from an unexpected downward move. As always, traders should remain vigilant to changes in market conditions that could alter the technical landscape.

OGNUSDT(OriginProtocol) Updated till 14-09-24OGNUSDT(OriginProtocol) Daily timeframe range. PA staying above 0.0917 will be more optimal here. below that is a trouble zone. a valid confirm close above 0.0917 can push it toward 0.1145. some volume can help it on that if it comes.

I'm intrigued by this one. Enough to snag a small bag and waitVery curious to see what comes of BINANCE:OGNUSDT over the next 6-10 months.

OGNUSDT is bullish in 4h time frameOGNUSDT is bullish in 4h time frame as it printing HH and HL and ready to come out from accumulation zone

OGN ANALYSIS (4H)We have a bullish CH on the chart and a strong move on the chart. The structure of OGN has recently become bullish.
We have a good support range on the chart.
If the price reaches the green range, we will look for buy/long positions.
The targets are clear on the chart.
Closing a daily candle below the invalidation level will violate the analysis
For risk management, please don't forget stop loss and capital management
When we reach the first target, save some profit and then change the stop to entry
Comment if you have any questions
Thank You


OGNUSDT is BullishPrice is consistently printing higher highs and higher lows, moreover there is no bearish divergence too on RSI, signaling that bulls are in control of the price action and new high are expected from here. Targets are mentioned on the chart.

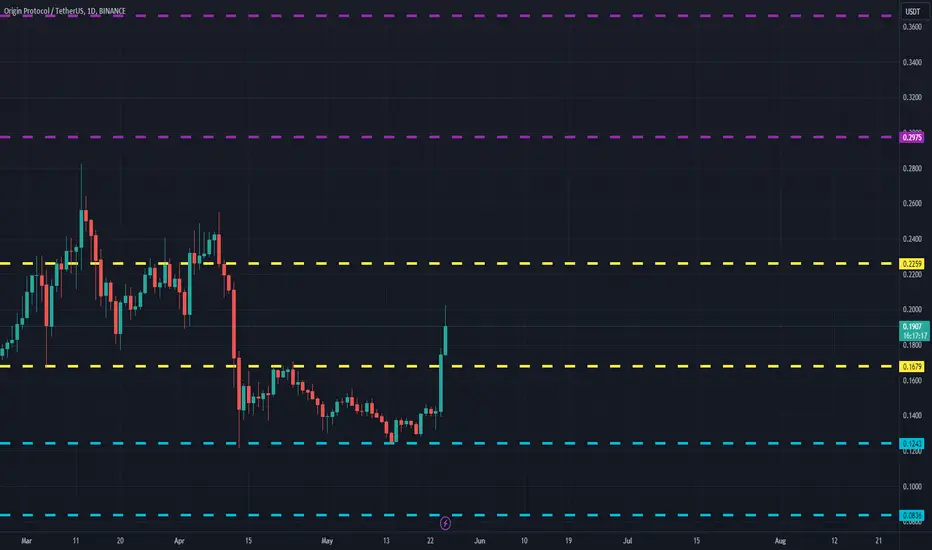
OGNUSDT(Origin Protocol) Daily tf Range Updated till 25-05-24OGNUSDT(Origin Protocol) Daily timeframe range. steadily tracing back. clean brokeout of 0.1679 and if it stays above this, it will visit 0.2259 again. a easy setup played out from swing low which is from 0.1243. smooth decent profit there.
OGN USDT Caught a perfect LONGIve been watching OGN from a few days, and on May 21, it broke out of the falling wedge. However due to BTC correction, OGN corrected a bit as well.
However, it maintained HL and I caught it so perfectly.

OGN Bounced from SupportNYSE:OGN Perfectly bounce from the support on daily TF.
I'm in Long from 0.1550 - 0.1650
Tp: 0.2250 - 0.2450 - 0.2650
Sl: 0.1100
#dyor #nfa
