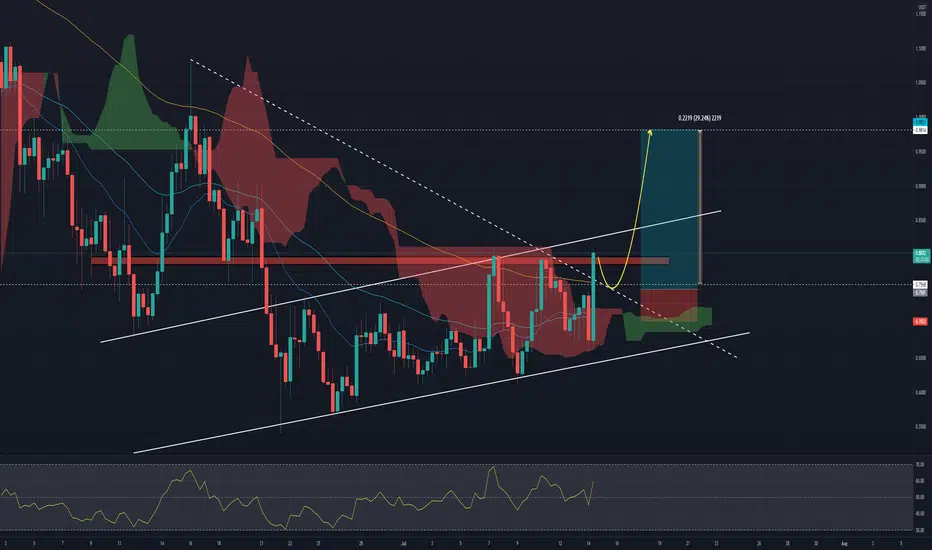
OGN NEXT POSSIBLE MOVEBINANCE:OGNUSDT
Hello Traders
Never underestimate breakouts of main resistance that been tested multiple times.
its a long term trade and it may take few weeks
a breakout above the red trendline will push the price higher
Risk/Reward : 1/3
Don't forget again that every thing depends on bitcoin's action in this market so be cautious and take your risk
OGNUSDT trade ideas


OGNUSDTDue to the valid failure of the support line
And according to the MACD and other indicators
The identified targets are touched.
Good luck.


OGN|USDT💥Hey hey my friends👋
Looking to buy a small amount in this support zone and then more on a confirmed breakout of the trendline...
Solid project and solid NFT|DEFI news coming to OGN it should move nicely

OGNUSDTPERENJ 3 Targets Hit :boom: (+12% Profit) :pro_check:
SAND All Targets Hit :boom: (+20% Profit)
MANA hit all targets :pro_check:
:boom: (+37% Profit) :pro_check:
MATIC hit 2 targets :boom: (+4% Profit) :pro_check:
LINK USDT T 2 :dart: :pro_check: (+10% Profit)
GRT USDT T2 :pro_check:
(+10% Profit)
RUNE 2 Targets Hit :pro_check:
(+9% Profit)
SRM 2 Targets Hit (+7% Profit) :pro_check:
RUNE 2 Targets hit (10% Profit) :pro_check:
GTC 2 Targets gut (8% Profit) :pro_check:
SAND Targets Hit (+20% Profit) :pro_check:
SUSHI :pro_check: (+27% Profit)
THETA 2 targets hit (+10% Profit)
XLM Targets hit :pro_check: (+95% Profit)
GTC Targets hit :pro_check: (+30% Profit)
ALPHA Hit all targets (+30% Profit) :pro_check:
CELR Hit 2 targets (+8% Profit) :pro_check:
ALICE Hit all targets (+33% Profit) :pro_check:
SUSHI All targets done :pro_check: (+30% Profit)
XEMUSDT 2 Targets done :pro_check: (+10% Profit)
DOGE All Targets done :pro_check: (+80% Profit)
DOT SL Hit (-56% :red_square: )

New ATHs coming for $OGN?$OGN bounced off the .50 fib retracement from last cycle and currently consolidating. The 3-day MACD flipped green for the first time since it's last run of 22.5x. If this occurs, there's potential for it to reach $16.73 as this is the 1.618 fib level of last cycle. This is one of the lowest market-cap coins on Coinbase with some notable investors (Founder of Youtube, Reddit Founder and partner at Y combinator).


OGNUSDTHello to you all. Mars Signals team wishes you high profits at all times.
We are in daily time frame. As you can see, after the fall and failure of the current support line, the price has been able to appear above the support line with a strong candlestick, and we intend the price to reach our target. In case of re-falling below the support line, we consider more fall.
Warning: This is just a suggestion to you and we do not guarantee profits.
Wish you luck!

OGN/USDT LONGAccumulation going on, price has been ranging and price currently close below the support to clear liquidity and close back inside. the retest of the first support and the second support has been marked as entry respectively. Always apply risk management and stop loss.


Ascending Triangle / OGNUSDTOGN has formed an ascending triangle, with a support-trendline that holds from early 2021. This could be a good entry point for a potential 2x (nearly).
As for the resistance (in yellow), we can see that it was hit mid March for the first time, it held, then it was broken at the end of March. It then became a support and held in late April, then it was broken mid May. It became once again resistance and held 10 days after in late May.
In the end, we can observe how the 1.50-1.40 range is a the only well-respected price point in the entire chart. I’m expecting a rally from the current price to that target at any time in the next months.
As always, the idea might be invalidated depending on how BTC acts.
Good luck, and stay safe!
Not financial advice.


OGNUSDT BearishOGNUSDT create hidden bearish Divergence, So a little bit correction & Than a big Fly!

OGN > Trendline Support > To the Moon?Hello Friends,
Hope you all are having a thrill in your trading journey.
I am presenting you my analysis of OGN.
According to my technical analysis, Origin is following a strict trendline. So, I am long on it.
Origin broke the trendline resistance and after a retest, it following trendline support to go up.
"My analysis is valid until We don't see a breakout from trendline"
I hope my analysis is pretty clear to you guys.
Kindly do your own research and follow proper risk management.
Feel free to share your views in the comment section. Like and Follow!
Best Regards,
Shaswat Naman
TradeThrill, India🇮🇳
Disclaimer: The analysis provided is purely informative and it should not be used as financial advice. Remember that you need a plan before you start trading; so, take this knowledge and use it as a guidebook that will ultimately help you understand the market and easily predict your next move.

OGN / USDT AnalysisOGN / USDT
OGN is on critical support
It still hold uptrend line since beginning of 2021
If bulls continue hold current support expecting pump soon
If uptrend line lost we go to re-accumulation zone again and price will consolidate for a long time
This idea just analysis for educational purposes
not a financial advice for buying or selling
Best of wishes

#OGN break out of the triangle in the ascending channel OGNUSDT
It's almost close to the top of the channel and strong resistance
it's going to pump more than 25%

OGN > Double Top? > Support and Resistance/Trendline Breakout!Hello Friends,
Hope you all are having a thrill in your trading journey.
I am presenting you my analysis of OGN.
According to my technical analysis, OGN is going down after a Double-Top. So, I am short on OGN.
"My analysis is valid until we don't see a breakout from resistance"
I hope my analysis is pretty clear to you guys.
Kindly do your own research and follow proper risk management.
Feel free to share your views in the comment section. Like and Follow!
Best Regards,
Shaswat Naman
TradeThrill, India🇮🇳
Disclaimer: The analysis provided is purely informative and it should not be used as financial advice. Remember that you need a plan before you start trading; so, take this knowledge and use it as a guidebook that will ultimately help you understand the market and easily predict your next move.


OGN/USDT$OGN Ready to fly , A weak penetration, so it is better to sell everything at the resistance region

