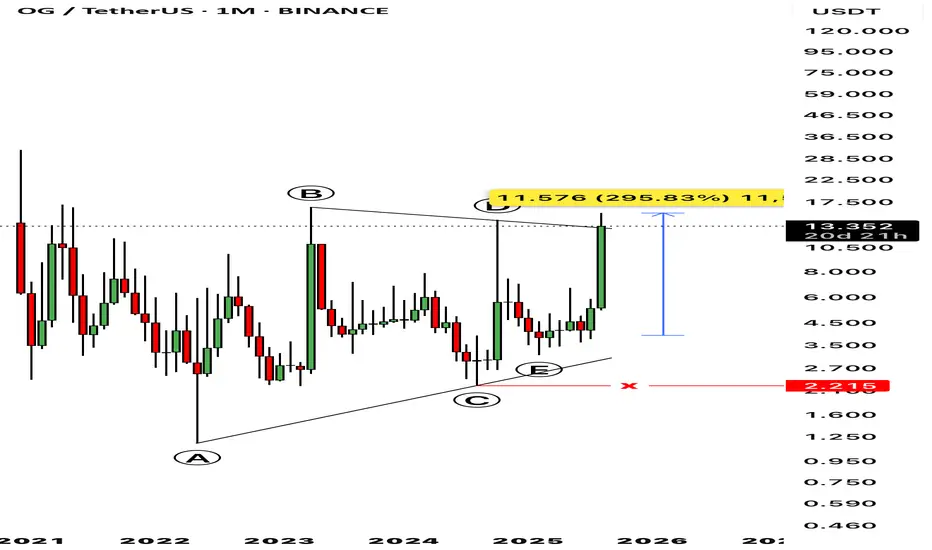
OG more than 4 years of accumulation!OG / USDT
Price is playing in long term accumulation between 2$ as support and 14$/16$ as resistance
Every time price hit resistance zone it rejected hard but once again we see another try to breakout with big volume
Breakout here and we will see fireworks
Keep an eye on it
Related pairs

OG Strong Chart Will Yield 888% Profits Within 6 MonthsI had to choose between this one and Milan's fan token. I went with this one because the chart is different. Milan (ACMUSDT) has the same chart as Atlético de Madrid (ATMUSDT). So you know what to look for there and you can also know now that ACMUSDT too is also bullish and coming out of major marke

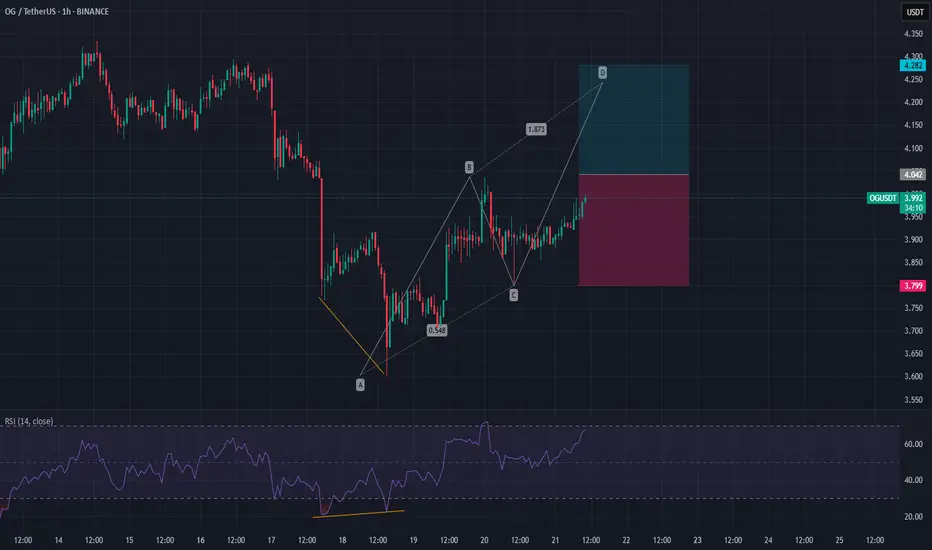
OG Bearish DivergenceBINANCE:OGUSDT
Trade Setup:
Target 1: 6.714(0.786 Fibonnaci Golden Zone).
Target 2: 6.051 (0.618 Fibonnaci Golden Zone).
Target 3: 5.584 (0.5 Fibonnaci Golden Zone).
Target 4: 3.609 (0 Fibonnaci).
DCA : 8.093 (1.135 Fibonacci)
Stop Loss: 8.635 (1.272 Fibonacci).
RSI Analysis: The RSI is showin

$OG Bearish DivergenceBINANCE:OGUSDT
Trade Setup:
Target 1: 12.422 (0.786 Fibonnaci Golden Zone).
Target 2: 10.976 (0.618 Fibonnaci Golden Zone).
Target 3: 9.959 (0.5 Fibonnaci Golden Zone).
Target 4: 5.654 (0 Fibonnaci).
DCA : 15.427 (1.135 Fibonacci)
Stop Loss: 16.607 (1.272 Fibonacci).
RSI Analysis: The RSI is s

OG/USDT update for the previous analysis Eventually OGUSDT chart has successfully moved uptrend strongly exactly as per my previous analysis (6 months earlier), the result is awesome, almost like 3X spot profits. To see the previous analysis please visit my profile.
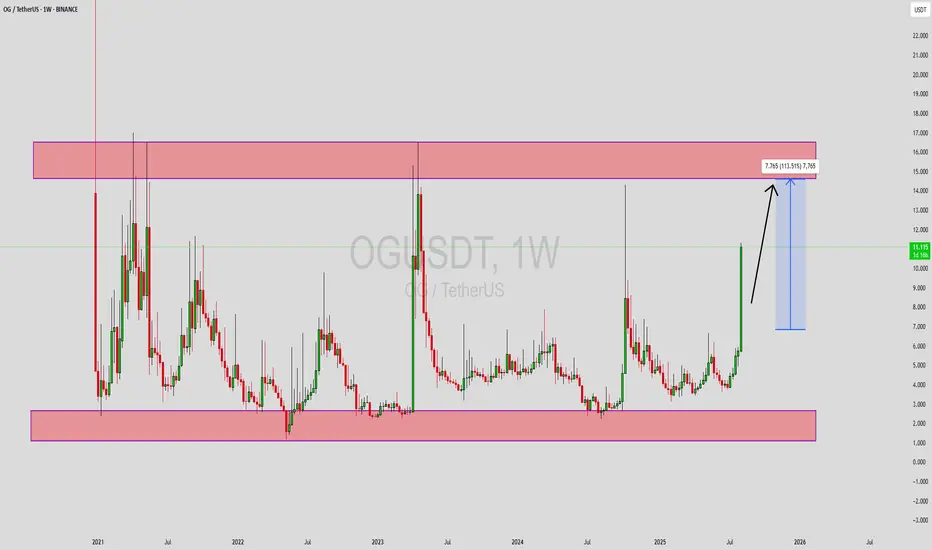
OGUSDT Forming Bullish MomentumOGUSDT is staging a compelling breakout from a multi-year range, with price now pushing sharply higher and well above a key resistance zone. The weekly chart reveals a large rectangular range defined by significant long-term support below and supply above, and OG has decisively broken the upper band
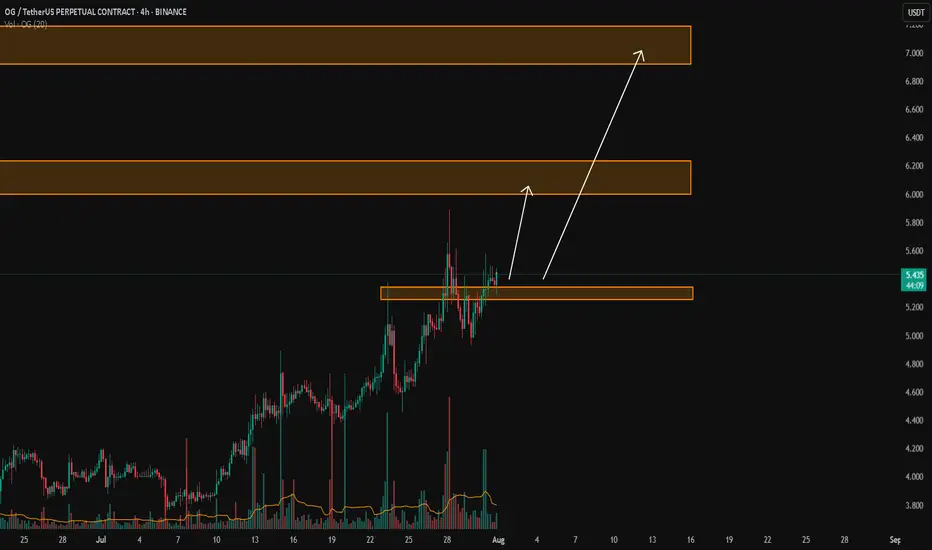
OG/USDTKey Level Zone: 5.250 - 5.340
LMT v2.0 detected.
The setup looks promising—price previously trended upward with rising volume and momentum, then retested this zone cleanly. This presents an excellent reward-to-risk opportunity if momentum continues to align.
Introducing LMT (Levels & Momentum Trad
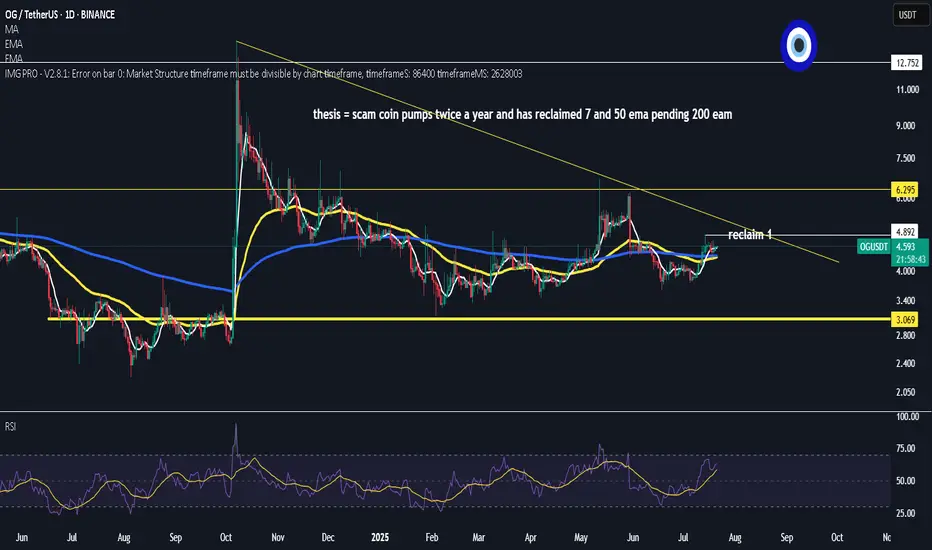
$OG fan token
scam coin as they all are till we progress as an industry and adoption picks up
for now low cap rotation play
above all ema's
50 ema 1-2 days to cross 200
golden cross
BTFD mode
using low leverage
risking $1 to make $10-$12
rsi looking nice.. dominance has some way to go down
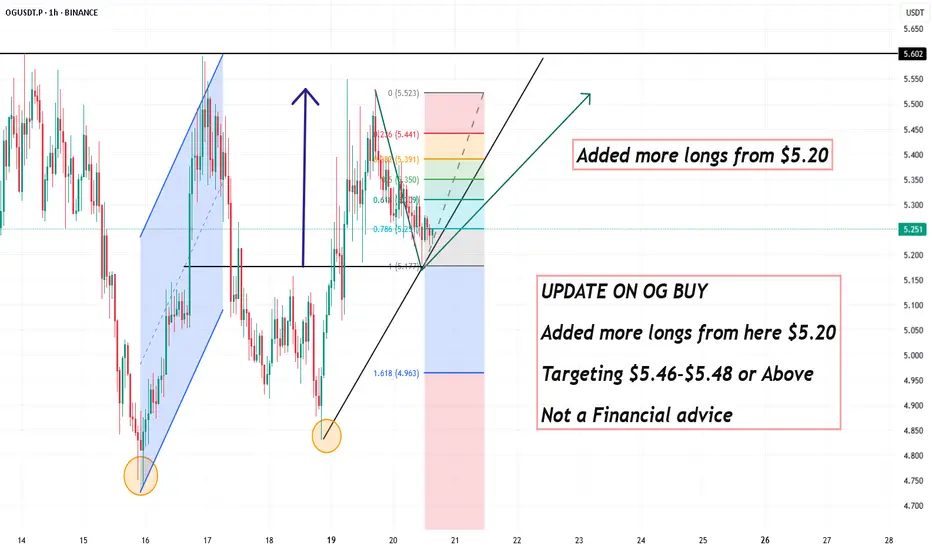
UPDATE ON OG BUY ,More Longs from $5.20UPDATE ON OG BUY
Added more longs from here $5.20
Targeting $5.46-$5.48 or Above
Its Not a Financial advice
See all ideas
Summarizing what the indicators are suggesting.
Oscillators
Neutral
SellBuy
Strong sellStrong buy
Strong sellSellNeutralBuyStrong buy
Oscillators
Neutral
SellBuy
Strong sellStrong buy
Strong sellSellNeutralBuyStrong buy
Summary
Neutral
SellBuy
Strong sellStrong buy
Strong sellSellNeutralBuyStrong buy
Summary
Neutral
SellBuy
Strong sellStrong buy
Strong sellSellNeutralBuyStrong buy
Summary
Neutral
SellBuy
Strong sellStrong buy
Strong sellSellNeutralBuyStrong buy
Moving Averages
Neutral
SellBuy
Strong sellStrong buy
Strong sellSellNeutralBuyStrong buy
Moving Averages
Neutral
SellBuy
Strong sellStrong buy
Strong sellSellNeutralBuyStrong buy
Displays a symbol's price movements over previous years to identify recurring trends.
Frequently Asked Questions
The current price of OG / USDT (OG) is 13.479 USDT — it has fallen −0.44% in the past 24 hours. Try placing this info into the context by checking out what coins are also gaining and losing at the moment and seeing OG price chart.
OG / USDT price has risen by 126.21% over the last week, its month performance shows a 193.43% increase, and as for the last year, OG / USDT has increased by 406.54%. See more dynamics on OG price chart.
Keep track of coins' changes with our Crypto Coins Heatmap.
Keep track of coins' changes with our Crypto Coins Heatmap.
OG / USDT (OG) reached its highest price on Apr 9, 2021 — it amounted to 16.851 USDT. Find more insights on the OG price chart.
See the list of crypto gainers and choose what best fits your strategy.
See the list of crypto gainers and choose what best fits your strategy.
OG / USDT (OG) reached the lowest price of 1.160 USDT on May 12, 2022. View more OG / USDT dynamics on the price chart.
See the list of crypto losers to find unexpected opportunities.
See the list of crypto losers to find unexpected opportunities.
The safest choice when buying OG is to go to a well-known crypto exchange. Some of the popular names are Binance, Coinbase, Kraken. But you'll have to find a reliable broker and create an account first. You can trade OG right from TradingView charts — just choose a broker and connect to your account.
Crypto markets are famous for their volatility, so one should study all the available stats before adding crypto assets to their portfolio. Very often it's technical analysis that comes in handy. We prepared technical ratings for OG / USDT (OG): today its technical analysis shows the buy signal, and according to the 1 week rating OG shows the strong buy signal. And you'd better dig deeper and study 1 month rating too — it's strong buy. Find inspiration in OG / USDT trading ideas and keep track of what's moving crypto markets with our crypto news feed.
OG / USDT (OG) is just as reliable as any other crypto asset — this corner of the world market is highly volatile. Today, for instance, OG / USDT is estimated as 15.05% volatile. The only thing it means is that you must prepare and examine all available information before making a decision. And if you're not sure about OG / USDT, you can find more inspiration in our curated watchlists.
You can discuss OG / USDT (OG) with other users in our public chats, Minds or in the comments to Ideas.