OGUSDT trade ideas
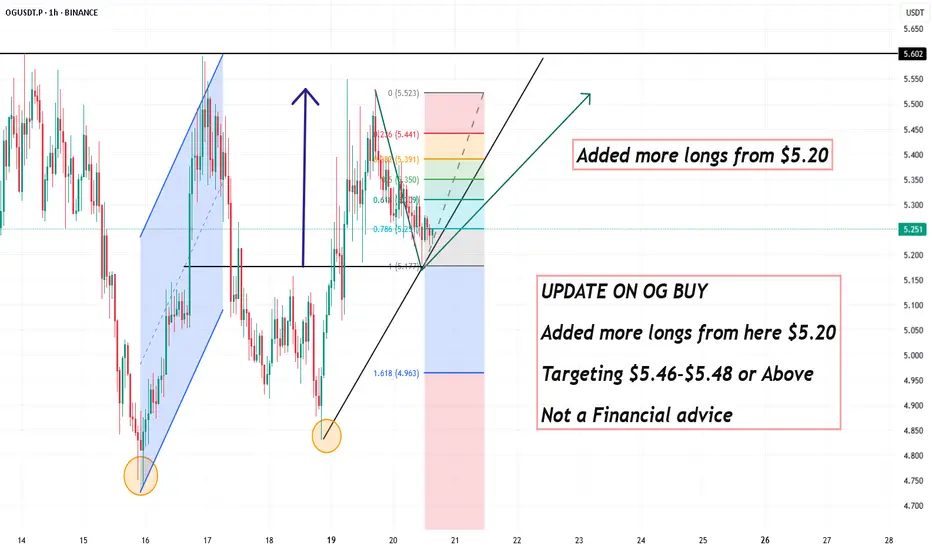
UPDATE ON OG BUY ,More Longs from $5.20UPDATE ON OG BUY
Added more longs from here $5.20
Targeting $5.46-$5.48 or Above
Its Not a Financial advice
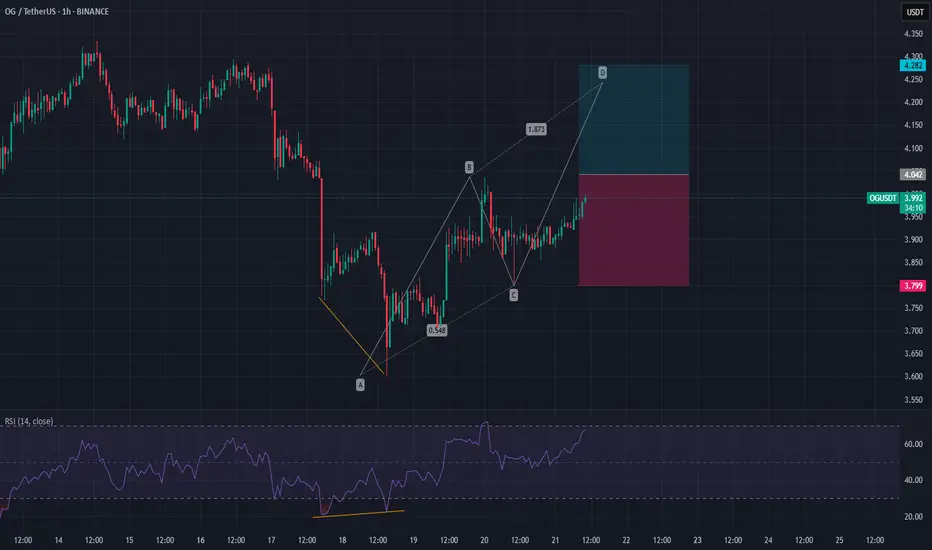
OG PERPETUAL TRADE ,Bought From $5.34OG PERPETUAL TRADE
OG BUY SETUP
Currently $5.34
Bought From $5.34
(Trading plan If OG go down to $5.15
will add more longs)
Expecting target $5.48 OR ABOVE
Incase of early exist will update this anaylsis
Its not a Financial advice

OG ANALYSIS📊 #OG Analysis
✅There is a formation of Descending Channel Pattern in daily time frame in #OG .
Also there is a perfect breakout and retest. Now we can expect a bullish move. If the price successful retest the major support zone then we will see more bullish move
👀Current Price: $5.226
🎯 Target Price : $6.152
⚡️What to do ?
👀Keep an eye on #OG price action and volume. We can trade according to the chart and make some profits⚡️⚡️
#OG #Cryptocurrency #Breakout #TechnicalAnalysis #DYOR

OG Strong Chart Will Yield 888% Profits Within 6 MonthsI had to choose between this one and Milan's fan token. I went with this one because the chart is different. Milan (ACMUSDT) has the same chart as Atlético de Madrid (ATMUSDT). So you know what to look for there and you can also know now that ACMUSDT too is also bullish and coming out of major market bottom and low.
OG's chart is much more different though, the bottom was hit in May 2022 with a long-term higher low in August 2024 and another higher low on the 3rd of February 2025. This is a strong pair based on TA and guess what? It is ready now for a new wave of growth.
"Higher lows lead to higher highs," is a saying that I like to repeat over and over because it sounds nice. It doesn't necessarily have to be true but it will be true this time.
Most of the Altcoins produced a lower low in April compared to February or March, the fact that OGUSDT produced a higher low in April is a signal strength. This is enough to support a bullish wave.
The four weeks of bullish consolidation (prices moving slowly higher and the sessions closing green) supports the higher low signal.
Low volume in this instance —context is always needed for a signal to be interpreted correctly—means that the real action is yet to start. Not that the "growth is weak" but rather that there is no growth yet. So this is a positive signal. The fact that the market isn't dropping and is slowly growing and consolidating will lead to a strong bullish jump.
Ok. The technical analysis and signals are in place.
Now that we are done with the technological jargon we can move to the part we like most, take profits targets (TP for short).
Spoiler alert! I use the fibonacci tool to extract my targets against all other methods because this has been proven the most accurate over the years. Period.
» The purple target at ~$43 can yield 888% profits.
» The red target at $32 can yield 634% profits.
» The blue target at $21 can give an easy 380% profits if you were to buy at the current price and sell when this target hits.
Will these target hit or will they miss?
Just wait and see.
I can assure you that the market will turn green. That's all that matters to me.
It matters to me to give you a great entry price and great timing.
You are the one that should focus on securing your profits, it is a win-win-win.
Abundance, love, wealth, health and peace.
Thanks for being with me.
When I am gone, you will miss me.
Namaste.

OG ANALYSIS🔮 #OG Analysis 🚀🚀 Update
💲 #OG is trading in a Rising Broadening Wedge Pattern and currently retesting the major support zone. Now we can expect a bullish move after the retesting of support zone.
⁉️ What to do?
- We have marked crucial levels in the chart . We can trade according to the chart and make some profits. 🚀💸
#OG #Cryptocurrency #DYOR

OG usdtif Green Line broke will be chance to touch blue line
other down trend will start after the Red Line

OGUSDT CHART ANALYSİS - EDUCATİONAL POSTDiscover what an NFT is and what all the hype is that's surrounding the space.
An NFT, or non-fungible token, is a unique, digital certificate stored on a blockchain. This guarantees the originality of any item, giving the owner exclusive rights to it. Such tokens cannot be discreetly tampered with, split, or replaced because of the nature of the blockchain structure and anonymous encryption technology.
Therefore, this system is best suited for securing rights to a unique object — a work of art, real estate, an artifact in a computer game, or something similar. This article will help you understand the peculiarities of the NFT concept and learn about the most expensive and unusual non-fungible tokens since their creation.

A Remarkable Technical Pattern on OG/USDT PairOG/USDT pair has almost finished a major triangle pattern according to Elliott Wave Principle as you can see in 1W Chart. If this analysis has gone right, there will be a massive bullish wave that may exceed 2X from the current price.
Not a financial advice

OGUSDT 45%-50% Gains – Bullish Momentum in PlayOGUSDT has recently broken out of a Falling Wedge Pattern, signaling the potential for significant upward movement. A Falling Wedge is a bullish continuation pattern that typically occurs during a downtrend and indicates a reversal once the price breaks through the upper boundary of the wedge. In the case of OGUSDT, the breakout has already occurred, and with good volume supporting the move, the price is poised for a potential rally. Traders are now eyeing a 45% to 50%+ gain as the breakout continues to unfold, with expectations of strong momentum pushing the price higher.
The Falling Wedge Pattern in OGUSDT has been accompanied by increasing volume, which adds validity to the breakout. Volume is a key factor in confirming the strength of the move, and with more investors entering the market, the upward momentum is likely to continue. As the price breaks above the resistance line of the wedge, it often leads to a sharp surge, providing a solid opportunity for traders to profit from the move. The price could continue to climb towards the next resistance levels, offering substantial returns for those positioned in the trade.
Investor interest in OGUSDT is on the rise, and the successful breakout from the Falling Wedge is one of the main reasons for the growing attention. This technical setup indicates that the market sentiment is shifting from bearish to bullish, with buyers now in control. As the price continues to build on the breakout, traders are anticipating further price action that could lead to a strong rally. The projected 45% to 50%+ gain is a realistic target if the breakout holds and the bullish trend continues to develop.
As always, it is important for traders to monitor key levels of support and resistance to gauge the strength of the trend. The next few days or weeks will be crucial in determining whether OGUSDT can maintain its upward trajectory and reach the expected gains. With good volume, solid investor interest, and a well-formed technical setup, OGUSDT is one of the more promising crypto pairs to watch for a potential breakout and substantial profits.

Stable purchases on OGFollowing the alpaca testing, OG is ready to give a similar picture with an attempt to overtake the previous impulse. The previous impulse has already rechecked the opening level of the year with a local overlap, which opens the way for a test of levels 6 and 7.5. With the current market and the continuing likelihood of a new general drawdown, we are unlikely to see a hike above 6 on the first attempt. On the eve of passing through the middle of the quarter in the next two or three days, there is a high probability of a breakdown attempt of 5 with a stable continuation of the trend until the end of the month. With a more negative market, the volatility of the token may not be sufficient for a breakdown, in which case the probability of smooth growth prevails until the end of the month with a chance to open a new monthly candle above 5.
In the medium term, the token remains a reliable tool for storing funds, as the year opened above the 4.75 support near the key level for volatility growth of 5. Such an opening gives a flat signal for a retest of loyals due to an opening below 5, but also an exit to the 5-7.5 range in the medium term due to an opening above 4.75. Full-time support for a reversal With the current market, it is 3.5, from which there is a probability of a trend up to 7.5+ before the summer. There is a possibility of a test of a lower level of 2.5, but this will happen only in an extremely negative market with a drawdown of bitcoin by 75k or ether by 1500-1750. In this scenario, the token is likely to remain fairly stable and will give a smaller drawdown relative to the rest of the altcoin market, providing an excellent opportunity for topping up.
Along with og, vidt vib PDAs occupy an interesting position, which I primarily consider for storing funds in the mid-range due to the opening of the annual candle above key levels, which gives a signal for its bullish reversal in the future. The main goal for them, similar to alpaca and og, is so far a retest of the opening of the year followed by a rollback.
I am also considering uft wing slf burger ast quick pivx for scalping with a continuing growth potential of up to 30-50%.
Coins with the tag monitoring vite hard cream amb troy with a growth potential of up to 100%+ also retain a high potential for breakouts. Let me remind you that when working with these assets, I recommend keeping a short stop under the price in the first half of the week until noon to insure against delisting, or to hire them from the middle of the week.

OGUSDT %180 Daily Volume Spike | Watch Out!OGUSDT Analysis: Carefully Selected Blue Boxes
OGUSDT has seen a 182% daily volume increase , signaling heightened activity. While the chart appears volatile, I’ve marked blue boxes as logical and carefully chosen zones for potential entries.
Key Points:
Blue Boxes: These areas are determined using tools like volume footprint, volume profile, cumulative delta volume (CDV), and liquidity heatmaps .
Risk Management: Current market conditions are uncertain. Employ cautious and well-structured risk management.
Confirmation Indicators: Entries should be validated with CDV, liquidity heatmaps, volume profiles, volume footprints (with evident buyer activity), and upward market structure breaks in lower time frames .
If this analysis helps you, please don't forget to boost and comment. Your support motivates me to share more!
If you think this analysis helps you, please don't forget to boost and comment on this. These motivate me to share more insights with you!
I keep my charts clean and simple because I believe clarity leads to better decisions.
My approach is built on years of experience and a solid track record. I don’t claim to know it all, but I’m confident in my ability to spot high-probability setups.
If you would like to learn how to use the heatmap, cumulative volume delta and volume footprint techniques that I use below to determine very accurate demand regions, you can send me a private message. I help anyone who wants it completely free of charge.
My Previous Analysis (the list is long but I think it's kinda good : )
🎯 ZENUSDT.P: Patience & Profitability | %230 Reaction from the Sniper Entry
🐶 DOGEUSDT.P: Next Move
🎨 RENDERUSDT.P: Opportunity of the Month
💎 ETHUSDT.P: Where to Retrace
🟢 BNBUSDT.P: Potential Surge
📊 BTC Dominance: Reaction Zone
🌊 WAVESUSDT.P: Demand Zone Potential
🟣 UNIUSDT.P: Long-Term Trade
🔵 XRPUSDT.P: Entry Zones
🔗 LINKUSDT.P: Follow The River
📈 BTCUSDT.P: Two Key Demand Zones
🟩 POLUSDT: Bullish Momentum
🌟 PENDLEUSDT.P: Where Opportunity Meets Precision
🔥 BTCUSDT.P: Liquidation of Highly Leveraged Longs
🌊 SOLUSDT.P: SOL's Dip - Your Opportunity
🐸 1000PEPEUSDT.P: Prime Bounce Zone Unlocked
🚀 ETHUSDT.P: Set to Explode - Don't Miss This Game Changer
🤖 IQUSDT: Smart Plan
⚡️ PONDUSDT: A Trade Not Taken Is Better Than a Losing One
💼 STMXUSDT: 2 Buying Areas
🐢 TURBOUSDT: Buy Zones and Buyer Presence
🌍 ICPUSDT.P: Massive Upside Potential | Check the Trade Update For Seeing Results
🟠 IDEXUSDT: Spot Buy Area | %26 Profit if You Trade with MSB
📌 USUALUSDT: Buyers Are Active + %70 Profit in Total
🌟 FORTHUSDT: Sniper Entry +%26 Reaction
🐳 QKCUSDT: Sniper Entry +%57 Reaction
📊 BTC.D: Retest of Key Area Highly Likely
I stopped adding to the list because it's kinda tiring to add 5-10 charts in every move but you can check my profile and see that it goes on..

OG is trying to return to the trendTo date, the market has consolidated in anticipation of passing the middle of the month and determining the direction for the end of the year. The decision on the US interest rate may have a big impact. But for now, there is still an opportunity for the growth of individual coins with technical signals. TROY is showing itself well, aiming for a breakout of 0.0075. But in this article I want to consider OG, which from the second bottom at the key support of $ 5 can give a trend and catch up with TROY in dynamics. With a successful exit above the previously formed trend line, the nearest target will be a test of the 7.5-9 range. With a successful opening of the second half of the month above 7.5, you can expect the trend to consolidate and further overshoot. For now, the pressure of the unprocessed targets of the bears at 3000-3100 on the ether and 75-85k on the cue ball remains, in connection with which a new wave of sales at the change of the week may be deeper, with a payback after the decision on the US interest rate, in case the dollar weakens. In this negative scenario, OG can test $3.5-$4 where it will be possible to make a top-up, as it was possible to do with TROY. In the medium term, both TROY and OG are good tools with probable.
VIB also gave a new opportunity to re-buy profitably, which, in an optimistic scenario, can turn a weekly candle into a bullish one in order to continue the trend by 0.15 due to the opening of the week above 0.1.


OG is looking good to bullish rally "Fear of Missing the Party". This is what mostly encourage over trading and also get you in too early. The solution is to use a filter, which is a fancy way of saying , wait a few bars before you start to dance 💃🏻 . if a Trade worth taking, Waiting for price to confirm your analysis 📈 will not affect your profit that much. The key takeaway here is that, you should rather miss opportunity than to suffer a loss because there will always be another opportunity. 🙌🏻

$OG- Daily Bullish PullSEED_ALEXDRAYM_SHORTINTEREST2:OG - Daily Bullish pull on the D chart. Lower Bollinger squeezed for a pull on top. #DYOR ofcourse.

OGUSDT good volume on 4HOG still has good upward volume on the 4H chart. However, on the 1H chart, volume is weakening, indicating buying weakness. One could enter during the dip at 8.3 and 7.5 before it potentially goes up to 14. In my opinion, this is highly likely, but anything can happen in the market as crypto is very volatile. Manage your risk properly.

OG can Rebound with 50% to 150% in next weekit seems the coin in accumulation zone
and can rebound anytime from now and achieve 50% at least
Buying zone from support area around $6.5 to $7.5
Targets
$8.5
$9.5
$11
$15

$OGThis graph contains two sequences.
The green sequence is part of the yellow sequence.
The yellow sequence has not been activated yet. It will be activated when the chart passes the price of 7.04
The green sequence was activated at the price of 8.1204. Then the coin went a good CC way, made a retest of the activation level and started moving into the sell zone from 7.0332 to 6.4883.
After that, a full correction of the entire green sequence movement is expected
Translated with DeepL.com (free version)

OG outlookOG looks to have pumped hard, and now price seems to be coming back down to where market collectively thinks it should be.
Feels like price can come back some more before buying pressure comes back in to push it up, but if it doesn't make a HH, I think price will come back down to POC, at least before resuming any macro bullish trend.
First time looking at this chart so no fundamentals here at all, purely chart patterns. #NFA, #DYOR.

OG Fan Token Grows 175% In Four Days (Chart Analysis)Let's review this chart so that we can see what is coming to the rest of the Altcoins market. The dynamics here are the same as with the other pairs that I've been sharing with you.
OG Fan Token (OGUSDT) hit a major low in July 2024, the bottom came in August.
After this bottom, we have higher lows in September, slowly rising, and after one final drop in early October we see strong bullish action.
The whole bottom process lasted 110 days, almost 4 months. This is where we can see that patience is key. A person holding this pair can decide to sell after three months on the October higher low, and the next day we have massive growth.
Seven months of bearish action were deleted in four days, again, patience is key.
The other Altcoins we have been looking at have the same chart.
➖ A low in July or August 2024.
➖ Higher low in September (some have lower low but this is irrelevant).
➖ Consolidation moving higher slowly and finally the bullish breakout.
➢ We are set to experience strong bullish breakouts like this one all across the market.
I am wishing you success.
Thank you for reading.
Namaste.

ↀ OGUSDT going up 10-20%, pump detected with 99% hit rateHi Traders,
There are multiple signals that came out of the pump algo that I developed. Today I'm going to share a few of them that the system detected over the past few days. First up is OGU.
If this is the first time you are reading about my pump signals, I will provide more details at the bottom so you know what this is based off of. Now to the signal itself.
OGU signal is from yesterday at 8pm. The signal comes with two targets as you can see on the chart.
Addition to the signal, we can apply some technical analysis to see what's going on with this asset:
ORI indicator is showing a healthy bullish trend.
ORI black trend signal line has crossed over the green fast MA and is above the slow MA. Also the green MA and black trend signal trend lines have crossed the down trend line.
Starting to see an increase in volume
Greep pips to you 🤑
-------------------
What are pump signals
The algo detects unusual volume activity and buying pressure across multiple time periods. Here are some details analysis of these signals.
Average Gain to Target 1: 17.7%
Average Time to Target 1: 8 days
Median Time to Clear Target 1: 6 days
80th Percentile Time to Clear Target 1: 16 days
Win Rate Target 1: 94.9%
Win Rate of Either Target: 95.3%
Total Signals: 8515
First Signal At: September 2022
How to trade them
You can apply some TA to time your entry. As you can see from the pumps stats, it takes a few days to weeks for them to hit. We get the 95% average hit rate across all signals within 30 days so there can be a large time window. I like to split my alt-coin capital into 20 parts and spread them across multiple signals. My exit is time based and clearing of most signals. The worst case, when traded this way, I see 18% average gain per month. The capital doubles roughly every 5 months.
Final note
It takes time for me to post these so I will be posting them on TV rarely when I have the time and often with a delay.
As always, please trade at your own risk. This is all meant to be educational.

OGUSDT (OGFanToken) Updated till 06-10-24OGUSDT (OGFanToken) Daily timeframe range. finally it got out of its local low. now aiming at 5.355 depends on retail interest if it can push through. atleast staying above 4.116 can give it more chances. recent support at 3.283.
