OG Waves completed 🔴We did not expect this sudden drop due to the whales’ manipulation of Bitcoin yesterday, which made all currencies hit the speculators’ stop loss, which made the drop strong. What matters to us is the OG coin, which has not yet risen due to its big correction. Through my analysis, we see that the ABC wave impulse has This is why we hope the currency will rise in the next few days
OGUSDT trade ideas

OG Fan Token (OG) formed bullish Gartley for upto 23.50% pumpHi dear friends, hope you are well and welcome to the new trade setup of OG Fan Token (OG) with US Dollar pair.
Previously we caught nice pump of OG as below:
Now on a daily time frame, OG has formed a bullish Gartley move for next price reversal.
Note: Above idea is for educational purpose only. It is advised to diversify and strictly follow the stop loss, and don't get stuck with trade

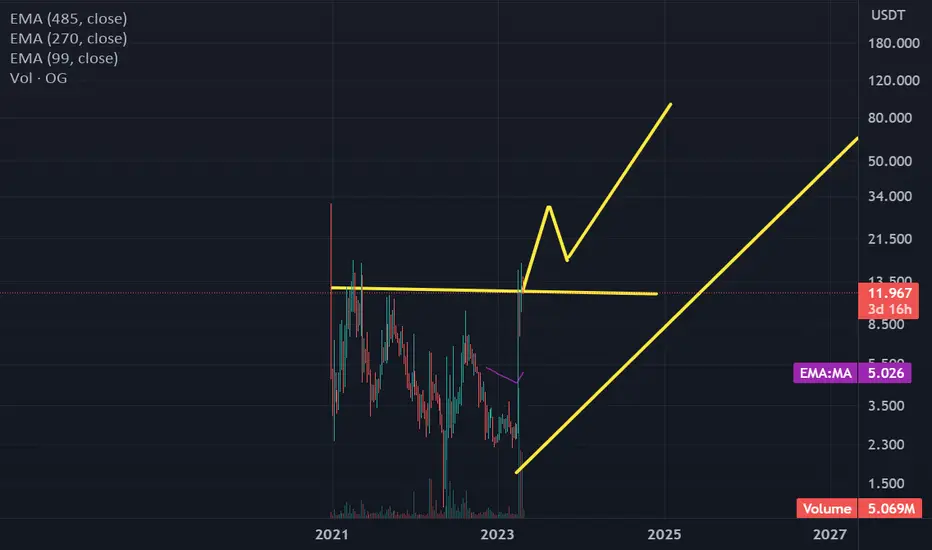
i see OG will be 35$ on September 2023i see OG will be 35$ on September 2023
i see OG will be 35$ on September 2023
i see OG will be 35$ on September 2023
i see OG will be 35$ on September 2023
i see OG will be 35$ on September 2023
i see OG will be 35$ on September 2023
i see OG will be 35$ on September 2023
i see OG will be 35$ on September 2023
i see OG will be 35$ on September 2023
i see OG will be 35$ on September 2023
i see OG will be 35$ on September 2023
OG cup model ☕According to what we see, the hand of the cup is forming, preparing for the rise, the possibility of the token rising to a price of 14.5, and perhaps its continuation to the upside.


soon 15$after this small consolidation, there are extremely high chances that it will go up to $15! be careful! do not enter without a stop loss

og to 15$after my analysis og you will follow the distributed graph! don't forget to secure your profit and use stop loss

OGUSDT-Pennant PatternA flagpole
A Pennant pattern always begins with a flagpole, which differentiates it from other types of patterns (such as the symmetrical triangle).
The flagpole is the initial strong move preceding the symmetrical triangle.
Price Target with Resistant is mapped on chart around 14$+ if BTC remain in same zone this weekend.
Preferred Entry around 9.50-9.80 with DCA
Partially close and move SL to BE when price cross 10.450$


🔥 OG Falling Wedge Break Out After +400% PumpOG saw a huge move last week where it gained more than 400% in less than two days. Since that time, OG has been steadily selling off and lost over half of its value.
However, OG has been making a falling wedge pattern during that fall. With both BTC and ETH seeing incredible gains, it's in my eyes a matter of time before we get some kind of pump on OG.
We're currently in the process of breaking out of the falling wedge (a bullish reversal pattern). In case we can close the current hourly candle above the pattern's resistance, I'm aiming for the targets in blue.
OG is a highly volatile token at the moment, be aware.

OG more gains?OG already received a buy and sell signal in our premium indicator. So wait for the 12$ cross. expected first profit is 15$
try our free indicator here

Long for OGaccording to my analysis, OG will increase up to the area of $14! not financial advice!!
enjoy and don't forget to use stop losts

OG Launch PatternOG/USDT printed a MORNING STAR. Holding this one. Pullback archived.
Capitulation imminent.

OG Fantoken - OnlyGains?Some zones of interest at the current pricepoint. theres always some liquidity to be taken, but which zone will be first?
What do you think? Please share your thoughts with me :)

🔥 OG Falling Wedge After Huge Move: Volatile Break ExpectedOG has been on everyone's mind lately. It gained nearly 450% in under two days, so volatility is certainly here.
I'm looking for a break out of the falling wedge drawn on the chart. Ideally we visit the yellow area once again, see some kind of oversold RSI (15m, 1H) and break out of the pattern.
Targets in blue.

ogu looks very bullish
according to my analysis, this currency will play in this bullish triangle until it breaks, potential growth up to 28$


oGUSDTTHE KIND info behind the bull run of this token still not clear to me, but this is good trade opportunity for me, after the weekly candle closed, i will rathe look for confirmation to sell down to 2usd

ogusdt predicted 8 x from here based on volume analysis highly volatile coin sleeping for weeks expect abig move from here

Unleashing the OGOG is a stock with a current price of HKEX:8 , and it has seen a significant increase of 185% in the past 24 hours. This surge in price indicates that there has been a lot of buying activity in the market, possibly due to some positive news or developments surrounding the company.
The RSI (Relative Strength Index) for OG is at 93, which indicates that the stock is currently overbought. An RSI reading above 70 typically signals that a stock is overbought, meaning that it may be due for a correction or consolidation.
Looking at the Fibonacci retracement levels, we can see that the stock has already surpassed the 0 Fibonacci level at 2.898, and the 0.5 Fibonacci level at 2.549. It is now approaching the 1 Fibonacci level at 2.200, which is a key level of support and resistance. If the stock manages to break through this level, it could continue its upward trend, but if it fails to break through, it could signal a reversal and a potential downward trend.
The upper and lower Bollinger bands, along with the middle Bollinger band, provide additional insight into the stock's price movements. The current price of HKEX:8 is above the middle Bollinger band at 3.060, which suggests that the stock is in a bullish phase. However, the upper Bollinger band at 5.669 is a significant level of resistance that the stock will need to break through if it wants to continue its upward trend.
The volume oscillator is currently at +64%, which indicates that there is strong buying pressure in the market. The MACD (Moving Average Convergence Divergence) is at 0.647, which suggests that the stock is in a bullish phase. However, traders should keep an eye on the Stochastic oscillator, which is currently at 77.70, as it is approaching the overbought territory.
Finally, the EMA 50 (Exponential Moving Average) is at 3, which is below the current price of $8. This indicates that the stock is currently in an uptrend and is trading above its short-term moving average.
In conclusion, based on the given information, OG is currently experiencing a significant surge in price and is in a bullish phase. However, traders should exercise caution as the stock is currently overbought and may be due for a correction. Additionally, the stock will need to break through key levels of support and resistance if it wants to continue its upward trend.


7-star buy and sell signalBuy when you get buy signal and sell when you get a Sell signal.
It's as simple as that.
trade with risk. Do your own research
Contact me for indicator.
Keep trading....
