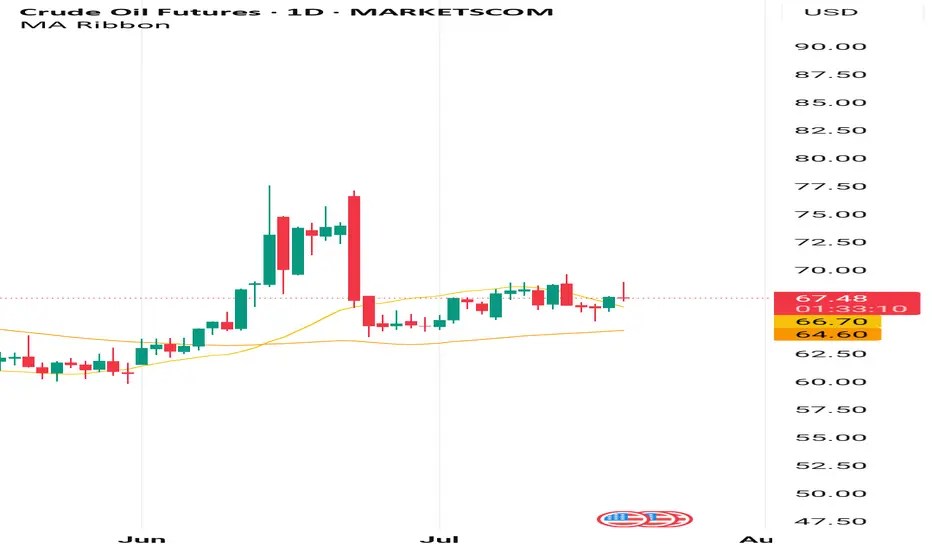
A very strong bullish trend is on the way!!!According to moving averages on daily time frame for oil , a very strong bullish signal is coming and it may leads the price to over 100$!!!!
OIL trade ideas
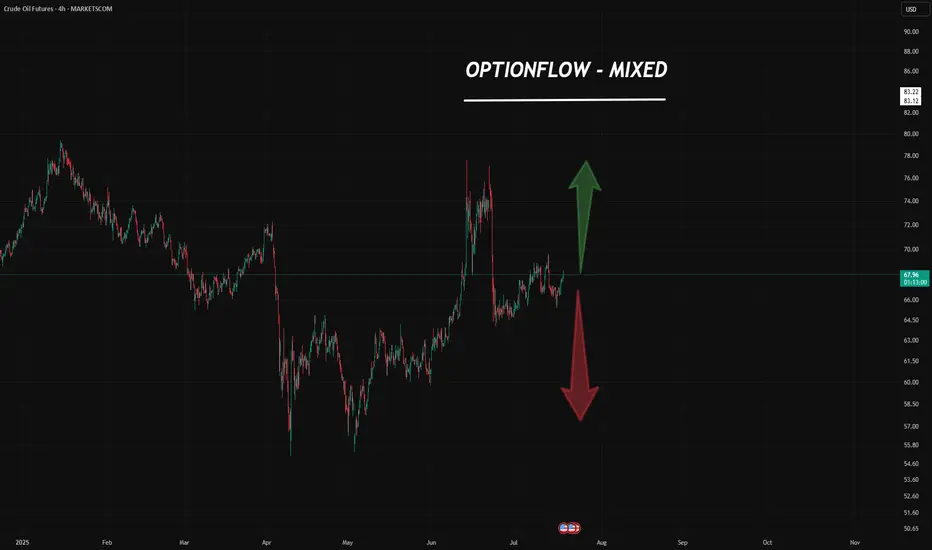
Crude Oil: Bulls vs. Bears — A Market at the Edge
Here’s what we’re seeing from the latest CME block trade data & CME report:
🐻 Confirmed & Detailed Bearish Sentiment
Big players are actively hedging and betting on a drop.
Block trades are targeting key downside levels:
$62.50 , $55.00 , and even as low as $45.00 .
This isn’t noise — it’s institutional conviction.
🐂 Strong Bullish Resistance
At the same time, there’s heavy buying in:
Long futures
Bullish call spreads (1,000+ contracts)
This tells us: there are serious buyers stepping in, targeting $67.50–$72.50 .
They don’t believe in the bear case — and they’re backing it with real money.
🧭 Market at a Bifurcation Point
The presence of massive, conflicting block trades is a clear sign:
The market is preparing for a big move — up or down.
“Smart money” isn’t betting on sideways action.
They’re positioning for breakout volatility .
📊 Final Forecast
Oil is under strong bearish pressure.
That makes a downward scenario more likely in the medium term .
BUT — there’s strong support from big buyers stepping in around $64–$65 .
So the most probable path?
A high-volatility phase , with attempts to test both:
Upper targets (bullish side)
Lower support zones (bearish side)
🔑 Key Battle Zone: $62 – $68
This range will be critical in the days ahead.
Break it — and we’ll know which side is in control.
Could we see the WTI oil bears getting pleased any time soon?The technical picture of MARKETSCOM:OIL is showing a possible bearish flag formation, which may lead WTI oil to some lower areas. Is that the case? Let's dig in.
NYMEX:CL1!
Let us know what you think in the comments below.
Thank you.
75.2% of retail investor accounts lose money when trading CFDs with this provider. You should consider whether you understand how CFDs work and whether you can afford to take the high risk of losing your money. Past performance is not necessarily indicative of future results. The value of investments may fall as well as rise and the investor may not get back the amount initially invested. This content is not intended for nor applicable to residents of the UK. Cryptocurrency CFDs and spread bets are restricted in the UK for all retail clients.

LCrude/Gold: Trump Escalates Tensions with CanadaCanadian Crude and Gold Under Pressure as Trump Threatens New Tariffs Unless Market Access Improves
By Ion Jauregui – Analyst at ActivTrades
Trade tensions between the United States and Canada are once again on the rise following Donald Trump's return to office. The president has set August 1st as the deadline to impose a 35% tariff on Canadian products unless Ottawa opens its market to American goods. This new chapter has triggered renewed uncertainty in the markets, particularly affecting Canadian crude (LCrude) and gold (GOLD), two of the country's key export commodities.
U.S. Commerce Secretary Howard Lutnick reiterated that "Canada is not open to us" and defended the tariffs as a way to restore what he described as a long-standing trade imbalance. Trump has already imposed a 50% tariff on Canadian steel and aluminum, a move Ottawa deemed "unjustified", and commercial retaliation has not been ruled out.
Impact on Canadian Crude (LCrude)
Canadian crude, closely tied to the West Texas Intermediate (WTI) futures contract, could be negatively affected by a drop in exports to the U.S., its main trading partner. The threat of tariffs may widen the price spread between Western Canadian Select (WCS) and WTI, putting downward pressure on LCrude (AT ticker for WTI futures). Furthermore, U.S. refineries might shift to alternative blends if the tariffs go into effect.
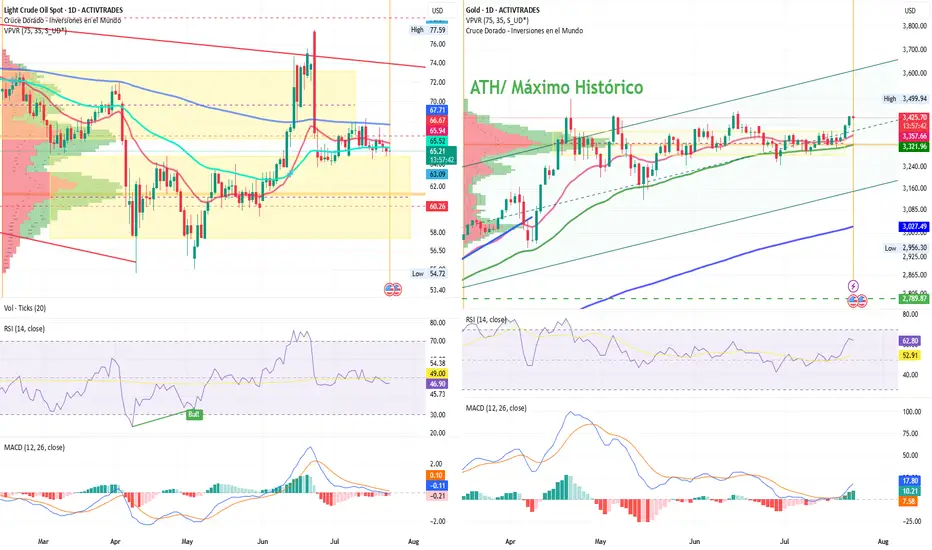
From a technical perspective, crude has remained in a consolidation range throughout July, falling over the last three sessions from 66.70 USD to 65 USD, and opening lower today. The current point of control is located further down, around 61.30 USD, which corresponds to a previous consolidation zone. The long-term trend remains bearish, with a moving average crossover indicating continued downside momentum, supported by a negative MACD. The RSI stands at 46.26%, in oversold territory, suggesting a possible short-term price correction before any further decline.
Gold (GOLD): A Safe Haven Amid the Conflict?
Unlike crude, Canadian gold could benefit from this escalation, as reflected in the GOLD ticker on the ActivTrades platform. In periods of geopolitical and trade uncertainty, gold traditionally acts as a safe haven asset. Should retaliatory tariffs lead to economic volatility, GOLD prices could face upward pressure, driven by risk hedging and flows into defensive assets.
Gold has been advancing steadily throughout the year, breaking out of a consolidation around 3,324 USD and aiming to breach the triple top resistance at 3,499.94 USD. Both the MACD and RSI suggest bullish momentum, which could push gold prices higher in the coming days if this level is broken. Conversely, failure to break convincingly could lead the price back to its consolidation zone, potentially testing support at 3,176.75 USD, a secondary floor outside the main range.
All Eyes on Trump
The ongoing tariff dispute between the U.S. and Canada is exerting pressure on Canada’s key export assets. LCrude remains in a vulnerable position, with a bearish outlook and risk of further downside if tariffs are enacted. In contrast, Canadian gold (GOLD) is gaining appeal as a safe-haven asset in this volatile environment and could strengthen further if it breaks through key resistance levels.
Looking ahead, investors should closely monitor developments between both governments as the August 1st deadline approaches. Any breakdown in trade negotiations could trigger sharp price movements and tactical trading opportunities in both assets.
*******************************************************************************************
The information provided does not constitute investment research. The material has not been prepared in accordance with the legal requirements designed to promote the independence of investment research and such should be considered a marketing communication.
All information has been prepared by ActivTrades ("AT"). The information does not contain a record of AT's prices, or an offer of or solicitation for a transaction in any financial instrument. No representation or warranty is given as to the accuracy or completeness of this information.
Any material provided does not have regard to the specific investment objective and financial situation of any person who may receive it. Past performance and forecasting are not a synonym of a reliable indicator of future performance. AT provides an execution-only service. Consequently, any person acting on the information provided does so at their own risk. Political risk is unpredictable. Central bank actions can vary. Platform tools do not guarantee success.
OIL fell sharply, opportunity for upside target of 70$OIL fell sharply and has now been in a contraction for a while, I am taking it into account for a potential breakout, as it shows tightening price action, which reflects market indecision.
Price action has now coiled into a symmetrical triangle, this is often a classic continuation or reversal pattern, and it’s building pressure for a potential breakout. So, if we do get a clean breakout above this pattern, with strong bullish candles, volume, or bullish divergence, that’s your confirmation cue.
This is totally achievable. It aligns beautifully with the 0.25 to 0.5 Fibonacci retracement zone from the recent swing high to low. It’s not just a psychological round number, it’s technically supported.
If the lower boundary of the triangle is broken with momentum, you’ve got to step back. No trade is better than a bad one. Watch how price interacts with the zone. If it loses it, you could be looking at a deeper leg down, potentially revisiting deeper support levels from prior bullish structure.

OIL SELL activated so there oil news on more production to be made tomw or saterday either way the market will flood with oil slamming the price to the floor and introduceing a perfect levraged short

OIL Price Forecast – Bearish Outlook OIL Price Forecast – Bearish Outlook
Oil prices have entered a consolidation phase, showing contracted price action—a classic sign of market indecision or a build-up before the next move.
This range-bound behaviour typically precedes a breakout or breakdown.
Given recent global supply-demand dynamics and technical resistance levels, the bias leans toward a bearish continuation.
you may find more details in the chart.
Ps Support with like and comments for more analysis.

LCrude Oil: Bearish Pressure as Brazil Emerges as an Energy PHLCrude Oil: Bearish Pressure as Brazil Emerges as an Energy Powerhouse
By Ion Jauregui – Analyst at ActivTrades
LCrude (Ticker AT:Lcrude), which replicates the West Texas Intermediate (WTI) futures contract, has been one of the most volatile assets in 2025. It faces mounting pressure from a growing global supply, cautious demand, and a renewed wave of investment in Latin America—especially in Brazil.
Technical Analysis
Technically, LCrude has lost momentum since the April 2024 highs near $87 per barrel. After breaking the upward trendline in late June, the same daily candle triggered a corrective move toward the $64–$65 range, where it has been trading since. The price entered a downward channel, and the key $66 support was broken decisively. Losing that level opens the door for a drop toward $60 per barrel. On the upside, a recovery above $73 would reignite buying pressure, targeting $78 near the long-term point of control. The support around the $54.72 lows reinforces the view that LCrude is now trading around its mean. Moving average crossovers—where the 200-period MA sits above the 50-period—suggest that price corrections may continue.
Fundamental Analysis
On the macroeconomic front, concerns over economic slowdowns in China and Europe are weighing on demand expectations. At the same time, the outlook for a supply surplus is solidifying, particularly with signals coming from emerging producer countries. One of the most significant developments is the resurgence of Brazilian oil—a silent revolution that could shift the global energy power balance. Brazil, now an external member of OPEC+, has impressed with record discoveries and licensing rounds. Its offshore projects offer an internal rate of return (IRR) close to 26%, among the highest in the world. Sector Experts project that by 2030, Brazil could surpass 5 million barrels per day, placing it among the global top five, just behind the U.S., Russia, and Saudi Arabia.
However, the sustainability of this growth will depend on the exploration of new frontiers, such as the Foz do Amazonas basin. The International Energy Agency (IEA) warns that without new discoveries, production could begin to decline after 2030.
Conclusion
LCrude's performance will depend on both technical patterns and fundamental factors tied to geopolitics and the global supply-demand balance. Brazil’s rise on the global energy map and the context of oversupply exert structural bearish pressure on the market. Nonetheless, current levels continue to offer opportunities for traders focused on range strategies and momentum.
*******************************************************************************************
La información facilitada no constituye un análisis de inversiones. El material no se ha elaborado de conformidad con los requisitos legales destinados a promover la independencia de los informes de inversiones y, como tal, debe considerarse una comunicación comercial.
Toda la información ha sido preparada por ActivTrades ("AT"). La información no contiene un registro de los precios de AT, o una oferta o solicitud de una transacción en cualquier instrumento financiero. Ninguna representación o garantía se da en cuanto a la exactitud o integridad de esta información.
Cualquier material proporcionado no tiene en cuenta el objetivo específico de inversión y la situación financiera de cualquier persona que pueda recibirlo. La rentabilidad pasada no es un indicador fiable de la rentabilidad futura. AT presta un servicio exclusivamente de ejecución. En consecuencia, toda persona que actúe sobre la base de la información facilitada lo hace por su cuenta y riesgo.

Oil and orasiaConsidering the global oil chart and the twelve-day war in the Middle East, and looking at the global gold chart, the estimates of micro and macro investors indicate a decrease in regional tensions and an end to the war, and there is likely to be a further decline in gold and oil prices.
Hussein M.

Crude Oil - Major VolatilityDue to what we are seeing between the US, Israel, and Iran - Oil prices have experienced heightened levels of volatility.
Since September '23, Oil has respected a clear series of lower highs, with each touch of the orange trendline marked by a red X. Every attempt higher has been faded — and nothing's changed yet.
The most recent move started with a bull div at the $55 double bottom — this front-ran the escalation between Israel and Iran, sending price rocketing into $77.
At the highs:
Bear div forms on RSI
RSI rejects clean off 70
Daily candles close below orange trendline
Peace talk headlines emerge
Price drops nearly 17% from the top
Now we’re back inside our white box, a strong demand zone from $64–$67.
Depending on how talks go between these countries will determine the next market stricture to develop for crude oil.
If talks go well we could see a breakdown of the $64 level into the $58-$61 range or if the war starts to escalate we could see this $64 level hold and head back up towards the trendline.

|Symmetrical Triangle| Squeeze in Crude OilCrude oil is currently forming a symmetrical triangle pattern, a classic squeeze formation with price compressed into a tight range. Symmetrical triangles typically act as continuation patterns, favoring the prevailing trend, and in this case, on the daily chart, the trend is well established: a bullish trend with high volume. As the dominant trend is clearly bullish, and volume has remained relatively high throughout the consolidation, it supports furthermore the potential for continuation to the upside.
On the Bollinger band the squeeze is more visible, and suggests diminishing volatility, which is often followed by expansion. Unlike earlier price action before consolidation, recent sessions are exhibiting larger candlestick bodies accompanied by pronounced wicks on both ends. Meaning adding confluence to our potential breakout. These conditions create a buildup of potential momentum in the market, exactly what fuels explosive breakouts when key levels are breached.
Though such pattern can also serve as a reversal signal when broader macro conditions shift.
But, and this is a big but, beyond the chart, the geopolitical context is intensifying. The Israel-Iran conflict continues to escalate, and with the most recent reports of direct US involvement, that is the strikes on Iranian nuclear infrastructure, the risk on crude oil is rising. The possibility of Iranian retaliation, introduces serious potential for supply disruption, as any military response or blockade would likely trigger a sharp spike in the price.
This confluence of technical breakout potential and geopolitical instability makes this setup particularly potent. If we get a confirmed breakout above the triangle and a clean close above the 77–79 zone, combined with global uncertainty and potential supply shocks, could put the $84-85 target well within reach in the near term. Beyond that, should geopolitical tension escalate, oil could accelerate toward $90 or even $100.
In short, this is a high-stakes moment. If price does break out, it won’t just be a technical move, it will ride a wave of volume, volatility, and geopolitical narrative.
With all this in mind, one should be watching closely for volume confirmation, breakout structure, and any major headlines from the Middle East as the situation develops.

Positive market: OIL rises sharply - Important area to watch forThe recent escalation of tensions in the Middle East has had a strong ripple effect across all commodities market. Just as we observed with Gold, it’s no surprise we’ve seen oil prices climb as well, given this uncertainty.
If you’ve seen my latest Gold analysis, you’ll understand how market sentiment has turned uneasy, and in times like these are what people trust when everything else feels risky. And naturally, with everything going on, Gold is seeing stronger demand again, and I expect the price to steadily climb and reach new highs because the momentum is unmistakable.
On Friday the 13th, oil prices spiked abruptly before pulling back slightly, showing just how sensitive the market is to potential supply disruptions. What’s fueling this rally is obvious, and it’s the fear around supply from such an important oil-producing area. This creates a great opportunity to take a position.
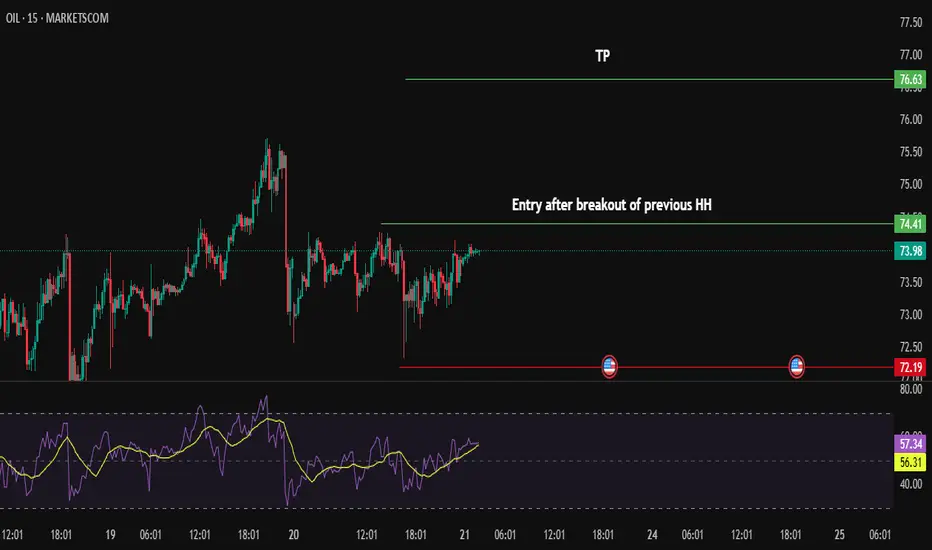
As you can see in my analysis, the price has recently broken above a key resistance zone and may come back for a retest. If this level holds as support, it would really confirm the bullish bias and make the move towards my anticipated target of 77,50 high probability, towards the next resistance zone level at 77,50 and 79,50.
If the price remains over this support zone, my bullish outlook stays the same. But, if it doesn’t hold above this level we could see a slight pullback before another definitve move up.
In such times, it’s important to watch price action closely especially near key technical levels, and let the market show your next move.

6/16/2025 3:33am PST - PreMarket Analysis - ChatGPTCRUDE OIL FUTURES – 15-Min Chart Analysis (June 16, 2025 – 06:23 UTC-4)
Ticker: OIL (MARKETSCOM)
Current Price: ~$70.97
Trend: Short-term bearish correction after major rally
EMA Signals: Bearish pressure building below 21 EMA, 50 EMA, and at 200 EMA support
🔍 Technical Indicator Summary:
1. Moving Averages
EMA 21 = $72.97
EMA 50 = $72.88
EMA 200 = $70.72 (currently holding as dynamic support)
➡️ Price is squeezed just above the 200 EMA while remaining under key short-term EMAs, signaling temporary bearish control but near potential bounce zone.
2. MACD (12,26,9)
Histogram: Weak bearish momentum (slightly below 0)
Signal line below MACD line but flattening
➡️ Signs of bearish momentum exhaustion. Neutral to slight bullish lean if crossover happens.
3. RSI (14)
RSI = 40.65
Signal line = 49.76
➡️ Approaching oversold territory but not deeply enough to be a reversal signal alone. RSI flattening, suggesting possible price compression before decision.
🔒 Key Price Levels
🔻 Support Zones:
$70.70 (EMA 200) — crucial dynamic support
$70.00 – key horizontal and psychological support
$69.17 / $68.98 – deeper structure supports if $70 fails
🔺 Resistance Zones:
$72.15 (near-term resistance)
$73.39 – local structural peak
$73.99 – key double top zone
🎯 Trade Setup (Next 24 Hours)
✅ Scenario 1: Bounce from EMA 200 (Bullish Reversal)
Conditions for entry:
RSI climbs above 45 and MACD bullish crossover confirmed
Price holds $70.70 and reclaims $71.50+ on healthy volume
Entry:
📈 Buy breakout above $71.50 (confirmation above local lower high)
🎯 TP1: $72.20
🎯 TP2: $73.30
🛑 SL: $70.40 (below 200 EMA and recent low)
❌ Scenario 2: Breakdown Below $70.70 (Bearish Continuation)
Conditions:
MACD histogram expands red again
RSI drops under 38
Price closes below $70.70 with increasing volume
Entry:
📉 Short below $70.60
🎯 TP1: $70.00
🎯 TP2: $69.20
🛑 SL: $71.30 (above minor consolidation)
📊 Probability Forecast (Next 24h):
Scenario Probability Rationale
✅ Bullish Reversal 60% - EMA 200 historically strong bounce zone
MACD flattening
Price holding horizontal + dynamic support |
| ❌ Bearish Continuation | 40% | - Price below all short-term EMAs
Macro structure still shows lower highs
Breakdown below 200 EMA could trigger quick selloff to $70 / $69.2 |
🧠 Strategic Insight:
Buyers are defending EMA 200; short-term bears running out of steam.
Wait for RSI & MACD confirmation — price may range 1–3 more candles.
Low-risk long possible if we see price reclaim $71.50 with volume.

OIL for long 1h *The content on this analysis is subject to change at any time without notice, and is provided for the sole purpose of assisting traders to make independent investment decisions.

Israel creates a risk-off environmentThe current geopolitical tensions continue to escalate and this is creating a risk-off environment, forcing investors to worry. Let's dig in.
MARKETSCOM:OIL
TVC:USOIL
Let us know what you think in the comments below.
Thank you.
77.3% of retail investor accounts lose money when trading CFDs with this provider. You should consider whether you understand how CFDs work and whether you can afford to take the high risk of losing your money. Past performance is not necessarily indicative of future results. The value of investments may fall as well as rise and the investor may not get back the amount initially invested. This content is not intended for nor applicable to residents of the UK. Cryptocurrency CFDs and spread bets are restricted in the UK for all retail clients.

Crude Oil DTF Technical & Fundamental AnalysisCrude Oil DTF Technical & Fundamental Analysis
Oil prices surged by 6–10% within minutes, with Brent and WTI recording the largest daily gains since May 2022. This spike followed Israel's airstrikes on Iran’s nuclear and military facilities, which reportedly killed senior commanders and scientists. Iran, which plays a top oil player and gatekeeper of the Strait of Hormuz—a passageway for nearly 20% of global oil supply—has declared a state of emergency, and any retaliation that threatens tanker movement or damages infrastructure in key Gulf nations (Saudi Arabia, UAE, Iraq) could push oil prices toward $120+/barrel as a risk premium is being priced in.
On the technical side (DTF): Price broke the major key support level at 67.00, followed by accumulation and heavy sell positioning. As expected, price hunted for liquidity and triggered sell-side stop losses. However, due to the sudden geopolitical news, price failed to break lower and instead spiked, breaking the next minor resistance level at 72.00, indicating a change of character.
Currently, we are watching for accumulation above the breakout, expecting a liquidity grab below the liquidity zone, then a move up toward distribution. Our area of interest lies at 73.40, after liquidity is formed and a minor key level is broken. Stop loss is set at 68.40 (below liquidity), and take profit at 84.20, the next minor key resistance.
Fundamental Outlook:
Middle East Tensions
-Israel launched airstrikes on Iran targeting nuclear and military sites (Tehran, Natanz, IRGC headquarters).
-Key IRGC generals and nuclear scientists reported killed.
-Iran declared a state of emergency and is expected to retaliate imminently.
Supply Risk – Strait of Hormuz
-Iran controls the Strait of Hormuz, a critical chokepoint for ~20% of global oil supply.
-Any military action or blockades here could immediately tighten global supply and trigger a surge toward $100–$120/barrel.
📌 Disclaimer:
This is not financial advice. Always wait for proper confirmation before executing trades. Manage risk wisely and trade what you see—not what you feel.

WTI oil has approached a key area of resistanceThe technical picture of WTI oil shows that the commodity is now near one of its key downside resistance lines. Could we get a break, or trendline will remain intact?
Let's dig in!
TVC:USOIL
MARKETSCOM:OIL
Let us know what you think in the comments below.
Thank you.
77.3% of retail investor accounts lose money when trading CFDs with this provider. You should consider whether you understand how CFDs work and whether you can afford to take the high risk of losing your money. Past performance is not necessarily indicative of future results. The value of investments may fall as well as rise and the investor may not get back the amount initially invested. This content is not intended for nor applicable to residents of the UK. Cryptocurrency CFDs and spread bets are restricted in the UK for all retail clients.

OIL Trade take long on OIL after the price engages in 4H FVG last Day
Price take PCL of 4H i see luck of creating FVG lower
take long stop loss below the swing low of 15min

What to expect from WTI oil in the near term?We are currently not doing anything with WTI oil, but monitoring it very closely.
Let's dig in!
TVC:USOIL
MARKETSCOM:OIL
Let us know what you think in the comments below.
Thank you.
77.3% of retail investor accounts lose money when trading CFDs with this provider. You should consider whether you understand how CFDs work and whether you can afford to take the high risk of losing your money. Past performance is not necessarily indicative of future results. The value of investments may fall as well as rise and the investor may not get back the amount initially invested. This content is not intended for nor applicable to residents of the UK. Cryptocurrency CFDs and spread bets are restricted in the UK for all retail clients.

Crude Oil Futures: Cup and Handle Pattern 4hCUP FORMATION
Start Date: April 27, 2025, 22:01
Bottom Date: May 4, 2025, 22:01
Bottom Price: $55.34 (exact)
Cup Duration: 15 days
Cup Depth: $8.66
Cup Shape: Rounded, symmetrical U-formation
Right Rim: $64.00 (May 12)
HANDLE FORMATION
Start Date: May 12, 2025, 10:01
Current Price: $61.68
Upper Boundary: Descending trendline from $64.00
Lower Boundary: Descending trendline near $60.40
Handle Depth: ~$3.30 (38% of cup depth)
Current Pattern: Downward-sloping consolidation
PATTERN MEASUREMENTS
Cup Low to Rim: $8.66 ($64.00 - $55.34)
Current Resistance: ~$63.00 (descending trendline)
Target Projection: $71.66 - $72.23 (breakout point + cup depth)
TECHNICAL CHARACTERISTICS
Smooth, rounded bottom (not V-shaped)
Handle forming in upper half of cup (bullish)
Handle depth less than 50% of cup depth (ideal)
Handle showing typical flagging pattern
Clear, well-defined pattern boundaries
The pattern will complete with a breakout above the descending resistance line, currently at approximately $64.00.

Oil expectation. 1HMarket in a bullish trend, breakout from trend line and rejection off support sets it up for strong bullish movement towards destination. Uptrade supported by long trend line towards destination resistance.

TA on WTI Oil - 2025.05.14Quick technical analysis on WTI oil.
Let us know what you think in the comments below.
Thank you.
77.3% of retail investor accounts lose money when trading CFDs with this provider. You should consider whether you understand how CFDs work and whether you can afford to take the high risk of losing your money. Past performance is not necessarily indicative of future results. The value of investments may fall as well as rise and the investor may not get back the amount initially invested. This content is not intended for nor applicable to residents of the UK. Cryptocurrency CFDs and spread bets are restricted in the UK for all retail clients.
