Crude hit the c wave finish of a triangle ? Crude finishing up the c wave of a triangle? Let’s see if we turn this lower in a d wave of a possible 4th wave triangle
OILUSD trade ideas
USOIL LONG FROM SUPPORT
USOIL SIGNAL
Trade Direction: long
Entry Level: 65.00
Target Level: 66.37
Stop Loss: 64.09
RISK PROFILE
Risk level: medium
Suggested risk: 1%
Timeframe: 2h
Disclosure: I am part of Trade Nation's Influencer program and receive a monthly fee for using their TradingView charts in my analysis.
✅LIKE AND COMMENT MY IDEAS✅

CRUDE OIL (LONG IDEA)🛢️ OILUSD (WTI Crude Oil) – LONG SETUP 🛢️
🚦 Bias: BULLISH (Long)
💰 Entry: Market @$65.408 (or buy dips)
🛑 Stop Loss:$60.00 (HTF protection)
🎯 Take Profits:
• TP1:$69.65
• TP2:$72.00
• TP3:$85.00 🚀 (HTF buy-side liquidity)
🔍 Why This Trade?
✨ Multi-Timeframe Confluence:
📈 Weekly: Bullish structure shift, liquidity sweep
🟩 Daily: Strong bounce from order block + FVG
⏰ 4H: BOS, FVG tap, higher lows = bullish flow
🔥 Fundamentals:
🏦 EIA: Big crude inventory drawdown
🌍 OPEC/IEA: Q3 demand rising
⚡ Geopolitics: Middle East/Red Sea risk premium
💵 Macro: USD weakness = oil tailwind
🧠 Sentiment:
🧑💻 Retail: Still net short
🏦 Managed money: Adding longs
🚀 Fuel for upside!
🛠️ Execution Plan:
💸 Buy now @$65.408 or scale in on dips $64.50–63.50)
🛡️ Stop Loss:$59.780 (HTF structure)
🎯 Targets:
TP1:$69.65
TP2:$72.00
TP3:$85.00 🚀
❌ Invalidation:
Weekly close <$60.00 = exit
⚡ Summary:
All signals GO! 🚦 Multi-timeframe bullish structure, strong demand, and fundamentals + sentiment all align for a high-conviction long. Risk defined at $60.00 for max protection. Targeting major buy-side liquidity at $85.00!
#OILUSD #CrudeOil #Long #SmartMoney #TradeSetup 🚀

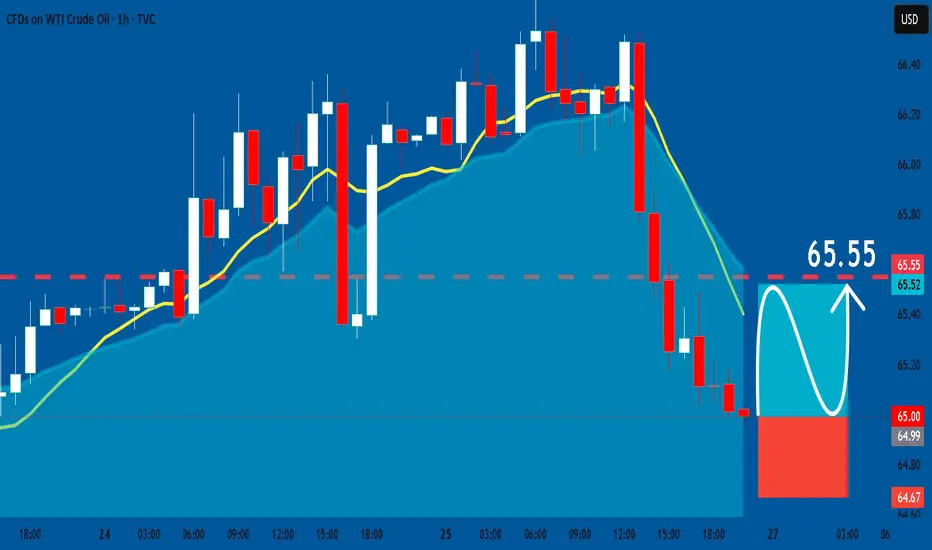
USOIL: Long Trade with Entry/SL/TP
USOIL
- Classic bullish setup
- Our team expects bullish continuation
SUGGESTED TRADE:
Swing Trade
Long USOIL
Entry Point - 65.00
Stop Loss - 64.67
Take Profit - 65.55
Our Risk - 1%
Start protection of your profits from lower levels
Disclosure: I am part of Trade Nation's Influencer program and receive a monthly fee for using their TradingView charts in my analysis.
❤️ Please, support our work with like & comment! ❤️
Potential Long on WTI
Crude oil is showing potential for a bullish move due to increasing speculation about a possible agreement between China and the United States.
As we approach August 1st – the date associated with Trump's proposed tariff actions – the chances of a diplomatic breakthrough are growing.
If the two economic giants reach any form of understanding, it could trigger a wave of optimism in the oil market, potentially leading to a strong upward move.
Market participants should closely watch developments related to the US-China negotiations over the coming days.

CRUDE OIL Risky Long! Buy!
Hello,Traders!
CRUDE OIL will soon hit
A horizontal support
Of 64.50$ and as it is
A strong level we will be
Expecting a local bullish
Rebound on Monday
Buy!
Comment and subscribe to help us grow!
Check out other forecasts below too!
Disclosure: I am part of Trade Nation's Influencer program and receive a monthly fee for using their TradingView charts in my analysis.

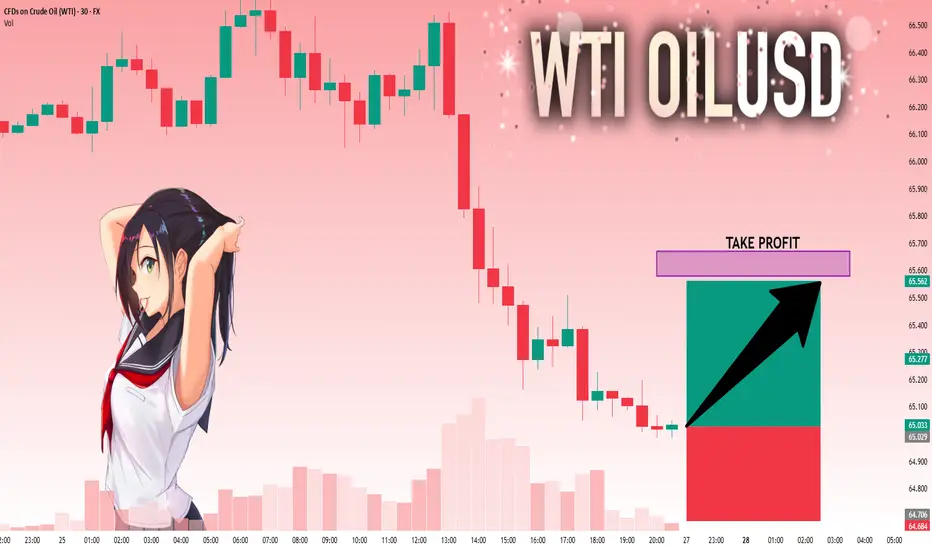
USOIL: Next Move Is Up! Long!
My dear friends,
Today we will analyse USOIL together☺️
The market is at an inflection zone and price has now reached an area around 65.029 where previous reversals or breakouts have occurred.And a price reaction that we are seeing on multiple timeframes here could signal the next move up so we can enter on confirmation, and target the next key level of 65.579.Stop-loss is recommended beyond the inflection zone.
❤️Sending you lots of Love and Hugs❤️
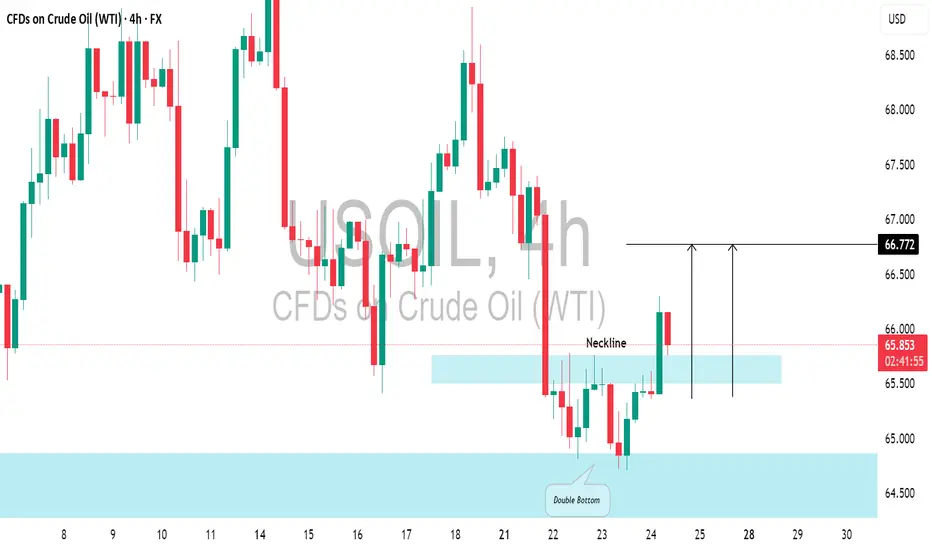
US CRUDE OIL (WTI): Pullback From Support📈USOIL responded well to the highlighted daily support level.
The price formed a double bottom pattern on that and broke above its neckline.
There's a strong likelihood that the price will continue to increase and reach 66.72 shortly.
Crude oil trading reminder: triple positive support
💡Message Strategy
After three consecutive days of sluggishness, both U.S. and Brent crude oil remained above the 100-day moving average on Thursday (July 24). U.S. crude oil is currently up 0.4%, trading around 65.46; Brent crude oil is currently up 0.1%, trading around US$68.67 per barrel. The three engines of trade negotiations, unexpected decline in inventories, and geopolitical games are ignited at the same time. Oil prices showed signs of stabilizing, allowing bulls to "smell" the long-awaited rebound opportunity.
1. The trade war breaks the ice: the US, Japan and Europe have reached a series of agreements to ignite market hopes.
2. Inventories plummeted by 3.2 million barrels! The balance of supply and demand suddenly tilted.
3. Geopolitical black swan: The war between Russia and Ukraine burns the energy supply chain
📊Technical aspects
The short-term (4H) trend of crude oil fluctuated upward slightly. The moving average system gradually formed a bullish arrangement, and the short-term objective trend direction was upward. In terms of momentum, the MACD indicator opened upward above the zero axis, and the bullish momentum was sufficient.
In terms of form, the oil price broke through the neckline, and the head and shoulders bottom reversal pattern was established. It is expected that after the intraday crude oil trend retests the neckline position, the probability of forming another upward rhythm is high.
💰Strategy Package
Long Position:65.50-66.50,SL:64.00,Target:67.75-68.00

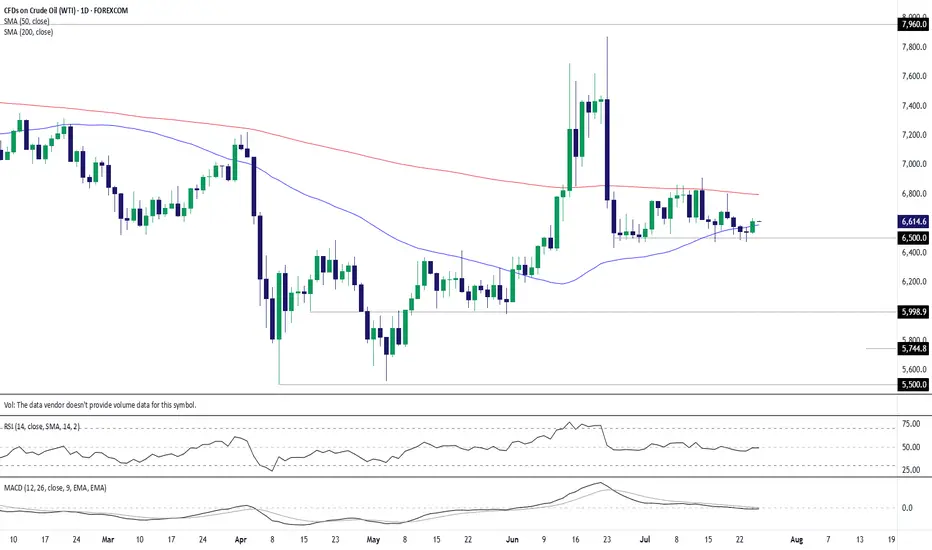
WTI crude: $65 floor holds again as bulls test 50-day MAAfter nine failures to break and close beneath $65 per barrel over the past month, you have to wonder how much longer bears will persist in attempting to take out the level. Following a nice pop higher on Thursday, completing a morning star pattern and closing above the 50-day moving average, it may be time for WTI bulls to have their day in the sun.
For those eyeing long setups, positions could be initiated above the 50-day moving average with a stop beneath for protection against reversal.
As for potential targets, the contract had little luck breaking cleanly above the 200-day moving average earlier this month, making it screen as a suitable level. It’s found just below $68 per barrel today.
Good luck!
DS
Oil weekly bear flagPresetly: seeing a weekly bear flag spotted on oil
Expecting: next weekly candle to be continuation red candle
USOIL Robbery Alert! Smart Entry Plan Below Key MA Level🔐💥 “WTI Energy Heist: Thief Trader’s Bearish Master Plan” 💥🔐
The Official Robbery Blueprint for Smart Traders
🌟 Hi! Hola! Ola! Bonjour! Hallo! Marhaba! 🌟
💸 Welcome, Money Makers & Market Robbers! 💸
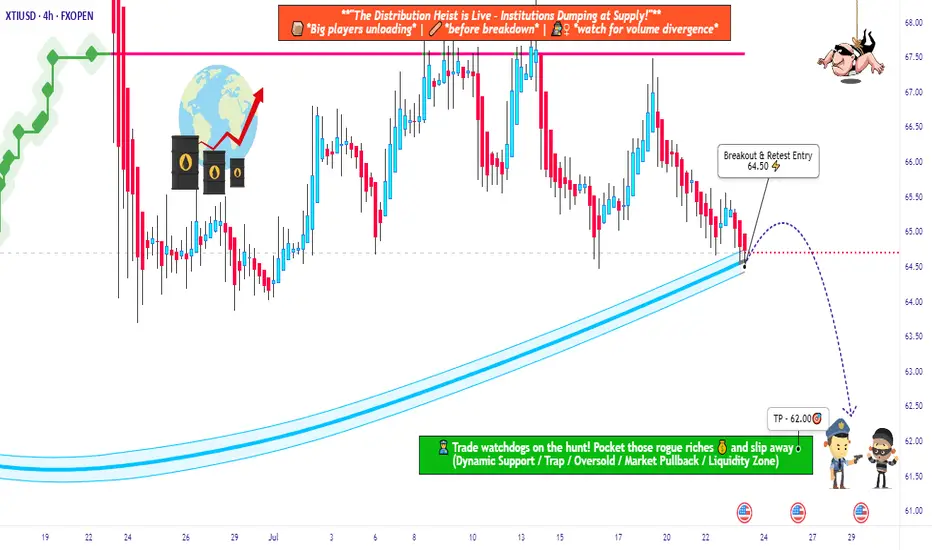
🚨 Get ready to break into the "US Oil Spot/WTI" market with precision-crafted bearish strategy from the one and only — Thief Trader Style!
📉💣 THE HEIST IS ON: SHORT PLAN LOADED! 💣📉
We’ve analyzed the charts using Thief Technicals + Fundamental Lockpick Tools and spotted a high-risk GREEN zone – a consolidation trap where greedy bulls usually get caught. This is where we strike.
🔑 ENTRY:
"Wait for the Neutral Moving Average to Break — Then Make Your Move!"
🎯 Focus zone: 64.50
☠️ Wait for the breakout – do NOT enter before it happens.
✅ Use sell stop orders above the MA line or place sell limit orders on the pullback after the breakout (target within the 15–30 min candle near swing high/low).
🧠 Thief Tip: Layer in entries using the DCA (layered attack strategy) to catch price on its way down. Set a chart alert so you don’t miss the strike moment.
🛑 STOP LOSS:
"Set it smart or don’t set it at all — you choose the fire you want to play with!"
📍 SL only gets placed AFTER breakout.
🎯 Recommended SL at 66.00 on the 4H swing level.
☠️ DO NOT place any orders or SL before confirmation breakout.
📊 Your SL depends on your risk %, lot size, and number of entries stacked.
🎯 TARGET ZONE: 62.50
💸 Lock profits before the bulls wake up. This level is based on market exhaustion zones and historical bounce areas.
🧠 WHY WE'RE SHORTING THIS?
This isn’t just a chart move — it’s backed by full-scale robbery research:
📰 COT Reports
📈 Macro & Seasonal Trends
🛢️ Crude Oil Inventories
💹 Sentiment & Intermarket Correlation
📉 Supply-Demand Dynamics
📚 Before pulling the trigger, educate yourself with the fundamentals. Dive into COT, Seasonal, and Macro reports. Don’t rob blindly — rob smart.
⚠️ Risk Management Alert:
Major news releases? Step back.
Trailing stops? Lock it in.
Position sizing? Know your risk.
Trade like a professional robber, not a street pickpocket.
💥💖 SUPPORT THE ROBBERY PLAN 💖💥
🧨 Smash that BOOST button to support this trading style and help more traders rob the market clean. Every like, every boost makes this community stronger.
💬 Drop a comment, share your entry levels, or post your winning trades.
This is a trading crew – we rob together, we profit together.
🔔 Stay tuned — more heist plans dropping soon.
Until then... Rob Smart. Trade Hard. Take Profits. 💰💪🎯
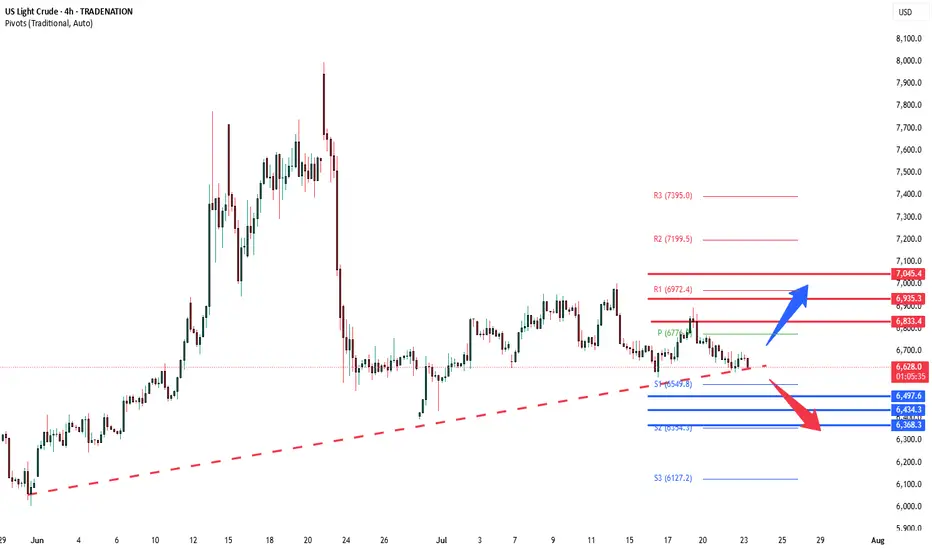
WTI crude consolidation ahead of US Inventory figuresWest Texas Intermediate (WTI) crude futures hovered near $66.30 during Wednesday’s European session, trading in a narrow range as investors awaited the latest US EIA crude inventory report. Market expectations point to a 1.4 million barrel drawdown, which would signal stronger demand and potentially support prices.
However, crude failed to rally despite confirmation of a US-Japan bilateral trade agreement, announced by President Trump via Truth Social. While the deal is seen as a positive for global trade sentiment, broader oil demand concerns persist—especially if US-EU trade negotiations stall, which could dampen growth in major consuming regions.
Conclusion:
Oil markets remain in consolidation mode, with near-term direction likely hinging on EIA inventory results. A larger-than-expected draw could offer upside momentum, but macro-level trade uncertainties continue to cap gains.
Key Support and Resistance Levels
Resistance Level 1: 6830
Resistance Level 2: 6940
Resistance Level 3: 7045
Support Level 1: 6500
Support Level 2: 6435
Support Level 3: 6370
This communication is for informational purposes only and should not be viewed as any form of recommendation as to a particular course of action or as investment advice. It is not intended as an offer or solicitation for the purchase or sale of any financial instrument or as an official confirmation of any transaction. Opinions, estimates and assumptions expressed herein are made as of the date of this communication and are subject to change without notice. This communication has been prepared based upon information, including market prices, data and other information, believed to be reliable; however, Trade Nation does not warrant its completeness or accuracy. All market prices and market data contained in or attached to this communication are indicative and subject to change without notice.
BUY USOILI'm sharing with you our trade today on OIL.
The reason we're buying is because yesterday the market grabbed the LQ now it is reversing to climb higher to fill all of the FVG we got in the previous movement.
For a safe entry, wait for the price to come back to our entry poin at 65.800 since I myself am waiting for the price to come to our entry point.
Follow for more!

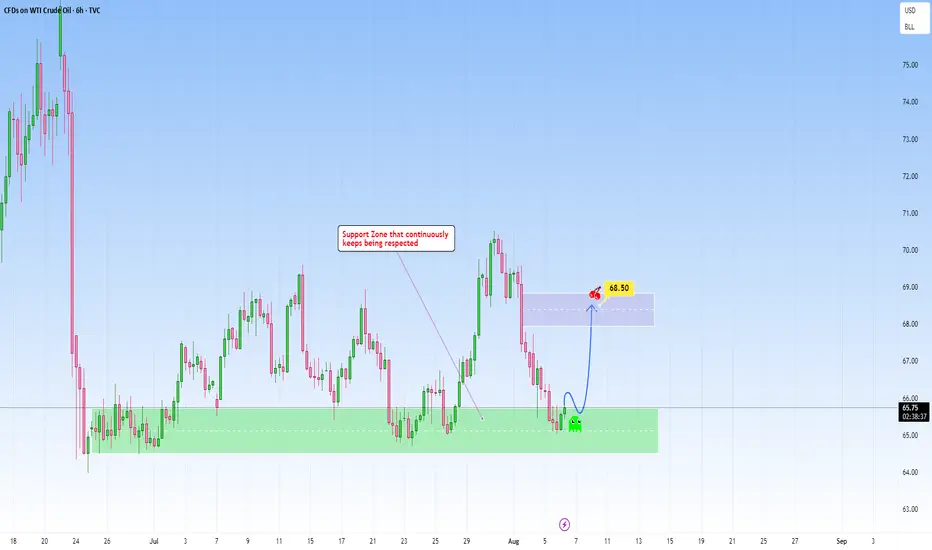
USOIL: Respecting support, repeating opportunity The chart on USOIL presents a compelling technical setup that blends structure, behavioral dynamics. The core technical analysis here lies in this support zone that is well-defined area that has been tested multiple times and consistently held, suggesting strong demand.
The narrative structure is one of rebound. Every time price approaches the support zone, the reaction is not only immediate but also structured, price responds with conviction.
So I am recognizing the strength of the reaction and forecasting an upward move to the 68.50 level.
The target at 68.50 is achievable, acting as both a profit objective and a psychological level, round enough to attract attention and previously strong enough to cause a drop. If momentum sustains, a breakout from there would depend on volume confirmation and structure shifts, but for now, the play back into that range makes sense and respects both the chart’s geometry and price action logic.
Not reacting to noise, but to repeatable high-probability zones.
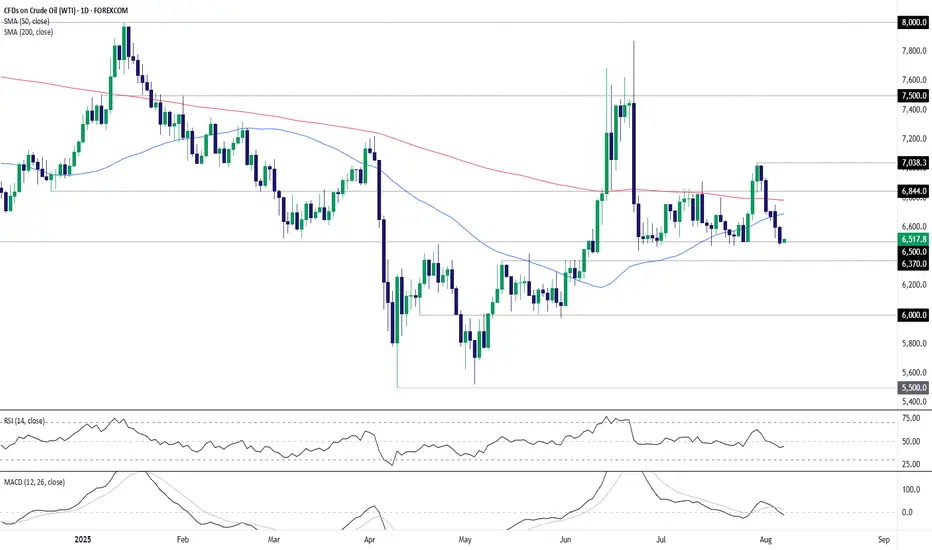
WTI Crude: Bulls on the Back FootWTI crude oil has found plenty of willing buyers beneath $65 per barrel recently, often acting as a launchpad for abrupt squeezes higher. But with supply gushing as OPEC+ returns 2.2 million barrels per day to market at a time when concerns about the U.S. economy are growing, whether that continues remains debatable—especially after the sharp $5-plus slide over the past week.
With the price closing at its lowest level since early June on Tuesday, traders should be alert to the risk of an extension of the bearish move.
Given how often the price has been bid up beneath $65, the inclination is not to act immediately if Tuesday’s lows are taken out. Instead, $63.70 is a level to watch, having acted as resistance through May and June. A break below there would create a cleaner setup for shorts, allowing positions to be initiated with a stop just above for protection. $62.00 saw some action earlier in the year, but $60 looks the more compelling downside target.
RSI (14) is beneath 50 while MACD is negative, having already crossed below the signal line—both hinting that selling rallies may work better than buying dips near term.
Of course, if the contract can’t break $65 meaningfully despite the bearish backdrop, the setup could be flipped, allowing for longs to be established above with a stop beneath, targeting either the 200-day moving average or $68.44 resistance.
Good luck!
DS
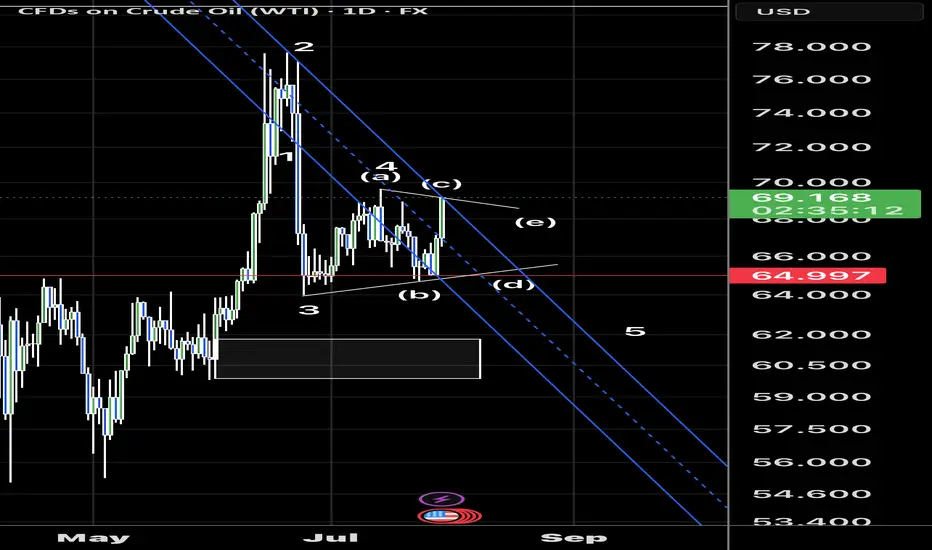
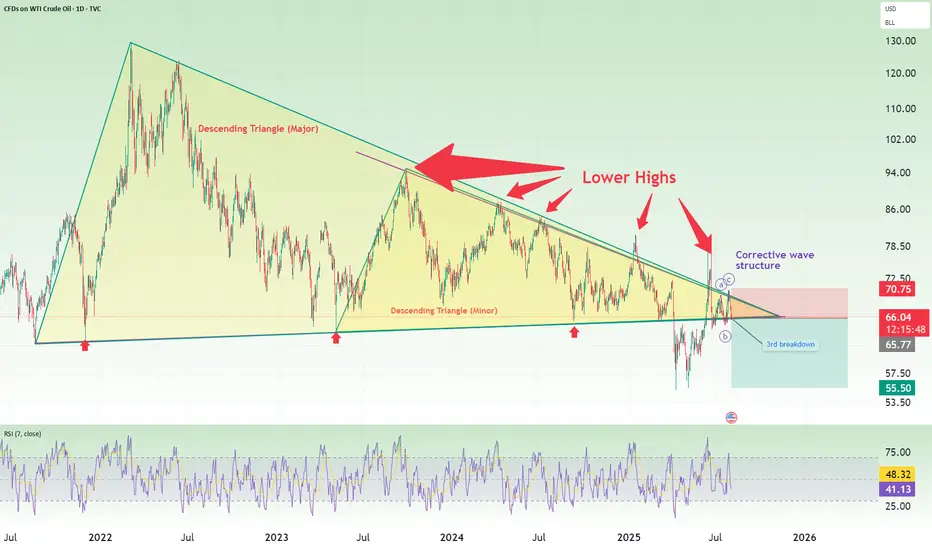
Oil short: breakdown from triangle againThis idea is backed by my general view that the stock market is going to crash in August. what this means is that we are going into a risk-off environment and there will be reduced consumption and demand for oil too.
Technically, I pointed out 4 things in this chart:
1. Descending triangles
2. Lower highs
3. 3rd breakdown (after a false break to the upside)
4. A corrective wave structure
Good luck!
SELL USOILI'm sharing with you our trade for this morning on OIL, which we caught based on a reversal and the 2:25am (NY Time) FVG.
Follow for more!

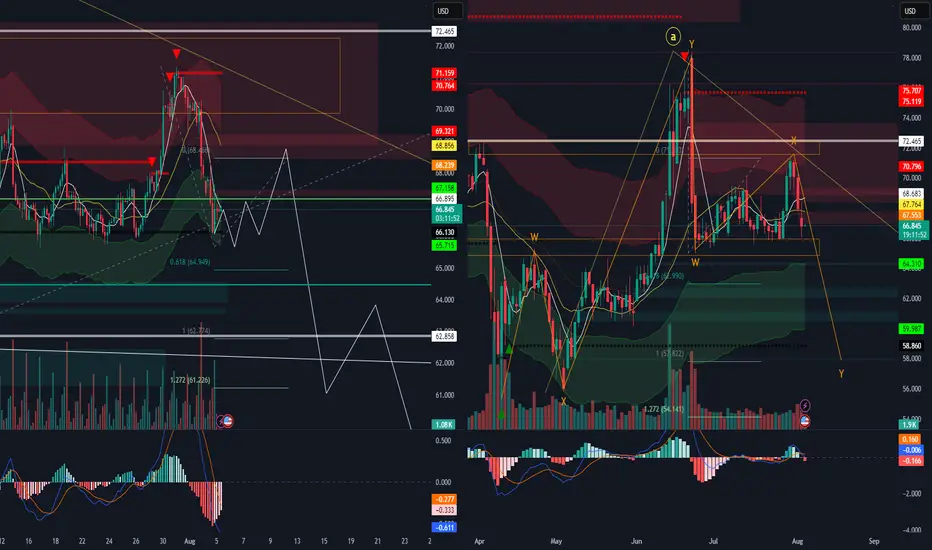
Oil Seems to soon drop downOil grand super Cycle suggests a further down move pursuing wave B towards 57.845 or 50.268. However before this great move down, we should see a slight fall to 66.104 or 65.673 the a sudden jump to 69.141 from that level we may see a drop in probably august to the 50.268 or 62.858
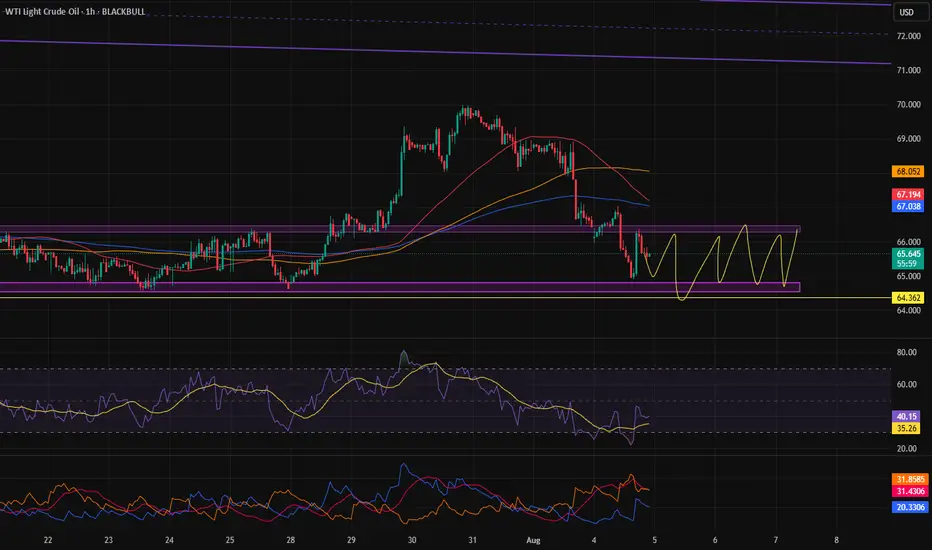
Price returning into the channel is frustrating.After a long time, oil managed to break out of that channel, but we see it has returned back inside the channel again. Hopefully, it will break out from one side soon so we can catch a good opportunity.
Crude Oil drops below $70, reversal on the radar?Oil opened the week under pressure after OPEC+ confirmed a 547,000 bpd increase for September, completing a 2.5 million bpd reversal of past cuts—about 2.4% of global demand. The group is now undecided—future moves could be more hikes, a pause, or even cuts, depending on market conditions. Actual supply growth may be closer to 1.7 million bpd due to member constraints, while expectations are that this could be the last hike amid slowing demand and rising non-OPEC output. With oil demand softening, a Q4 surplus looming, and prices under $70, holding steady seems likely for now. Meanwhile, geopolitical pressure from Trump over Russian oil adds more uncertainty, where a final call by OPEC may come at the next meeting on September 7.
On the technical side, the price of crude oil is currently testing the support of the 50% weekly Fibonacci retracement level while the moving averages are still validating a bullish trend in the market. The Bollinger bands are expanding, showing that volatility is picking up in the market for crude oil, while the Stochastic oscillator is approaching extreme oversold levels, hinting that a bullish correction might be on the horizon in the upcoming sessions. If this scenario becomes reality, then the first area of potential resistance might be seen around the $70 level, which consists of the psychological resistance of the round number, the upper band of the Bollinger bands, and the previous medium-term high since late July.
Disclaimer: The opinions in this article are personal to the writer and do not reflect those of Exness

Us oil bullish setupI’m bullish and I was waiting for the pullback…its happening and I’m buying at the buy zones shown on the chart, stop will be the yellow line.

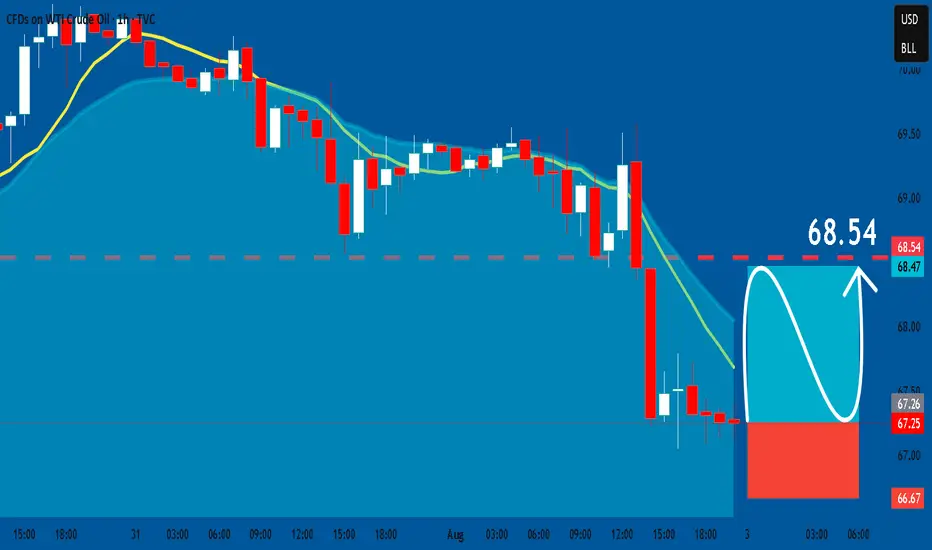
USOIL: Long Trade with Entry/SL/TP
USOIL
- Classic bullish pattern
- Our team expects retracement
SUGGESTED TRADE:
Swing Trade
Buy USOIL
Entry - 67.25
Stop - 66.67
Take - 68.53
Our Risk - 1%
Start protection of your profits from lower levels
Disclosure: I am part of Trade Nation's Influencer program and receive a monthly fee for using their TradingView charts in my analysis.
❤️ Please, support our work with like & comment! ❤️