OIL_BRENT trade ideas
Brent: Crude Loses Its Shine Amid Mass Selloffs and Global FearsBy Ion Jauregui – Analyst at ActivTrades
Bearish pressure is intensifying in the oil market, with Brent crude leading the liquidation among major investment funds. The expiration of U.S. tariff exemptions on August 1st, combined with a global economic slowdown, has triggered a wave of risk aversion across energy commodities.
Funds Exit Oil: Alarming Figures
According to the latest data from the CFTC and ICE, hedge funds cut their net long positions in Brent by 11,352 contracts, bringing the total down to 227,393, the lowest level since April. For West Texas Intermediate (WTI), the decline was even sharper—over 10,000 contracts, reducing the net exposure to 86,088.
The bearish trend extends to refined products. U.S. diesel net positions fell to 38,945 contracts, although pure long positions reached 54,053, the highest level since February. In contrast, European gasoil showed relative strength as a safe haven, with long contracts increasing by 7,632 to 132,133—the highest level in more than three years.
Brent Technical Analysis: Critical Zone Under Pressure
From a technical perspective, Brent failed to break through the key $80 resistance level on June 23rd, which intensified selling pressure. Throughout July, prices have consolidated within an accumulation zone around $68, close to current levels. The year’s lows, recorded in May at $58.16, suggest a structural support around $62.41.
The loss of the 50- and 100-day moving averages reinforces the bearish bias. Should the current support break, Brent could swiftly move toward $64, a key technical support zone. Conversely, if prices hold above this level, a rebound toward the control zone around $72 could follow.
Technical indicators support the pessimistic outlook: the RSI stands at 48.32, in neutral territory but lacking upward momentum, while the MACD shows a bearish expansion, potentially signaling further downside unless strong buying emerges in the short term.
Valuations in Question
Despite the recent correction, the energy sector within the S&P 500 maintains an estimated P/E ratio of 15, above its historical average of 11–12, though still below the broader index average (~26×). This raises the classic dilemma: is this a value opportunity or a value trap in a structurally weakening demand cycle?
Conclusion
The oil market is facing a double challenge: weakened fundamentals and bearish technical signals. With institutional flows pulling back, macro uncertainty rising, and momentum indicators flashing red, caution is warranted.
The current levels may mark a strategic inflection point—or simply the prelude to deeper declines.
*******************************************************************************************
La información facilitada no constituye un análisis de inversiones. El material no se ha elaborado de conformidad con los requisitos legales destinados a promover la independencia de los informes de inversiones y, como tal, debe considerarse una comunicación comercial.
Toda la información ha sido preparada por ActivTrades ("AT"). La información no contiene un registro de los precios de AT, o una oferta o solicitud de una transacción en cualquier instrumento financiero. Ninguna representación o garantía se da en cuanto a la exactitud o integridad de esta información.
Cualquier material proporcionado no tiene en cuenta el objetivo específico de inversión y la situación financiera de cualquier persona que pueda recibirlo. La rentabilidad pasada y las estimaciones no sinónimo ni un indicador fiable de la rentabilidad futura. AT presta un servicio exclusivamente de ejecución. En consecuencia, toda persona que actúe sobre la base de la información facilitada lo hace por su cuenta y riesgo. Los tipos de interés pueden cambiar. El riesgo político es impredecible. Las acciones de los bancos centrales pueden variar. Las herramientas de las plataformas no garantizan el éxito.
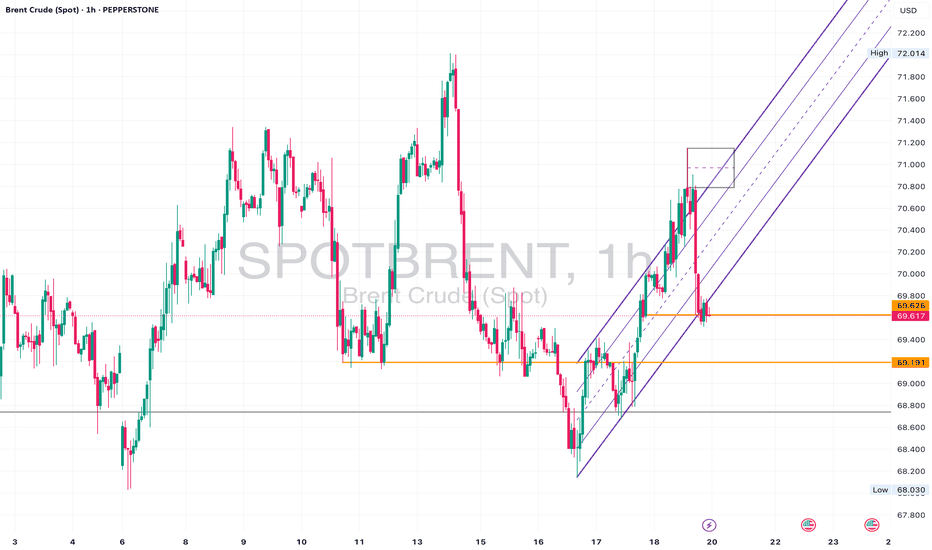
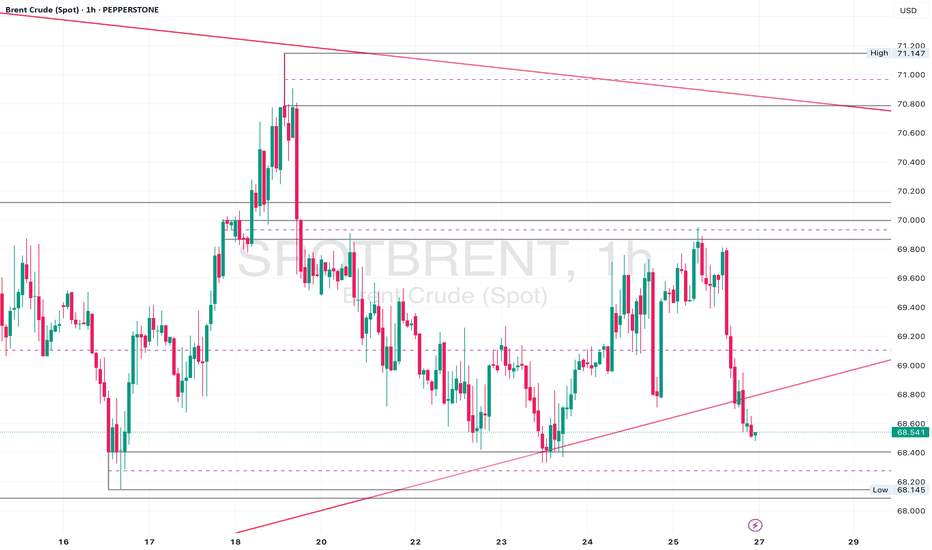
Brent UKOil - Neutral Slightly Bearish • Daily: Price is sitting above long-term trendline support, but momentum is waning.
• 4H: Structure looks indecisive with constant failures near 71.00.
• 1H: Recent break of the upward channel. Now retesting that zone from below.
⚠️ Watch For:
• Retest of 69.60–70.00 as resistance.
• Break and close below 69.20 could signal deeper downside.
• If it holds above 70.20 again, bullish bias resumes.
Crude Oil Setup in ProgressOil is in an uptrend, and I expect it to continue.
At the moment, the stop-loss would be too wide — around 3.5%, which is a bit too much for my portfolio, especially considering I already have a wide stop on palladium.
On the 1-hour chart, I’m watching for a possible entry slightly below the current level. For now, just observing.
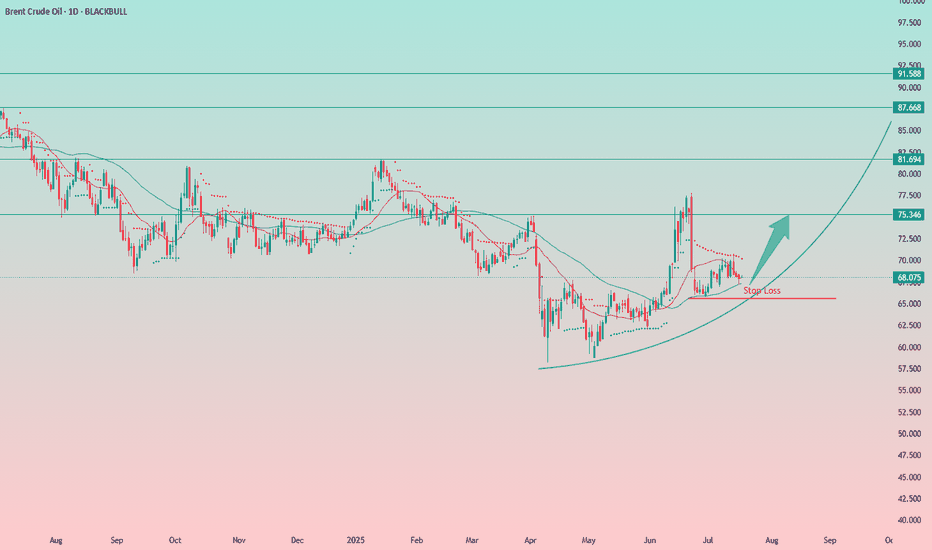
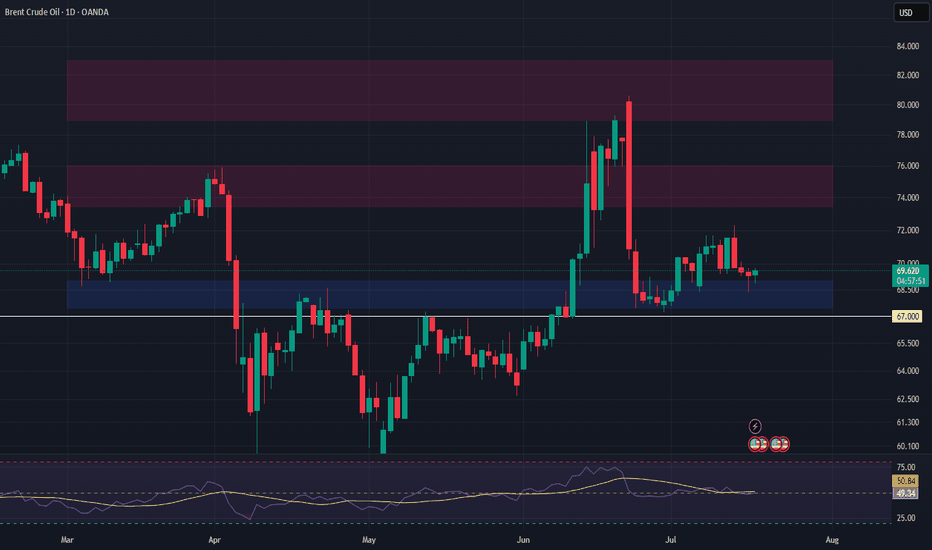
BCOUSD Long Swing Setup – Holding Support with Upside PotentialNYSE:BCO is currently sitting on a key support level, offering a potential long spot entry as buyers defend the $69.50 zone. A bounce from here could open the way for a move toward higher resistance levels.
📌 Trade Setup:
• Entry Zone: Around $69.50
• Take Profit Targets:
o 🥇 $73.50 – $76.00
o 🥈 $79.00 – $83.00
• Stop Loss: Daily close below $67.00
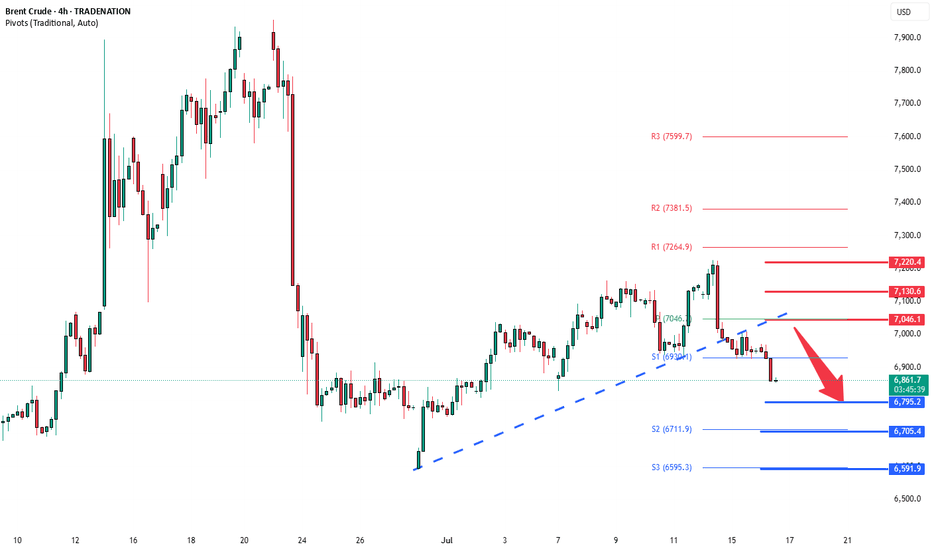
Brent Crude Oil loss of support now resistance at 7050Key Support and Resistance Levels
Resistance Level 1: 7050
Resistance Level 2: 7130
Resistance Level 3: 7220
Support Level 1: 6800
Support Level 2: 6700
Support Level 3: 6590
This communication is for informational purposes only and should not be viewed as any form of recommendation as to a particular course of action or as investment advice. It is not intended as an offer or solicitation for the purchase or sale of any financial instrument or as an official confirmation of any transaction. Opinions, estimates and assumptions expressed herein are made as of the date of this communication and are subject to change without notice. This communication has been prepared based upon information, including market prices, data and other information, believed to be reliable; however, Trade Nation does not warrant its completeness or accuracy. All market prices and market data contained in or attached to this communication are indicative and subject to change without notice.
Brent Crude Sitting at Key Support – 69.20 Hold for a Rebound?Daily Analysis:
Price is holding above the ascending trendline and forming higher lows. Multiple rejections from the 68.00 region suggest strong demand. As long as we remain above the trendline, bulls stay in control.
4H Analysis:
Pullback after rejecting 71.00. Now sitting inside the 69.60–69.20 demand area. Bullish channel is still valid unless we break below 68.50.
1H Analysis:
Price broke the rising channel but is now hovering near key support. Bullish re-entry possible if lower timeframe aligns around 69.60.
Confirmation & Entry:
If we see bullish engulfing or pin bar at 69.60–69.20, this could signal a long setup back to 71.00. Invalidated on clean break below 68.50.
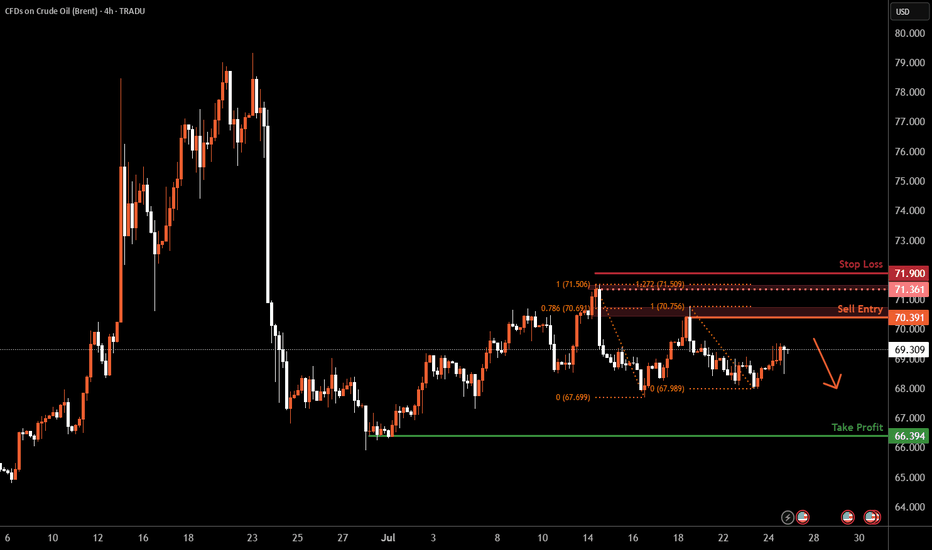
Brent Oil H4 | Heading into a swing-high resistanceBrent oil (UKOIL) is rising towards a swing-high resistance and could potentially reverse off this level to drop lower.
Sell entry is at 70.39 which is a swing-high resistance that aligns closely with the 78.6% Fibonacci retracement.
Stop loss is at 71.90 which is a level that sits above the 127.2% Fibonacci extension and a swing-high resistance.
Take profit is at 66.39 which is a swing-low support.
High Risk Investment Warning
Trading Forex/CFDs on margin carries a high level of risk and may not be suitable for all investors. Leverage can work against you.
Stratos Markets Limited (tradu.com ):
CFDs are complex instruments and come with a high risk of losing money rapidly due to leverage. 66% of retail investor accounts lose money when trading CFDs with this provider. You should consider whether you understand how CFDs work and whether you can afford to take the high risk of losing your money.
Stratos Europe Ltd (tradu.com ):
CFDs are complex instruments and come with a high risk of losing money rapidly due to leverage. 66% of retail investor accounts lose money when trading CFDs with this provider. You should consider whether you understand how CFDs work and whether you can afford to take the high risk of losing your money.
Stratos Global LLC (tradu.com ):
Losses can exceed deposits.
Please be advised that the information presented on TradingView is provided to Tradu (‘Company’, ‘we’) by a third-party provider (‘TFA Global Pte Ltd’). Please be reminded that you are solely responsible for the trading decisions on your account. There is a very high degree of risk involved in trading. Any information and/or content is intended entirely for research, educational and informational purposes only and does not constitute investment or consultation advice or investment strategy. The information is not tailored to the investment needs of any specific person and therefore does not involve a consideration of any of the investment objectives, financial situation or needs of any viewer that may receive it. Kindly also note that past performance is not a reliable indicator of future results. Actual results may differ materially from those anticipated in forward-looking or past performance statements. We assume no liability as to the accuracy or completeness of any of the information and/or content provided herein and the Company cannot be held responsible for any omission, mistake nor for any loss or damage including without limitation to any loss of profit which may arise from reliance on any information supplied by TFA Global Pte Ltd.
The speaker(s) is neither an employee, agent nor representative of Tradu and is therefore acting independently. The opinions given are their own, constitute general market commentary, and do not constitute the opinion or advice of Tradu or any form of personal or investment advice. Tradu neither endorses nor guarantees offerings of third-party speakers, nor is Tradu responsible for the content, veracity or opinions of third-party speakers, presenters or participants.
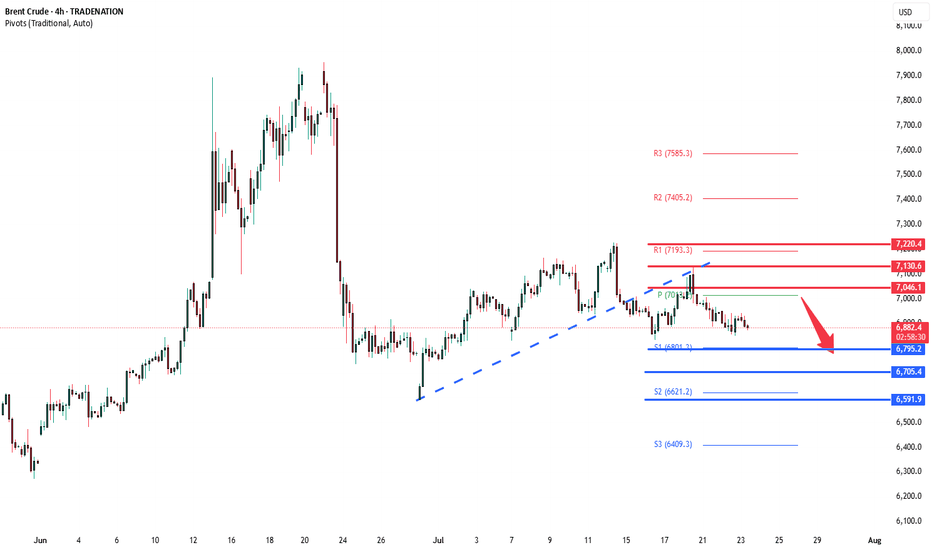
Brent Crude Oil capped by resistance at 7050 Key Support and Resistance Levels
Resistance Level 1: 7050
Resistance Level 2: 7130
Resistance Level 3: 7220
Support Level 1: 6800
Support Level 2: 6700
Support Level 3: 6590
This communication is for informational purposes only and should not be viewed as any form of recommendation as to a particular course of action or as investment advice. It is not intended as an offer or solicitation for the purchase or sale of any financial instrument or as an official confirmation of any transaction. Opinions, estimates and assumptions expressed herein are made as of the date of this communication and are subject to change without notice. This communication has been prepared based upon information, including market prices, data and other information, believed to be reliable; however, Trade Nation does not warrant its completeness or accuracy. All market prices and market data contained in or attached to this communication are indicative and subject to change without notice.
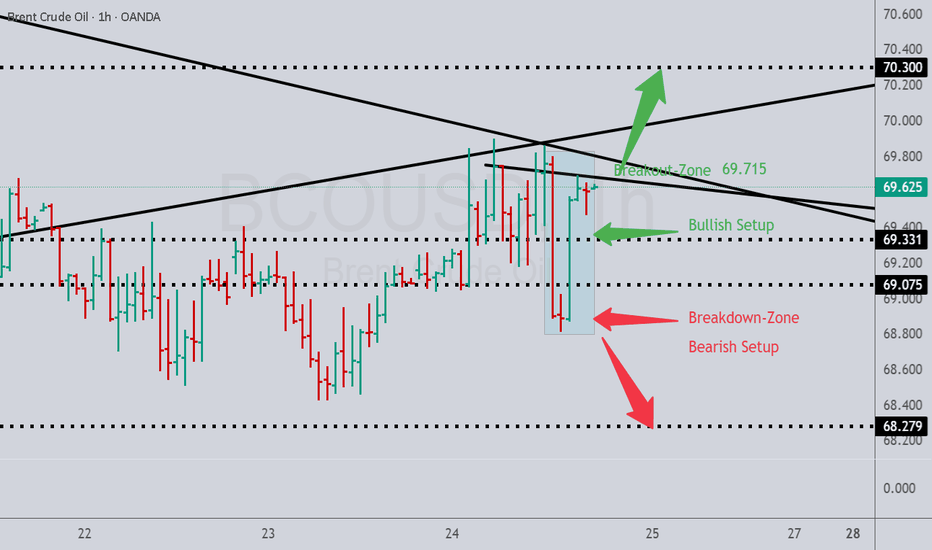
Wajani Investments analysis of BRENT AND WTI BRENT has formed a bearish flag. 80% of the time Leg1 always moves to equate Leg 2. The purple rectangle support turns resistance clarifying to false breakout of BRENT to the upside. However, if it breaks the flag to the upside, treat it as a change in trend.
Trading always carries risk, and this IS NOT A FINANCIAL ADVICE but only for EDUCATIONAL PURPOSES.
Let me know your thoughts.
Thank you.
BRENT has no choice!!🟢 BRENT has no choice!!
VELOCITY:BRENT is trading calmly amid the international volatility, this is a rare situation and the market is narrowing more and more.
✅ What pattern is unfolding in FANG?
Many patterns are unfolding together, but the most inmediate is a small triangle that will bring us some volatility once it is broken.
💰 How to trade this chart pattern?
We have multiple important supports near the price, meaning that even if the triangle breaks downwards, shorting BRENT is not a good idea right now. It's very difficult to set up a realistic TP with a tight stop loss, as we could easily see a false breakout.
Buying if the triangle breaks upwards makes more sense. A 4 to 8% profit is quite achievable, and with the correct risk management strategy, this could be a decent trade.
🛡️ The risk management strategy
As we have done in so many previous ideas, remember you can split the position in 2.
- 50% of the position in a take profits, at least, as large as your stop loss (adapt SL and this 1st TP to local supports/resistance levels). In this case, a 3% TP for 2% SL (see the chart)
- 50% of the position to a price as large as the previous pattern, which would mean a profit of 8%.
This is a difficult market to be traded right now, hope this helps!
✴️ ENJOY AND FOLLOW for more 😊
Brent Crude Oil Long Setup: Breakout, Retest, and Bullish StructOn the 1-hour timeframe, price formed a tight range after a strong downtrend. Selling pressure weakened, and buyers started stepping in. A bullish engulfing candle broke the range with high volume, signaling accumulation.
Price then retested the breakout with a wick, confirming strength. Since then, we’ve seen higher highs and higher lows — a clear sign buyers are in control and price is ready to move higher.
"UK Oil/Brent Heist Plan: Thief Style Breakout Strategy"🛢️💣 "BRENT Energy Heist Plan 💸: The Thief Trader's Playbook to Rob the UK Oil Market!" 🔫📈
🚫 This is a creative and educational overview of a market strategy. It does not encourage illegal activity. Please trade responsibly and within your own risk tolerance.
🌍 Hola! Bonjour! Marhaba! Hello, Money Makers & Market Thieves! 🤑💰📊
Welcome to the Thief Trading Style — a unique, bold, and tactical approach to trading the UK Oil Spot (Brent) market like a pro bandit on Wall Street. We don’t chase the market… we set the trap, wait, and strike like skilled robbers at the vault. 🔓💼
🧠💡Game Plan Summary:
📌 Asset: UK Oil Spot / Brent
📌 Style: Day Trade / Scalping
📌 Bias: Bullish Breakout
📌 Thief’s Method: Layered DCA Entries, Breakout Setup, Swing-Based SL, Aggressive TP
🎯 ENTRY - “The Vault Break”
🚨 Codename: Break & Retest Mission
Wait for a clean breakout above the Moving Average Wall (around 70.500) followed by a retest confirmation. That’s your green light!
✅ Buy Stop Entry: Above 70.500 after a clean candle close & retest.
✅ Buy Limit (Pullback): Near recent swing low or 15–30 min timeframe zones. Use DCA or order layering to reduce risk.
📌 Tip: Set up alerts at the breakout level — never miss the move.
🛑 STOP LOSS - “Escape Route”
🎙️ "Yo, Thief Rule #1: Plan the exit before the entry."
📍 SL suggestion: Swing Low @ 64.000 (based on 2H structure).
🧠 Risk management is key – consider your lot size, margin, and how many layered orders you're stacking.
📢 Optional: Trail that SL once price moves in your favor — lock your loot!
💸 TAKE PROFIT - “The Clean Getaway”
🎯 Target: 72.200 — but don’t be greedy. If the market gets shaky, exit before the cops (sellers) show up!
📌 Be ready to close manually if you smell reversal.
🔍 Fundamentals & Macro View
UK Oil is experiencing strong bullish momentum, driven by:
📰 Geopolitical tensions
🛢️ Supply-demand imbalances
📊 Positive sentiment & institutional flow (Check COT, Macro Outlooks, and Sentiment Reports)
👉 Stay updated with news drops and macro data that can flip the script — set economic calendar alerts.
⚠️ News Release Survival Tips
❌ Avoid new entries during high-impact news.
✅ Use trailing SL to protect running trades.
🔄 Monitor position sizing — volatile swings can eat your equity.
💥 SUPPORT THE CREW!
If you’re vibing with this Heist-Style Trading Analysis, smash that ❤️ Boost Button on TradingView and join the growing crew of market robbers making money with precision and attitude! 🏆💰📈
🚨 More Heist Plans coming soon — follow for real-time setups & updates!
📌 DISCLAIMER:
This analysis is educational and based on personal trading style. Always DYOR (Do Your Own Research), and tailor trades to your own risk profile. Markets change fast — stay agile and sharp! 🧠💼
Brent Crude Key Trading Levels Key Support and Resistance Levels
Resistance Level 1: 7260
Resistance Level 2: 7310
Resistance Level 3: 7460
Support Level 1: 6860
Support Level 2: 6760
Support Level 3: 6690
This communication is for informational purposes only and should not be viewed as any form of recommendation as to a particular course of action or as investment advice. It is not intended as an offer or solicitation for the purchase or sale of any financial instrument or as an official confirmation of any transaction. Opinions, estimates and assumptions expressed herein are made as of the date of this communication and are subject to change without notice. This communication has been prepared based upon information, including market prices, data and other information, believed to be reliable; however, Trade Nation does not warrant its completeness or accuracy. All market prices and market data contained in or attached to this communication are indicative and subject to change without notice.
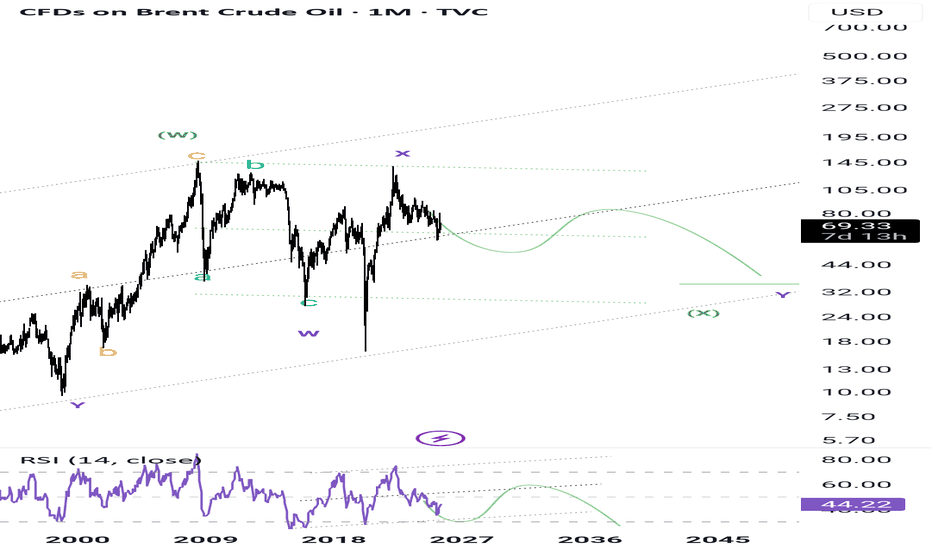
Crude oil $ukoil - Final falling oil has been a barometer of the financial market for the last decades.
I look at the formations and I see that we will see a renewal of the bottom in the coming months, I will not say the reasons, you just need to wait a little.
I've been talking about the fall for a long time, but it's not over yet.
After the final fall, I expect a renewal of the highs, due to the worsening situation in the Middle East, this will be after September
Best Regards EXCAVO
Middle East Tensions vs. Global Demand Hello Traders 🐺
🧠 Fundamental Insight:
Recent geopolitical developments in the Middle East — particularly tensions involving Iran, Israel, and unrest around the Red Sea shipping routes — have reignited fears of supply shocks in the oil market.
But how much of this is just market sentiment, and how much is a real, structural threat?
It’s important to note that most oil-producing nations in the Middle East are heavily reliant on oil revenue to sustain domestic budgets.
Prolonged disruption in oil supply would backfire economically, forcing them to eventually restore production — or risk budget deficits, currency devaluation, or inflation.
Moreover, while global efforts are pushing toward electrification and renewable energy, a large portion of electricity is still generated using fossil fuels — many of which are petroleum-based.
So even as demand shifts in form (from gasoline to electricity), crude oil remains embedded in the global energy matrix.
🇺🇸 The U.S. & 🇨🇳 China: Macro Drivers at Work
The U.S. remains the world’s largest oil producer thanks to shale output. Any significant rise in Brent can be quickly counterbalanced by a ramp-up in U.S. production.
The Fed’s monetary policy also plays a role. A stronger USD (via rate hikes) generally pressures oil prices downward.
China, as the largest importer of crude, has a decisive influence on demand. Weak industrial output or real estate troubles in China can nullify even a strong supply shock.
Watch for China’s stimulus policies — any sign of renewed growth can boost Brent significantly.
📉 Technical Outlook (Brent Crude - Weekly Chart Hypothesis):
As you can see on the weekly chart , price was trying to pump above the monthly resistance area however It's turned into the fake out and all of us knows that this is a massive sign of weakness for BRENT but I still think that price is currently could goes a little bit higher than the current level and break above the blue trend line in the mid term .
Any news-driven spike (e.g., new conflict headlines) must be validated by volume and follow-through — otherwise, it's a fade opportunity.
🎯 Conclusion:
Don’t blindly buy into every geopolitical headline.
While the Middle East remains a key risk factor for Brent, true price action will depend on the balance between physical disruptions and global demand signals — particularly from the U.S. and China.
In this market, the chart reacts first, but macro confirms the move.
As traders, we must track both — not just price, but purpose.
let me know what you are thinking about the current situation in the comment section down below !
and as always remember :
🐺 Discipline is rarely enjoyable , but almost always profitable 🐺
🐺 KIU_COIN 🐺
Here's why oil prices continue to slumpBrent Crude remains under pressure and has really caught our eye. The weakness in recent weeks is significant. The price recently failed to hold above its 200-day moving average, reinforcing downside risks. Without momentum, prices could revisit June lows unless short-term hurdles at US$69 and US$72 are decisively cleared.
This weakness aligns with BP's latest Energy Outlook, which is due out this week (usually in July each year). We'll be keeping a close on global wind and solar capacities, which are projected to increase eightfold and fourteenfold, respectively, by 2050. This rapid growth in renewables, coupled with declining oil demand, suggests a structural shift in energy markets.
China is leading this shift. By 2030, it is projected to install over 500 gigawatts of solar capacity annually, surpassing the United States' total annual energy production. This underscores the scale of China's renewable energy expansion.
The technical rejection at the 200-day moving average, combined with BP's forecasted demand peak, indicates a bearish outlook for oil. Unless Brent can reclaim and sustain levels above key resistance points, further declines are likely.
The convergence of technical weakness and shifting demand dynamics underscores a bearish stance on oil. Traders should monitor key technical levels and remain cautious amid these evolving market conditions.
The forecasts provided herein are intended for informational purposes only and should not be construed as guarantees of future performance. This is an example only to enhance a consumer's understanding of the strategy being described above and is not to be taken as Blueberry Markets providing personal advice.
Brent Crude Oil Long Swing Setup – Support Break at Key LevelBrent Crude Oil OANDA:BCOUSD has broken to the next key support level after a cease-fire announcement in the Middle East. A long position is considered only if support holds at $69.00.
📌 Trade Setup:
• Entry Zone: $69.00
• Take Profit Targets:
🥇 $73.50 – $76.00
🥈 $79.00 – $83.00
• Stop Loss: Daily close below $67.00
#BrentCrude #OilTrading #ForexTrading #LongPosition #SupportLevel #TradeSetup #CrudeOil #MarketAnalysis #TradingOpportunities #Commodities #OilMarket #Investing #PriceAction #OilPrices #TradingStrategy #ForexCommunity #InvestmentOpportunities #MarketUpdate
XBRUSD is moving within the 66.10 - 69.10 range👀 Possible scenario:
Crude oil fell to $68.00 on July 3 as markets braced for the possible return of higher U.S. tariffs after July 9 and a likely OPEC+ output hike of 411,000 bpd this weekend. Brent rebounded to $68.70.
Weak Chinese service data and a surprise 3.9M-barrel U.S. crude stock build added pressure. Gasoline inventories rose by 4.2M barrels, while distillates fell by 1.7M. Analysts expect short-term rallies to fade as bearish fundamentals—rising supply, weaker demand, and the loss of OPEC’s price support—begin to outweigh geopolitical risk. With the July 4 holiday ahead, traders are avoiding large positions.
✅Support and Resistance Levels
Now, the support level is located at 66.10.
Resistance levels are now located at 69.10 and 77.50 .
Brent Crude support at 6720Key Support and Resistance Levels
Resistance Level 1: 7060
Resistance Level 2: 7170
Resistance Level 3: 7280
Support Level 1: 6720
Support Level 2: 6610
Support Level 3: 6520
This communication is for informational purposes only and should not be viewed as any form of recommendation as to a particular course of action or as investment advice. It is not intended as an offer or solicitation for the purchase or sale of any financial instrument or as an official confirmation of any transaction. Opinions, estimates and assumptions expressed herein are made as of the date of this communication and are subject to change without notice. This communication has been prepared based upon information, including market prices, data and other information, believed to be reliable; however, Trade Nation does not warrant its completeness or accuracy. All market prices and market data contained in or attached to this communication are indicative and subject to change without notice.
