WTI crude oil Wave Analysis – 17 June 2025
- WTI crude oil reversed from round support level 70.00
- Likely to rise to resistance level 78.00
WTI crude oil recently reversed from the round support level 70.00 coinciding with the upper trendline of the recently broken up channel from May.
The downward reversal from the support level 70.00 formed the weekly Japanese candlesticks reversal pattern Bullish Engulfing – which increases the probability WTI will continue to rise in the active impulse wave C.
Given the strength of the active impulse wave C, WTI crude oil can be expected to rise to the next resistance level 78.00 (target for the completion of wave (4), which reversed the price in January).
OIL_CRUDE trade ideas

Oil Eyes $90+ as U.S.–Iran Conflict LoomsWTI Crude Oil — Bullish Reversal in Play as War Risk Escalates
Technical & Geopolitical Outlook — Weekly Chart | 17 June 2025
🧭 Current Market Condition:
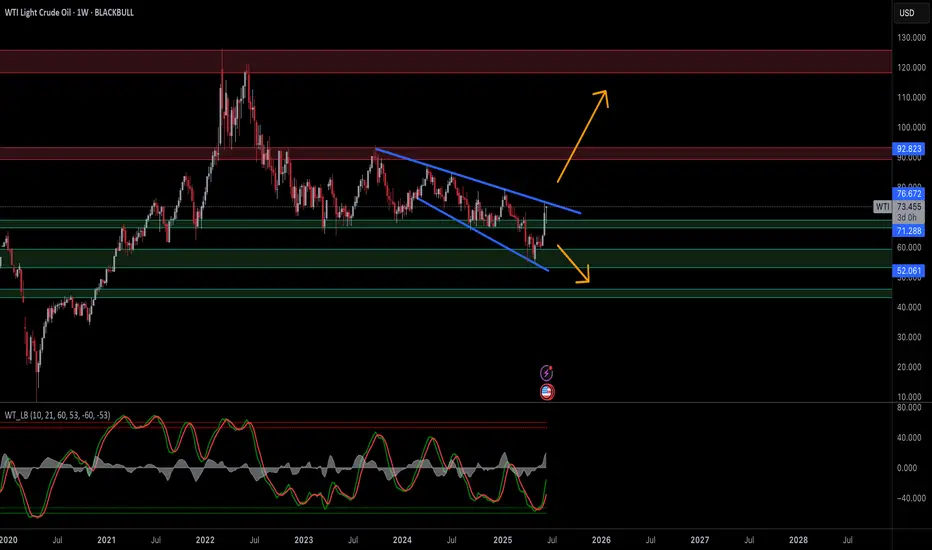
WTI crude oil is breaking out of a multi-month falling wedge, a classically bullish reversal pattern, after bouncing from the $67–68 support region. This technical move is further amplified by rising geopolitical tensions in the Middle East, particularly fears of a potential U.S. military strike on Iran, which would threaten global oil supply routes through the Strait of Hormuz.
The current breakout attempt aligns with a sentiment shift from oversold to recovery mode, supported by a sharp rise in weekly momentum indicators.
📊 Key Technical Highlights:
Bullish Falling Wedge Breakout: Price breaking above descending resistance.
Key Resistance Levels:
$76.67 – immediate supply zone
$92.82 – prior breakout area; major target if breakout sustains
Key Support Levels:
$71.28 – breakout retest level
$67.00–$68.00 – wedge base, strong historical support
$52.00 – longer-term bearish invalidation (unlikely unless demand collapses)
Momentum: Weekly stochastic sharply rising from bottom, signaling strength building.
🔺 Bullish Scenario — If U.S. Attacks Iran:
If the U.S. carries out military strikes on Iranian targets, oil prices are highly likely to:
Price in geopolitical risk premium of $10–$20/barrel.
Spike toward $90–$100 range within days or weeks due to:
Fears of supply disruption (Hormuz choke point)
Panic buying and short covering
Strategic reserves hoarding
Technical Targets:
$76.67 → Break above confirms bullish continuation
$92.82 → First major upside target
$100–$110 → Stretch target if conflict escalates or prolongs
🛢️ Energy traders and institutions typically front-run geopolitical escalations, so price can jump before any physical conflict if tensions remain unresolved or rhetoric intensifies.
🔻 Bearish Scenario — Fake Breakout or De-escalation:
Rejection from $76.67 or failure to hold above $71.28 can trigger pullbacks.
If tensions cool and Iran conflict is diplomatically diffused:
WTI may slide back toward $68.00 and re-enter the wedge.
Below $67.00, oil could revisit $60–$52 range in a risk-off macro environment.
🛡️ Risk Management & Outlook:
Geopolitical events can override technicals, especially in commodities.
Gaps, whipsaws, and sharp reversals are common — caution with overnight positions.
Consider hedging strategies or limited-risk option plays if trading leveraged oil instruments.
📢 If you found this analysis valuable, kindly consider boosting and following for more updates.
⚠️ Disclaimer: This content is intended for educational purposes only and does not constitute financial advice.
OIL🛢️ Oil is caught in an unbalanced price zone due to rising global tensions.
Prices have spiked and with that, inflation risks are back on the table.
Now here's the play I see forming:
📌 The Fed might choose not to cut interest rates as a way to cool inflation without printing more money.
📌 This also puts pressure on China to act since rising oil prices hurt their economy too, they may push Iran to scale back aggression in order to stabilize global markets.
Everything is connected. This isn’t just about oil it’s about global strategy, inflation control, and power dynamics.

WTI above $75 on fears of US involvement in Israel-Iran conflictThe Israel-Iran situation is quite different this time and with Trump announcing that *we* now have full control over Iranian skies, suggesting the US is entering the fray – hardly a surprise to be honest - this is not going to end well. The conflict may get far worse in the short-term, and this will send shockwaves through the oil markets – especially if there are disruptions in the Strait of Hurmuz. Oil prices could easily spike to $100 and higher in the worst-case scenario. So, the situation is quite serious, unfortunately. Let's hope that it quickly de-escalates and lives are not lost.
But make no mistake, this could get really big - especially with headlines like these coming out in the last few minutes:
*US OFFICIALS SAY TRUMP 'SERIOUSLY CONSIDERING' STRIKE ON IRAN: AXIOS;
*TRUMP TO MAKE POLICY DECISION ON ISRAEL-IRAN: AXIOS
*IRAN WILL SOON LAUNCH 'PUNITIVE' OPERATION AGAINST ISRAEL: IRNA
The picture is looking quite grim, unfortunately.
by Fawad Razaqzada, market analyst with FOREX.com

USOIL – Reclaiming the Energy Narrative | WaverVanir Macro Rever📉 Chart Thesis:
After nearly three years of structural decline from the $129 peak, crude oil (USOIL) is approaching a confluence zone of historic Fibonacci support ($56–$60) and a multi-year descending trendline.
This zone may mark the bottom of a long-term accumulation phase.
🧠 Strategic Perspective (WaverVanir View):
“It’s time to take back our resource. Not just politically—but economically, institutionally, and structurally.”
WaverVanir International LLC sees this setup as a rare macro pivot. This isn’t about short-term fluctuations—it’s about the global realignment of resource value in a world where:
Central banks are overleveraged
Strategic petroleum reserves are drawn down
War premium is mispriced
Real assets are undervalued
📊 Key Levels:
Support Zone: $56.04 (historical institutional buy zone)
Breakout Trigger: Trendline above $67.00
Target 1: $101.35 (0.786 Fib)
Target 2: $129.42 (1.0 Fib)
Target 3: $160.58 (1.236 Fib projection)
⚠️ Risk Disclosure:
We are not yet capitalized but actively building a legally compliant funding vehicle. No capital is currently allocated. This post is part of our vision publication cycle to build trust and transparency in WaverVanir’s thesis.
📌 Follow WaverVanir International LLC for conviction-based macro trade ideas at the intersection of data science, price action, and risk strategy.
#USOIL #MacroTrading #Commodities #WaverVanir #TradingView #QuantMacro #EnergyRevolution #FibonacciAnalysis #MarketStructure #EmergingFund

Crude Oil Tests $74FenzoFx—Crude Oil climbed to $74.0, testing the bearish Fair Value Gap and a high-volume zone.
The Stochastic Oscillator signals an overbought market, suggesting possible consolidation. Oil could dip toward the previous daily low if $74.0 holds as resistance during the NY session.
A breakout above $74.0 would invalidate the short-term bearish outlook.

The latest long - short trading recommendations for crude oil.On Monday, the two benchmark oil prices fell by more than 1% due to media reports that Iran might seek to ease the situation. However, the market's short-term optimism proved unsustainable. Currently, oil price movements are driven primarily by geopolitics rather than fundamentals. Market sensitivity to the Middle East situation has surged to an extremely high level, with even the slightest development triggering violent volatility. The possibility of supply disruptions remains high in the short term, and close attention should be paid to Iran's oil export trends and the actual execution of OPEC+ after its meeting. Meanwhile, be wary of the risk of sharp consolidation amid mixed geopolitical and negotiation news.
In terms of momentum, the fast and slow lines of the MACD indicator have crossed below the zero axis, forming a golden cross with an upward divergence, indicating a stalemate between bullish and bearish momentum. In terms of patterns, a flag continuation pattern has emerged, with penetration of the upper edge of the flag, and the overall trend is in a secondary rhythm. It is expected that crude oil prices will mainly fluctuate and consolidate within the pattern.
you are currently struggling with losses,or are unsure which of the numerous trading strategies to follow,You have the option to join our VIP program. I will assist you and provide you with accurate trading signals, enabling you to navigate the financial markets with greater confidence and potentially achieve optimal trading results.
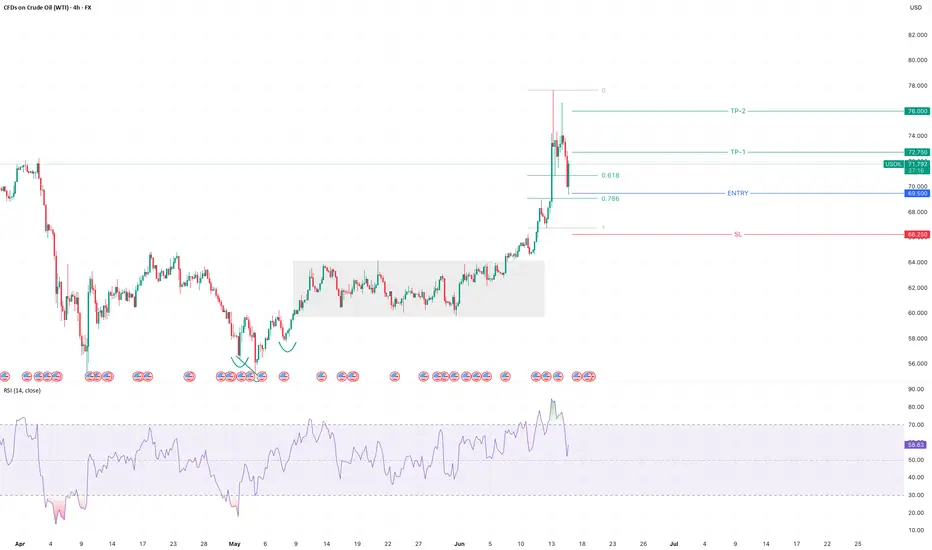
Trading Strategy:
buy@70.0-71.0
TP:74.0-75.0

WTI OIL Overbought RSI = best time to sell!WTI Oil (USOIL) has been trading within a 2-year Channel Down pattern and due to the recent Middle East geopolitical tensions, the price catapulted near its top (Lower Highs trend-line).
That made the 1D RSI overbought (>70.00) and every time that took place since September 2023, the pattern priced its Lower High and started a Bearish Leg. As a result, an overbought 1D RSI reading has been the strongest sell signal in the past 2 years.
The 'weakest' Bearish Leg after such sell signal has been -25.29%. As a result, we have turned bearish on WTI again, targeting $58.20 (-25.29%).
-------------------------------------------------------------------------------
** Please LIKE 👍, FOLLOW ✅, SHARE 🙌 and COMMENT ✍ if you enjoy this idea! Also share your ideas and charts in the comments section below! This is best way to keep it relevant, support us, keep the content here free and allow the idea to reach as many people as possible. **
-------------------------------------------------------------------------------
Disclosure: I am part of Trade Nation's Influencer program and receive a monthly fee for using their TradingView charts in my analysis.
💸💸💸💸💸💸
👇 👇 👇 👇 👇 👇

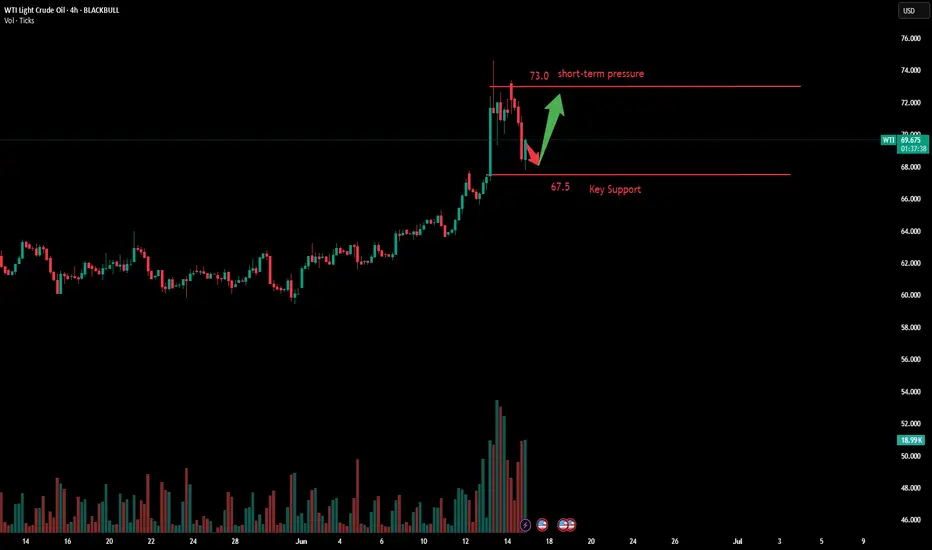
Oil Surges on Israel-Iran Nuclear Strike Fears🛢️ Israel’s attacks on Iran’s nuclear sites are pushing oil ( BLACKBULL:WTI , BLACKBULL:BRENT ) higher!
Bloomberg reports Trump’s G-7 exit and Tehran evacuation warning as Israel-Iran strikes intensify (June 17, 2025). Analysts warn of Strait of Hormuz risks, with 17M barrels/day at stake.
4H Chart Analysis:
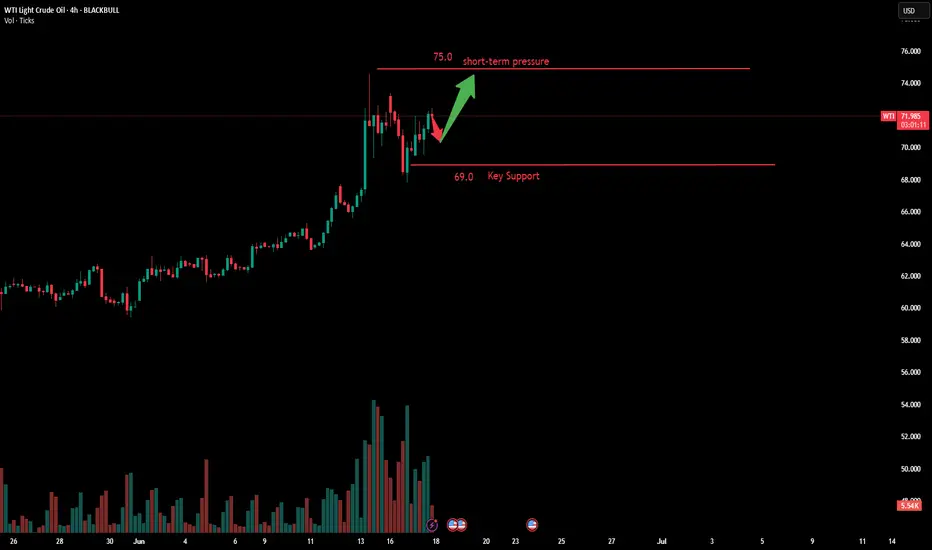
Price Action: WTI ( BLACKBULL:WTI ) broke $75 resistance (June 2025 high), exiting a 3-week range. Brent ( BLACKBULL:BRENT ) mirrors at $78.
Volume: 4H volume spiked 15% vs. prior week, confirming breakout buying.
Key Levels:
Current Support: $75 (WTI), $78 (Brent) – former resistance, now support.
Next Support: $73 (WTI), $76 (Brent) – prior range lows, tested twice in June.
Context: Oil gained 2% this week, driven by Middle East supply fears, with WTI at a 1-month high.
Trading Insight: The $75/$78 breakouts signal bullish momentum. $73-$76 is a key support zone for dips. Watch Iran retaliation news and volume for supply disruption clues.
What’s your 4H oil trade? Post your setups! 👇 #OilPrice #WTI #Brent #IsraelIran #TradingView

Long on OIL amid Israel-Iran confilctFundamental trends:
Israel-Iran conflict does not seem to end soon, Israel might target iranian facilities more
Recent insights suggest US involvement which whould lead to oil price rising.
Technical trends:
Plot seems to develope an Elliot impulse wave with clear 1-3rd waves already built. This suggests the impulse wave must end with rising on 5th wave.
Conclution
Overall trends tell in favor of future oil prices rising.
What do you think about the situation? Please, leave your comments

WTI US OIL 17 JUNE 2025 TRADE IDEAThe WTI Crude Oil (US Oil Spot) chart shows price action still trading within a long-term descending channel, bounded by dynamic resistance and support dating back to mid-2022. Currently, price has bounced strongly off the $67–$58 demand zone, rallying toward the descending trendline around $76–$78, which also aligns with key historical supply levels. This area poses a significant challenge for bulls and may trigger short-term rejection. However, the recent impulsive bullish leg suggests renewed demand, possibly driven by geopolitical uncertainty and speculation of potential supply disruption.
From a Smart Money Concept (SMC) perspective, WTI recently swept liquidity below the $58.69 low and formed a bullish Change of Character (ChoCH) as price broke through short-term structure levels. This confirms that smart money may have accumulated long positions in the discount zone. The rally targeting the $76.77–$78.30 range appears to be part of a mitigation move toward a supply zone, and traders may anticipate either a reversal or continuation depending on how price reacts near that level.
Macro & Geopolitical Context:
This bullish momentum in crude oil comes amid elevated tension between Iran and Israel, which historically injects volatility into energy markets. Any escalation could threaten oil production or export routes in the Middle East, particularly the Strait of Hormuz, through which a significant percentage of global oil supply flows. Such events can drive speculative and fundamental buying in oil, pushing prices higher in anticipation of reduced supply. However, oil traders must also remain aware of OPEC+ policy decisions and U.S. inventory data, which can quickly shift sentiment.
Trade Outlook:
Bias: Bullish until $76–$78 zone; watch for rejection or breakout.
Entry: Pullback entries between $70–$71 with bullish confirmation are ideal.
Stop Loss: Below $66 or invalidation at $64 (below structure support).
Take Profit: Conservative TP around $76.77; extended target at $78.30–$79.37.
Alternative View: Strong rejection at the descending trendline may result in a return to the $67 or even $58 support if risk-off sentiment declines or supply concerns ease.
In summary, oil is currently reacting to both technical and geopolitical catalysts. While the technical structure suggests a short- to medium-term bullish move toward the upper channel resistance, sustained upside will depend heavily on how the Iran–Israel conflict unfolds, and whether market participants anticipate further disruptions to global oil supply.
WTI Technical Analysis – WTI (1H Chart)
Structure & Momentum:
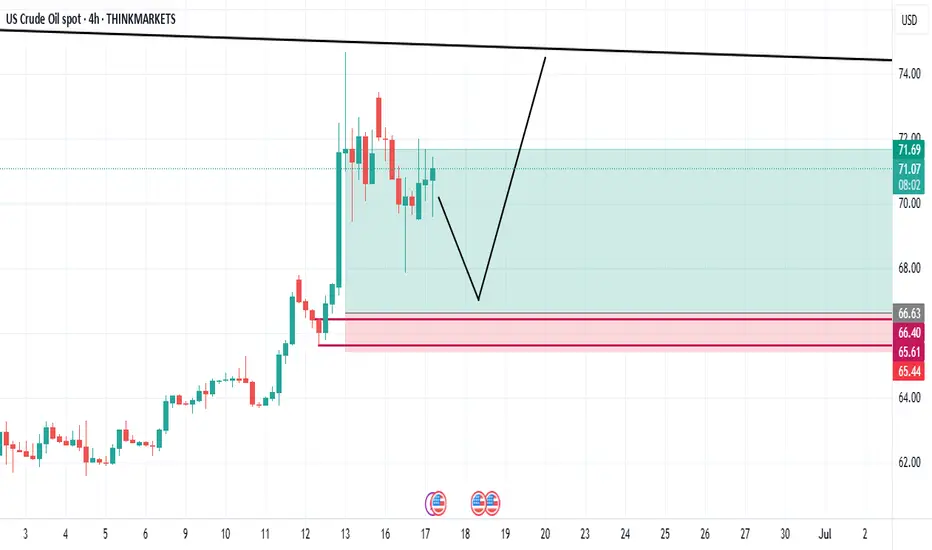
WTI recently broke out of a short-term bullish structure, forming higher highs and higher lows.
However, momentum appears to be weakening, with divergence showing between price action and volume (or internal strength), hinting at a potential short-term pullback.
Liquidity & Reaccumulating:
There’s a visible liquidity pool resting below the recent swing lows, around the $62 level, which aligns with a bullish order block or prior consolidation zone on the 1H chart.
If price revisits this zone, it would likely be a liquidity grab followed by reaccumulating.
✅ Scenario Outlook:
"WTI might pull back to the $62 area to clear resting liquidity and mitigate previous demand imbalances. If the level holds with strong bullish intent, we can expect a continuation toward higher levels—targeting the $67–$70 range in the coming sessions."
Trade Setup Concept (SMC-style):
Wait for price to sweep the $62 level.
Look for a shift in market structure (CHOCH) on lower timeframes from bearish to bullish.
Entry: Post-CHOCH confirmation above local high.
SL: Below liquidity sweep.
TP1: $66.80
TP2: $69.90
🛢️ Geopolitical Context:
If Iran retaliates directly or if Strait of Hormuz tensions rise, crude could spike suddenly.
But U.S. SPR releases or weak global demand data might offset rallies—watch macro data.

OIL VS GOLD : COMMODITIESHELLO THERE.
Fine ? Me no, i'm tired.
OIL VS GOLD
We have a historical canal and OIL is very out if this. Do you believe it's for IRAN ? No, it's not, OIL just take an excuse for up.
Gold will fall ? No but oil will up because all currencies are destroy. So oil have to go up.
Imagine the consequences for the inflation now, when OIL WILL reach the white line of stabilisation : x3 versus GOLD.
Low indicator show a reversal.
Buy some OIL COMPANIES.
GL

Crude oil bullish expectations4-hour cycle, interesting cup-handle pattern
Pay attention to the reversal signal of the 4-hour demand zone

US OIL SHORT RESULT Crude oil eventually broke out of the major 4HTF Bearish falling Trendline, Moving against our direction as I thought it might respect the Resistance Trendline and dump.
But apparently I entered too early and should've waited for reversal signs or fake outs.
And done better Technical Analysis and 4HTF Trend.

WTI rebounds from key support as Middle East tensions intensifyThe latest escalation in the conflict between Israel and Iran initially didn't cause much panic in the oil market. After spiking initially to an overnight high of $75.70, WTI has since been on a decline, before hitting a low so far of $68.50. That represents a 9.5% drop from the overnight high, which is massive. Investors have been pricing out the risk of of oil supplies being meaningfully impacted. But the latest air strikes on Tehran and Israel declaring that it had "full aerial operational control" over Tehran means tension are rising another bombardment of Tel Aviv was most likely on the agenda for Iran. Oil has been bouncing back as a result. So far, it hasn't impacted equities, with major US indices remaining near their session highs. But will that change if oil extends it recovery?
Key support at $68.60 has been defended as we can see on the hourly chart. $70.00/$70.10 is now reclaimed, which is a bullish sign. Resistance is seen around $72.20. Above that, $73.00 will be in focus.
By Fawad Razaqzada, market analyst with FOREX.com

USOIL - BullishUSOIL has retraced well in a bullish trend. Current war situation is also supporiting bullish bias fundamentally.
Crude oil continues to decline - latest market trend analysisThe international oil market is currently experiencing a classic upward cycle of "geopolitical risk premium". In the short term, oil prices will be highly sensitive to any news regarding the security of the Strait of Hormuz. Crude oil has continued its volatile upward trend in the short term, surging to test the price near $74. The moving average system is bullishly aligned with oil prices, and the objective short-term trend direction remains upward.
In early trading, oil prices hit a new high near $75.30, but then surged and fell, closing with a bearish real body K-line. The short-term momentum still favors the bulls, and it is expected that the intraday trend of crude oil will continue to maintain a high-level volatile upward rhythm.
you are currently struggling with losses,or are unsure which of the numerous trading strategies to follow,You have the option to join our VIP program. I will assist you and provide you with accurate trading signals, enabling you to navigate the financial markets with greater confidence and potentially achieve optimal trading results.
Trading Strategy:
buy@68.5.0-69.5
TP:73.0-74.0
WTI - ANALYSIS BUY AREA This week the ongoing conflict seems to bring more uptrend to this commodity
I believe that the last broken resistance now turning support at 67.300 will be tested prior to the OIL raising again
If the conflict doesn’t end and we don’t have a ceasefire we could see this commodity running to the 78.000 and 82.000 levels

Crude Oil Challenges 2-Year ChannelAmid rising summer demand, an inverted head and shoulders breakout from oversold 2020 levels, and the recent outbreak of war between Israel and Iran, crude oil has tested the upper boundary of the declining channel originating from the 2022 highs. This test comes as supply risks for the coming month intensify.
This upper boundary aligns with the $77 resistance level. A confirmed breakout and sustained hold above this level could shift momentum more decisively to the bullish side, potentially paving the way for a retest of the $80 and $83.50 levels.
On the downside, if oil fails to maintain its gains and resumes a pullback, key support zones are located around $69, $66, and $64, reestablishing bearish dominance within the channel.
— Razan Hilal, CMT

USOIL:Go long
USOIL: Short-term momentum is still dominant, the trend of crude oil is expected to maintain a high shock upward rhythm.
Trading Strategy:
BUY@70.5-71
TP: 73-73.6
↓↓↓ More detailed strategies and trading will be notified here ↗↗↗
↓↓↓ Keep updated, come to "get" ↗↗↗

Oil (WTI) – Geo-Political Concerns Drive SentimentA quickly escalating conflict in the Middle East between Israel and Iran has seen Oil (WTI) volatility increase dramatically as the focus for traders has shifted overnight from worries about an on-going lack of demand due to a slowing global economy over to major supply concerns moving forward from this oil rich region.
This shift has seen Oil trade from lows of 60.17 on May 30th, to an early Monday high of 76.31, as weekend attacks by Israel on Iran's energy infrastructure introduced more uncertainty at the start of this new trading week regarding Israel's future strategy in this conflict. Prices have since settled down and moved back towards 72.80 (0830 BST) at time of writing but looking forward traders may need to balance the potential for further escalation/duration of this conflict against extra Oil production/supply from OPEC+ and the US.
Also important for Oil prices across the week could be the outcome of the Federal Reserve (Fed) Interest Rate Decision (Wed 1900 BST) and Press Conference (Wed 1930 BST). No change to interest rates is expected, but the updates from Fed policymakers to their inflation and interest rate expectations for the rest of 2025 could have a major impact on risk sentiment, the dollar and anticipated Oil demand.
Technical Update: Utilising Bollinger Bands
A rise in tensions in the Middle East last week prompted a sharp acceleration higher in the price of Oil. This saw price volatility increase, reflected by the widening upper and lower Bollinger bands and prices trading to levels last seen in late January 2025, as the chart below shows.
Traders will now likely be wondering if this type of price strength can continue, or if prices can enter a correction phase, even possibly a more extended period of price weakness.
Much will clearly depend on future market sentiment and price trends, and on any easing or escalation in geo-political tensions. However, with this in mind let's consider what may be the relevant support and resistance levels .
Potential Resistance Levels:
As the chart shows below, interestingly, last weeks price strength stalled against 75.99, which is equal to the February 3rd session high and with a setback in price developing from it so far today, this might be viewed by some as a potential first resistance.
As such, while not a guarantee of further price strength, closing breaks above 75.99 may be a sign of continued upside momentum towards 81.01, which is the January 15th price high and a potential next resistance focus for traders.
Potential Support Levels:
After such a strong advance in price, it might be harder to establish support levels, although, Fibonacci retracement levels on the recent May 30th to June 16th upside move in price, might prove useful. These retracement levels are highlighted on the chart below.
The 38.2% Fibonacci retracement of the price strength stands at 70.12 and this might prove to be a possible first support focus, if price weakness is seen over coming days. Closing breaks below 70.12, if seen, may then lead to declines towards 66.32, the deeper 61.8% Fibonacci retracement level.
The material provided here has not been prepared
accordance with legal requirements designed to promote the independence of investment research and as such is considered to be a marketing communication. Whilst it is not subject to any prohibition on dealing ahead of the dissemination of investment research, we will not seek to take any advantage before providing it to our clients.
Pepperstone doesn’t represent that the material provided here is accurate, current or complete, and therefore shouldn’t be relied upon as such. The information, whether from a third party or not, isn’t to be considered as a recommendation; or an offer to buy or sell; or the solicitation of an offer to buy or sell any security, financial product or instrument; or to participate in any particular trading strategy. It does not take into account readers’ financial situation or investment objectives. We advise any readers of this content to seek their own advice. Without the approval of Pepperstone, reproduction or redistribution of this information isn’t permitted.
