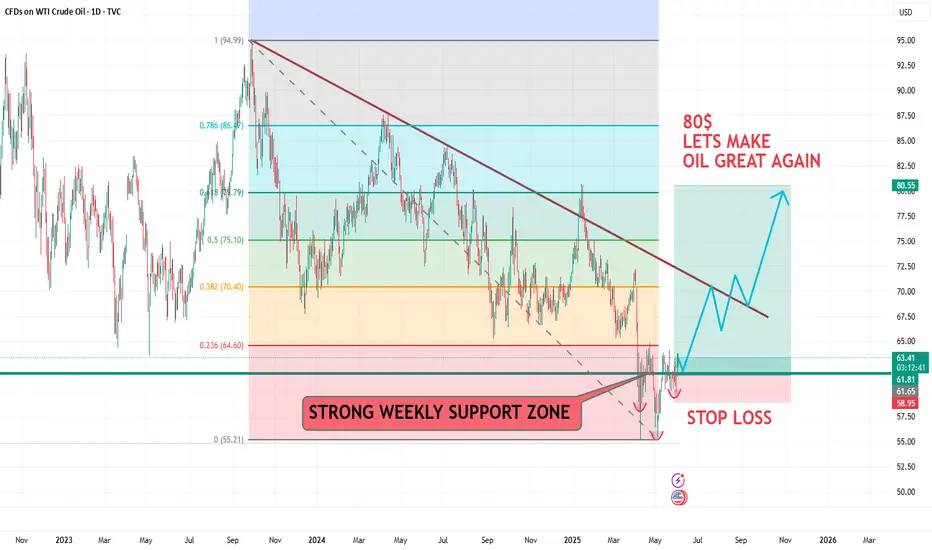
USOIL LETS MAKE OIL GREAT AGAIN TO 80$HELLO TRADERS
As i can see USOIL it formaing H & S pattrent and now trading above a strong Weekly horizontal Support zone if prices hold above 65$ then given Tp can be easy target if we see a higher demand and tight supply with the War going on around the world its a huge possibilty that pricce can shoot up we have to monitor the 65$ price zone which is importat to hold bull cycle on smaller TF 4HR it is creating Wickoff pattren too and we can see Fibo levels golden ratio can hit our targers or risk reward is great for us becaus we was buying the dip in May it is just starting chart is crystal clear its just a trade idea share your thoughts we appriciate ur comments and support Stay tuned for more updates
OIL_CRUDE trade ideas
Nice triangle setup on the crude in the 4th wave position triangle in the 4th wave position of C leg lower .... now all we need to do is break

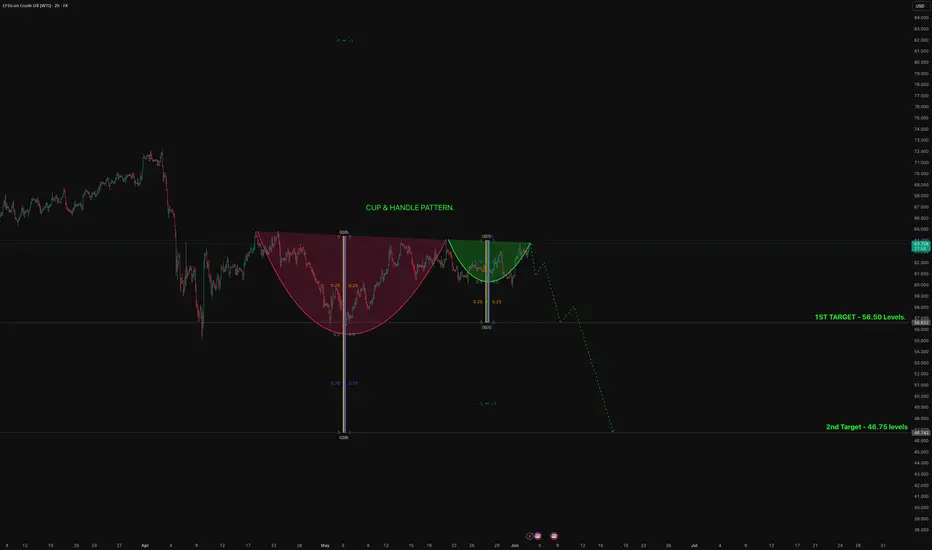
Crude Oil (WTI) - Cup and Handle PatternCrude Oil (WTI) - Cup and Handle Pattern Breakdown
Chart Overview:
The chart displays a clearly formed Cup and Handle Pattern — a classic technical formation often followed by aggressive moves.
Cup Formation: Smooth rounding bottom showing accumulation phase, with resistance near $66.5.
Handle Formation: Slight pullback consolidating below resistance, typical before a breakdown.
Technical Interpretation:
The Cup and Handle pattern is typically considered a bullish continuation pattern. However, in this case, the price has failed to break above the resistance, suggesting a bearish reversal.
Bearish Breakdown Expected: Instead of breaking out to the upside, price action suggests a breakdown — making the Cup and Handle act as a reversal pattern.
Targets:
First Target:
56.50 USD
This level aligns with the measured move technique where the depth of the cup is projected downward from the breakdown point.
Second Target:
46.75 USD
This target is based on further extension, likely a Fibonacci projection or the full cup depth extension in bearish scenario.
Key Observations:
Pattern Completion: The handle part has completed and price is hesitating near the neckline.
Volume Confirmation: (Assumed from typical setups) — Breakdown from the handle zone usually needs a surge in volume to confirm the bearish move.
Trend Structure: Lower highs and lower lows forming after the peak of the handle indicate growing selling pressure.
Measured Move Logic:
The height of the Cup (from the bottom to resistance) is projected downward.
Extension projections justify the second target of 46.75 USD.
Risk Factors:
Watch for any false breakdown — if price reverses and reclaims above the handle resistance (~66.5 USD), the pattern would be invalidated.
Macroeconomic news (OPEC meetings, inventory data, geopolitical tensions) can impact Crude Oil prices unpredictably.
Summary:
Pattern: Cup & Handle (Bearish Reversal)
Breakdown Expectation: Strong, impulsive.
Immediate Target: 56.50 USD
Extended Target: 46.75 USD
Invalidation: Close above 66.50 USD.
Disclaimer:
This analysis is for educational purposes only and does not constitute investment advice. Trading in crude oil or any commodity involves significant risk and you should consult your financial advisor before making trading decisions.
Crude oil surges stronglyInternational oil prices rose in early Asian trading on Tuesday, primarily driven by heightened risks of supply disruptions. Iran is expected to reject a U.S.-proposed nuclear deal proposal that could have paved the way for easing sanctions on Iranian oil exports. Additionally, wildfires in Alberta, Canada, have suspended part of oil and gas production, exacerbating market concerns about supply. Brent crude rose 0.85% to $65.18 per barrel, while U.S. West Texas Intermediate (WTI) crude gained 0.75% to $62.97, extending a nearly 3% rally from the previous session.
The current oil price surge reflects the effect (superimposition) of multiple factors, including geopolitical uncertainties and sudden natural disasters. Notably, the market’s reaction to the OPEC+ production increase strategy highlights its high sensitivity to supply-side control. The Iran and Canada incidents have further underscored the short-term vulnerability of the global oil market. If U.S.-Iran negotiations completely collapse or wildfires continue to spread, oil prices may sustain their upward momentum.
Technically, the K-line chart has repeatedly formed bullish candlesticks with long lower shadows and small real bodies, indicating strong buying support at lower levels. Short-term intraday crude oil is expected to retain further upside potential.
Humans need to breathe, and perfect trading is like breathing—maintaining flexibility without needing to trade every market swing. The secret to profitable trading lies in implementing simple rules: repeating simple tasks consistently and enforcing them strictly over the long term.
Trading Strategy:
buy@62.0-62.5
TP:63.5-64.0

CRUDE OIL Swing Short! Sell!
Hello,Traders!
USOIL keeps growing
And Oil is locally overbought
So after the price hit a very
Strong resistance level
Around 65.00$ we will be
Expecting a pullback and
A local bearish correction
Sell!
Comment and subscribe to help us grow!
Check out other forecasts below too!
Disclosure: I am part of Trade Nation's Influencer program and receive a monthly fee for using their TradingView charts in my analysis.

USOIL:Go long
Crude oil prices rose due to ongoing tariff uncertainty as well as ongoing geopolitical tensions in the Middle East.
From the chart, the K line has repeatedly appeared long lower shadow small solid positive line, indicating that the lower buying long support is strong. Expected intraday crude oil short - term trend still exists a wave of upward space.
Trading Strategy:
BUY@62.5-62.6
TP: 63.5-64
↓↓↓ More detailed strategies and trading will be notified here ↗↗↗
↓↓↓ Keep updated, come to "get" ↗↗↗

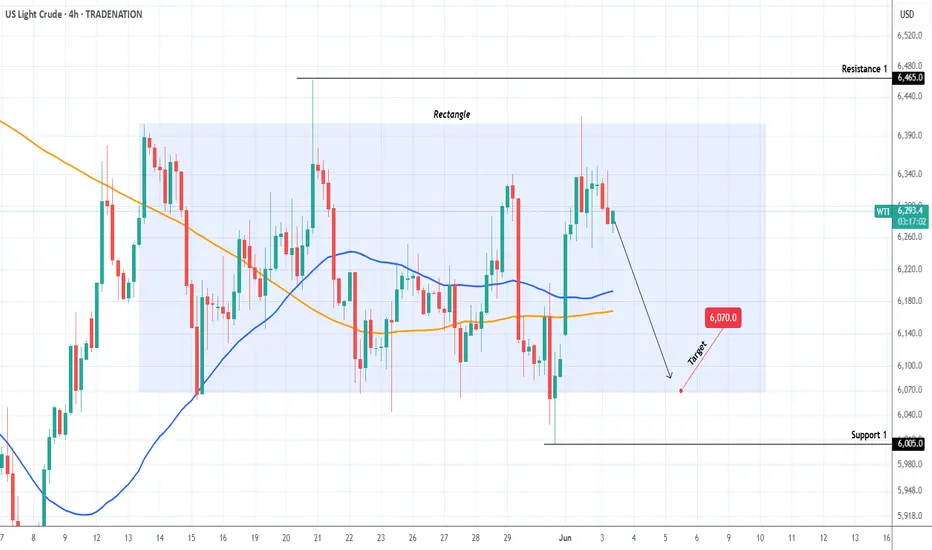
WTI OIL The perfect scalping Rectangle.WTI Oil (USOIL) has been trading within a 3-week Rectangle pattern since the May 13th High and yesterday it got rejected on its top. This is a technical sell signal, with it natural target being the bottom of the pattern at $60.70.
-------------------------------------------------------------------------------
** Please LIKE 👍, FOLLOW ✅, SHARE 🙌 and COMMENT ✍ if you enjoy this idea! Also share your ideas and charts in the comments section below! This is best way to keep it relevant, support us, keep the content here free and allow the idea to reach as many people as possible. **
-------------------------------------------------------------------------------
Disclosure: I am part of Trade Nation's Influencer program and receive a monthly fee for using their TradingView charts in my analysis.
💸💸💸💸💸💸
👇 👇 👇 👇 👇 👇
BEARISH REVERSAL price has hit strong daily resistance and formed a head and shoulder structure. this could possibly be a sign of reversal and sellers gaining momentum again


The first crude oil target was reached perfectly
💡Message Strategy
Last Friday (May 31), oil prices fell slightly as traders generally expected OPEC+ to "play a big trick" - increasing production in July to more than 500,000 barrels per day.
Potential risks: The supply and demand game is not over
OPEC+'s production increase plan still faces implementation difficulties. Countries such as Kazakhstan have previously refused to cut production, and the actual production capacity of some member countries (such as Nigeria and Angola) is close to the upper limit. If global demand declines due to expectations of economic recession, OPEC+'s "moderate production increase" may evolve into "passive inventory accumulation", thereby suppressing medium- and long-term oil prices.
Short-term supply concerns: Russia is the world's second largest crude oil exporter. If its military facilities are frequently attacked, it may affect the stability of its energy infrastructure.
"Extreme pressure" before negotiations: The attack occurred on the eve of the ceasefire negotiations between Russia and Ukraine. Ukraine tried to increase its bargaining chips through military actions. If the negotiations fail, Western sanctions against Russia may be increased, further disrupting crude oil trade flows.
Risk premium returns: Geopolitical conflicts have always been a "fuel" for oil prices. When the war between Russia and Ukraine broke out in 2022, Brent crude oil once surged to $139 per barrel. Although the current supply and demand environment is different, the market's sensitivity to emergencies remains.
📊Technical aspects
Crude oil fluctuated in a range last week, with a minimum of 59.8 and a maximum of 63. The weekly line closed at 60.7. The weekly line shows that oil prices are in an upward channel and there is a rebound. The focus is on whether 64 can be broken through. The daily line shows a large range of fluctuations. In summary, this week's operation ideas are mainly based on callbacks and longs. First look at the 63-61-58 range. In the day, the four-hour line is range-oscillated. First look at 4 on the top. The hourly line is oscillating upward. Today's big rise has come to our first target position, rising to the 63 line. From the shape, there is still room for growth. In summary, the intraday operation ideas are mainly oscillating upward, and the focus is on 61 and 60 below.
💰 Strategy Package
Long Position: 61.50-62.00

There remains a risk of further downside for crude oil prices.During Monday's US trading session, international oil prices rebounded strongly. The main US crude contract surged 2.5% at one point to $62.31 per barrel, while the August Brent crude futures also rose more than 2% to $64.12 per barrel. Two key drivers underlie this rally: OPEC+'s maintenance of a "modest production increase" strategy at its weekend meeting, and Ukraine's surprise attack on a Russian military airfield. The crude oil market is currently in a dual game of "policy and geopolitics": OPEC+ seeks to balance the market with "modest production increases," while Ukraine's raid serves as a reminder that black swans are never far away.
Short-term Outlook:
US oil prices may remain range-bound between $60-$64 per barrel.
However, if the Russia-Ukraine conflict deteriorates or internal rifts within OPEC+ deepen, a new round of violent volatility (sharp rallies or crashes) cannot be ruled out.
Technical Analysis:
Early trading saw oil prices consolidate in a narrow range near $61, reflecting a secondary rhythm.
The MACD indicator is bearishly diverging below the zero axis with strong bearish momentum, suggesting a risk of continued downward movement in crude oil prices during the session.
Trading Strategy:
sell@63.5-64.0
TP:61.6-62.0

Trade on your on risk after calculating ur risk to reward ratio.On 4 hourly time frame of WTI. A well formed bearish tailed bar on the resistance zone indicates that markets still wants to go down after all the bull run since the market opens today.

SPX GOLD BTC USOIL - start of JuneAll in the video. SPX is still sideways so far, nothing has changed and the bias is still up. Gold looks like it will test it's recent tops. BTC bias is now bearish. US oil is in a tight balance.

Crude oil is moving upward again, testing 63 today
💡Message Strategy
The Organization of the Petroleum Exporting Countries and its allies (OPEC+) met at their headquarters in Vienna on Wednesday to assess the current oil market situation. WTI crude oil prices climbed above $62 as OPEC+ said there would be no immediate change to current production policies.
📊Technical aspects
From the daily chart level, the medium-term moving average system suppresses the rebound of oil prices, and the medium-term objective trend is downward. After the oil price hit the low point of 55.20, the frequent alternation of long and short positions formed, and the embryonic form of a falling flag relay appeared from the shape. Pay attention to the strength of the oil price testing the upper edge of the flag. It is expected that after the medium-term trend fluctuates, it will still rise to the 64 position.
The short-term (1H) trend of crude oil fluctuates upward, and the oil price breaks through the 62.5 resistance level. The moving average system diverges and arranges upward, and the short-term objective trend direction is upward. In terms of momentum, the MACD indicator is above the zero axis and the golden cross opens upward, and the bullish momentum is sufficient. It is expected that the crude oil trend will continue to rise within the day.
💰 Strategy Package
Long Position: 61.20-62.00

Market Analysis: WTI Crude Oil Price Could Gain Bullish PaceMarket Analysis: WTI Crude Oil Price Could Gain Bullish Pace
WTI Crude Oil is gaining bullish momentum and might even test $62.75.
Important Takeaways for WTI Crude Oil Price Analysis Today
- WTI Crude Oil climbed above the $60.50 and $60.80 resistance levels.
- There was a break above a key bearish trend line with resistance at $60.80 on the hourly chart of XTI/USD at FXOpen.
WTI Crude Oil Price Technical Analysis
On the hourly chart of WTI Crude Oil at FXOpen, the price started a fresh upward move from $59.45 against the US Dollar. The price gained bullish momentum after it broke the $60.00 resistance.
The bulls pushed the price above the 50% Fib retracement level of the downward move from the $62.76 swing high to the $59.45 low. The price even climbed above the 50-hour simple moving average. Besides, there was a break above a key bearish trend line with resistance at $60.80.
It tested the $61.50 resistance zone and the 61.8% Fib retracement level of the downward move from the $62.76 swing high to the $59.45 low.
The RSI is now near the 50 level and the price could aim for more gains. If the price climbs higher again, it could face resistance near $62.00. The next major resistance is near the $62.75 level. Any more gains might send the price toward the $63.45 level or even $65.00.
Conversely, the price might correct gains and test the $60.80 support level. The next major support on the WTI Crude Oil chart is near the $59.45 zone, below which the price could test the $58.00 zone.
If there is a downside break, the price might decline toward $56.50. Any more losses may perhaps open the doors for a move toward the $55.50 support zone.
This article represents the opinion of the Companies operating under the FXOpen brand only. It is not to be construed as an offer, solicitation, or recommendation with respect to products and services provided by the Companies operating under the FXOpen brand, nor is it to be considered financial advice.

WTI PRICE SURGED HIGH!! Price of oil ticked high today!! I anticipate bullish price action to develop away from the current market price. I expect price to trade all the way up to $67 per barrel.
Technically, price holds firm at $62 level after it found support at $56.82 level

Oil Sell IdeaUSOil i belive after this lq taken it's possible to move down side. if you want more confirmation so wait for LTF Confirmation.

WTI Oil H1 | Falling toward an overlap supportWTI oil (USOIL) is falling towards an overlap support and could potentially bounce off this level to climb higher.
Buy entry is at 61.52 which is an overlap support that aligns with the 38.2% Fibonacci retracement.
Stop loss is at 59.60 which is a level that lies underneath a multi-swing-low support.
Take profit is at 63.00 which is a swing-high resistance.
High Risk Investment Warning
Trading Forex/CFDs on margin carries a high level of risk and may not be suitable for all investors. Leverage can work against you.
Stratos Markets Limited (tradu.com ):
CFDs are complex instruments and come with a high risk of losing money rapidly due to leverage. 63% of retail investor accounts lose money when trading CFDs with this provider. You should consider whether you understand how CFDs work and whether you can afford to take the high risk of losing your money.
Stratos Europe Ltd (tradu.com ):
CFDs are complex instruments and come with a high risk of losing money rapidly due to leverage. 63% of retail investor accounts lose money when trading CFDs with this provider. You should consider whether you understand how CFDs work and whether you can afford to take the high risk of losing your money.
Stratos Global LLC (tradu.com ):
Losses can exceed deposits.
Please be advised that the information presented on TradingView is provided to Tradu (‘Company’, ‘we’) by a third-party provider (‘TFA Global Pte Ltd’). Please be reminded that you are solely responsible for the trading decisions on your account. There is a very high degree of risk involved in trading. Any information and/or content is intended entirely for research, educational and informational purposes only and does not constitute investment or consultation advice or investment strategy. The information is not tailored to the investment needs of any specific person and therefore does not involve a consideration of any of the investment objectives, financial situation or needs of any viewer that may receive it. Kindly also note that past performance is not a reliable indicator of future results. Actual results may differ materially from those anticipated in forward-looking or past performance statements. We assume no liability as to the accuracy or completeness of any of the information and/or content provided herein and the Company cannot be held responsible for any omission, mistake nor for any loss or damage including without limitation to any loss of profit which may arise from reliance on any information supplied by TFA Global Pte Ltd.
The speaker(s) is neither an employee, agent nor representative of Tradu and is therefore acting independently. The opinions given are their own, constitute general market commentary, and do not constitute the opinion or advice of Tradu or any form of personal or investment advice. Tradu neither endorses nor guarantees offerings of third-party speakers, nor is Tradu responsible for the content, veracity or opinions of third-party speakers, presenters or participants.

WTI IdeaOverall, OILUSD seems bearish and it is confirming the bears with this bearish flag pattern. expect price to test and break support before retracing to the supply area for the main move

Crude oil settles before the breakoutCrude oil is losing volatility, having locked in a narrow trading range. Usually that deprives the market from a directional bias, but increases the odds of spikes and quick liquidity moves to the edges of the trading range and beyond with a possible mean-reversion activity followed after (as shown at the chart).
Given the lack of driving narratives, it’s possible to observe quick breakouts to both sides of the current trading range and further slowing down.
That opens some opportunities for day traders, but for swing and position traders, opportunities might be limited for now.
Traders will monitor for the petroleum status report and stock changes for the oil on Wednesday (regular report from eia.gov).
Don't forget - this is just the idea, always do your own research and never forget to manage your risk!

USOIL Today's Trading Strategy Hope this helps you### (1)Significant Pressure on the Supply Side
OPEC+ has a strong expectation to increase production, with some oil-producing countries planning to further raise output in July. Core producers such as Saudi Arabia and the United Arab Emirates have ample idle capacity and can rapidly expand supply. The resurgent production activity of U.S. shale oil enterprises, with an increase in the number of drilling rigs and sustained production growth, has further exacerbated the global crude oil supply glut. Once OPEC+'s production increase plan is implemented, the supply of crude oil in the market will surge. In the absence of a significant improvement in demand, oil prices will inevitably face enormous downward pressure.
### (2)Weak Demand Growth
The global economic recovery has been slow, with economic growth data in some countries and regions falling short of expectations. Sluggish industrial production activities have made it difficult to boost demand for crude oil. The rapid development and widespread application of new energy technologies have also been continuously squeezing the market space for crude oil, as more and more sectors are using clean energy as a substitute for crude oil, leading to limited growth in crude oil demand. In addition, recently released economic data show that the manufacturing purchasing managers' index (PMI) in many countries is below the expansion-contraction threshold, indicating that demand for crude oil from industrial production will continue to be weak in the future.
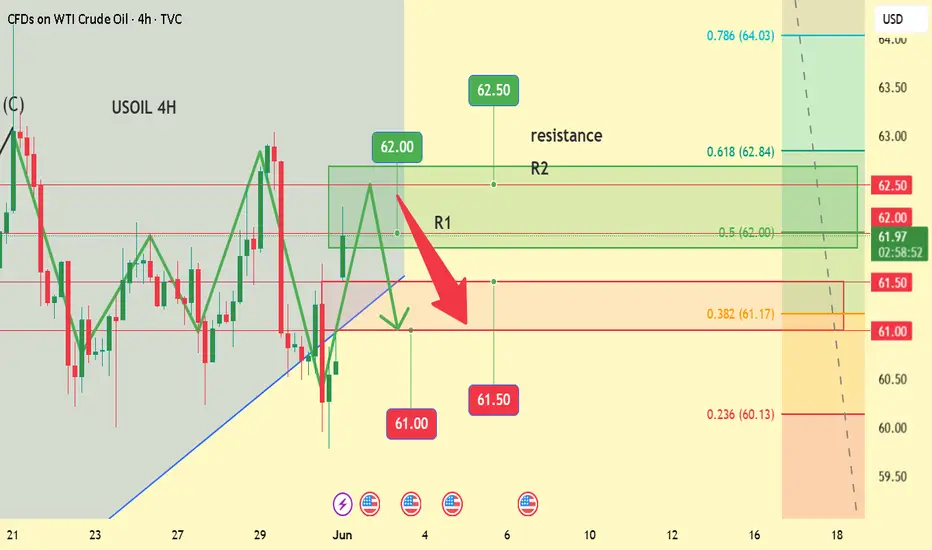
From a technical analysis perspective, crude oil prices face strong resistance in the $62-$62.50 range, with the price repeatedly encountering resistance and falling back in this area in the past. The current price is approaching this resistance zone, and if it fails to break through effectively, the price is highly likely to reverse and decline. At the same time, the moving average system is in a bearish arrangement, with short-term moving averages suppressing long-term ones. Technical indicators such as MACD and KDJ also suggest a downward trend in prices, further validating the possibility of shorting.
USOIL Today's Trading Strategy Hope this helps you
USOIL SELL@62~62.5
SL:63.5
TP:61~61.5
USOIL: Bullish Forecast & Bullish Scenario
The price of USOIL will most likely increase soon enough, due to the demand beginning to exceed supply which we can see by looking at the chart of the pair.
Disclosure: I am part of Trade Nation's Influencer program and receive a monthly fee for using their TradingView charts in my analysis.
❤️ Please, support our work with like & comment! ❤️

The bears continue to dominate!Oil prices fluctuated lower this week, primarily pressured by the repeated U.S. tariff policies and expectations of OPEC+ production increases. During Friday's Asian session, Brent crude oil futures fell 0.41% to $63.89 per barrel, while U.S. WTI crude oil futures declined 0.44% to $60.67. The Brent July futures contract is set to expire on Friday. The tariffs imposed by U.S. President Trump were originally suspended, but the U.S. Federal Appellate Court temporarily reinstated them on Thursday, overturning the trade court's suspension ruling made on Wednesday. This legal volatility caused oil prices to plummet by more than 1% on Thursday.
The crude oil market this week has shown high sensitivity, influenced not only by legal rulings but also by dual pressures from geopolitical tensions and internal coordination imbalances within the organization. Under the intertwined effects of tariffs and production expectations, oil prices have struggled to achieve directional breakthroughs. If OPEC+ fails to reach an agreement on production control and demand from Asian countries and other major consumers has not recovered, oil prices are likely to maintain a weak oscillating pattern in the coming weeks. The MACD indicator is opening downward below the zero axis, with strong bearish momentum, suggesting a risk of further downside for crude oil during the day.
Overall, for next week's crude oil trading strategy, He Bosheng recommends focusing on bearish trades on rebounds, complemented by bullish trades on pullbacks.
Humans need to breathe, and perfect trading is like breathing—maintaining flexibility without needing to trade every market swing. The secret to profitable trading lies in implementing simple rules: repeating simple tasks consistently and enforcing them strictly over the long term.
Trading Strategy:
sell@61.5-62,0
TP:59.5-60.0
