USOIL next week trend analysis, hope it helps youThe current crude oil price stands at 60.49, a level shaped by multiple factors. On the supply side, news of an OPEC+ planned production increase has exerted significant pressure on the market. Although the specific details of the July production increase have not yet been finalized, expectations of higher output have spread, fueling concerns that a substantial increase in future crude oil supply will depress prices. At the same time, there are new developments in the U.S. shale oil industry: recent resumptions of production by some shale oil companies have led to rising output, further increasing uncertainties on the supply side.
On the demand side, the situation is equally bleak. Slower global economic growth and poor economic data in some countries have resulted in weak growth in industrial demand for crude oil. Moreover, with continuous advancements in new energy technologies, more and more sectors are adopting new energy as a substitute for traditional crude oil. For example, the popularity of electric vehicles has reduced demand for gasoline, thereby impacting overall crude oil demand.
Considering both supply and demand factors, the outlook for crude oil prices next week is pessimistic, and prices may continue to face downward pressure. If OPEC+ confirms a large-scale production increase plan at its upcoming meeting, expectations of higher supply will be further reinforced, and oil prices are likely to fall. However, the crude oil market is highly volatile, and geopolitical factors cannot be ignored. If instability emerges in the Middle East—such as escalated geopolitical conflicts affecting crude oil production and transportation—oil prices could unexpectedly rebound. Based on current information, however, the likelihood of a downward adjustment in crude oil prices next week remains high under the dual pressures of increased supply and weak demand.
USOIL next week trend analysis, hope it helps you
USOIL SELL@61~60.5
SL:62
TP:60~59.5
OIL_CRUDE trade ideas

WTI Support & Resistance LevelsThese zones have been generated using a custom-built software tool, developed and refined over an extended period of time. The tool is the result of dedicated effort and research, aiming to identify high-probability support and resistance areas with precision.

USOIL next week trend analysis, hope it helps youGeopolitical risks have eased: Recent signs of de-escalation in the Middle East have emerged, with the United States submitting a ceasefire proposal to Hamas. Although not immediately accepted, market concerns about conflict escalation have diminished. Progress has also been made in U.S.-Iran nuclear negotiations, with the Iranian Foreign Ministry stating that significant breakthroughs have been achieved. If an agreement is reached in the future, Iran's crude oil exports could increase by 500,000 to 1 million barrels per day, further impacting the global crude oil supply pattern and increasing supply pressures.
Other supply-increasing factors: Oil field production disruptions caused by wildfires in Alberta, Canada, have been partially restored, reducing supply disturbance factors. In addition, U.S. crude oil output has stabilized at around 13.5 million barrels per day, and institutions predict that U.S. crude oil production will increase by approximately 300,000 barrels per day in 2025, with the Permian Basin as the main growth driver, also bringing additional supply to the market.
Accelerated new energy substitution: Global new energy vehicle sales increased by 25% year-on-year in 2025, combined with improvements in fuel efficiency, the elasticity of crude oil demand continues to decline. With the continuous advancement and application of new energy technologies, the substitution effect on traditional crude oil demand has become increasingly evident, which is unfavorable for long-term crude oil price increases.
USOIL next week trend analysis, hope it helps you
USOIL SELL@61~60.5
SL:62
TP:60~59.5

USOIL next week trend analysis, hope it helps youOPEC+ confirmed at its meeting on May 31 that eight oil-producing countries under its mechanism will continue to increase production by 411,000 barrels per day (bpd) in July, maintaining the same pace as in May and June. Although the market had partially priced in this expectation, the continuation of the production increase plan has strengthened the long-term logic of loose supply. It is worth noting that this production increase is not a unified action by the entire alliance but rather the result of core members such as Saudi Arabia and Russia voluntarily exiting production cuts, reflecting cautious attitudes within OPEC+ toward demand prospects. With oil prices currently breaking below the key psychological threshold of $60 per barrel, if the production increase plan continues into the second half of the year, it may further suppress the upside room for oil price rebounds.
USOIL next week trend analysis, hope it helps you
USOIL SELL@61~60.5
SL:62
TP:60~59.5

USOIL: Target Is Down! Short!
Today we will analyse USOIL together☺️
The in-trend continuation seems likely as the current long-term trend appears to be strong, and price is holding below a key level of 60.844 So a bearish continuation seems plausible, targeting the next low. We should enter on confirmation, and place a stop-loss beyond the recent swing level.
❤️Sending you lots of Love and Hugs❤️

USOIL Expected Growth! BUY!
My dear subscribers,
My technical analysis for USOIL is below:
The price is coiling around a solid key level - 60.68
Bias - Bullish
Technical Indicators: Pivot Points Low anticipates a potential price reversal.
Super trend shows a clear buy, giving a perfect indicators' convergence.
Goal - 61.41
My Stop Loss - 60.25
About Used Indicators:
By the very nature of the supertrend indicator, it offers firm support and resistance levels for traders to enter and exit trades. Additionally, it also provides signals for setting stop losses
Disclosure: I am part of Trade Nation's Influencer program and receive a monthly fee for using their TradingView charts in my analysis.
———————————
WISH YOU ALL LUCK

USOIL next week trend analysis, hope it helps youLimited support on the demand side
- Seasonal factors: The U.S. summer travel peak has begun, with gasoline demand increasing by approximately 3% month-on-month, but warm winter conditions have caused heating oil consumption to decline by 5% year-on-year .
- Economic outlook: Expectations for a slowdown in global economic growth have intensified, with the International Monetary Fund (IMF) latest report cutting its 2025 global GDP growth forecast to 2.8%. Downgraded growth expectations for major economies may curb crude oil consumption potential .
- New energy substitution: Global new energy vehicle sales grew by 25% year-on-year in 2025, and combined with improvements in fuel efficiency, the elasticity of crude oil demand continues to decline.
USOIL next week trend analysis, hope it helps you
USOIL SELL@61~60.5
SL:62
TP:60~59.5

Usoil June We are currently at the support zone and waiting for the next daily candlestick close we tell us the emotion of the market.

WTI CRUDE OIL: Repeated rejections on the 1D MA50.WTI Crude Oil is neutral on its 1D technical outlook (RSI = 46.483, MACD = -0.530, ADX = 16.270) as it is trading sideways for the past 2 weeks, unable however to cross above the 1D MA50, which along with the LH trendline, keep the trend bearish. Sell and aim for thr S1 level (TP = 56.00). Emerging Bearish Cross also on the 1D MACD.
## If you like our free content follow our profile to get more daily ideas. ##
## Comments and likes are greatly appreciated. ##

Oil Price Stuck Near $60 Amid Geopolitical TensionsOil Price Stuck Near $60 Amid Geopolitical Tensions
Oil prices remain near $60, driven by global uncertainty. In the Middle East, tensions persist as Israel continues its military actions in Gaza. Meanwhile, the war between Ukraine and Russia continues despite U.S. efforts to mediate. Reports indicate that Russia has used North Korean weapons to intensify missile strikes on Ukrainian infrastructure, raising concerns about Moscow’s reliance on Pyongyang.
Adding to the uncertainty, Trump’s tariff policies are creating instability for major economies. However, OPEC+ has pledged to increase oil production in July, which could push prices lower.
For now, $60 remains a strong support level. If the price breaks below this barrier, further declines could follow, as indicated on the chart.
You may find more details in the chart!
Thank you and Good Luck!
❤️PS: Please support with a like or comment if you find this analysis useful for your trading day❤️

WTI short termFor my opinion long term still is bearish but in short term bullish,now we on strong support zone if we break it down we fall.But i think first we go up area 62+

USOIL SELLERS WILL DOMINATE THE MARKET|SHORT
USOIL SIGNAL
Trade Direction: short
Entry Level: 61.25
Target Level: 56.17
Stop Loss: 64.55
RISK PROFILE
Risk level: medium
Suggested risk: 1%
Timeframe: 1D
Disclosure: I am part of Trade Nation's Influencer program and receive a monthly fee for using their TradingView charts in my analysis.
✅LIKE AND COMMENT MY IDEAS✅

WTI Crude Oil – Bearish Elliott Wave SetupOn the 15-minute chart, I’m tracking a corrective rally in wave (ii) heading toward the 0.618 Fib zone (around 62.2–62.3) before the next major leg lower.
🔻 Bearish target: 52.00
📈 Looking for the final push up before confirming downside continuation.
💬 What are your thoughts on this Elliott Wave count?
For more updates and ideas, check my profile bio!
#WTI #CrudeOil #elliottwave #priceaction #technicalanalysis

CRUDE OIL Local Long! Buy!
Hello,Traders!
USOIL is headed towards
A strong horizontal support
Level of 60.00$ and as the
Level is strong we will be
Expecting a rebound and
A local move up after the
Price retests the support
Buy!
Comment and subscribe to help us grow!
Check out other forecasts below too!
Disclosure: I am part of Trade Nation's Influencer program and receive a monthly fee for using their TradingView charts in my analysis.

USOIL Today's Trading Strategy Hope this helps you
The situation in the Middle East remains highly tense, with the Iran nuclear negotiations stalled and U.S. sanctions against Iran still in place. The two sides have significant differences on key issues such as nuclear facility inspections and conditions for lifting sanctions. Israel's military threats against Iran's nuclear facilities have continued to escalate, repeatedly stating publicly that it does not rule out launching military strikes against Iran. In the event of a conflict, as a major crude oil producer, Iran's crude oil production and exports would be severely disrupted, and oil transportation routes in the Middle East could also be blocked, creating a huge gap in global crude oil supply. At the same time, the geopolitical rivalry between Russia and Western countries in the energy sector has intensified, and geopolitical conflicts could lead Russia to adjust its crude oil export strategy, further exacerbating supply tensions in the global crude oil market and driving oil prices sharply higher.
Although OPEC+ accelerated production increases by 822,000 barrels per day in May-June, the remaining production capacity of major producers such as Saudi Arabia has fallen below 1.5 million barrels per day, making it difficult to effectively fill the supply gap left by Iran. Moreover, the production increase plan will be completed by October 2025, one year ahead of the original schedule, indicating concerns about long-term weak demand, which could instead undermine market confidence in supply flexibility.
USOIL Today's Trading Strategy Hope this helps you
USOIL BUY@60.5~61
SL:59.5
TP:62~62.5

USOIL REBOUND AHEAD|LONG|
✅CRUDE OIL is set to retest a
Strong support level below at 60.20$
After trading in a local downtrend from some time
Which makes a bullish rebound a likely scenario
With the target being a local resistance above at 61.43$
LONG🚀
✅Like and subscribe to never miss a new idea!✅
Disclosure: I am part of Trade Nation's Influencer program and receive a monthly fee for using their TradingView charts in my analysis.

USOIL - Bullish Double BottomHello Traders !
The USOIL price formed a double bottom pattern.
Currently, The neckline is broken !
So, I expect a bullish move🚀
_______________
TARGET: 63.49🎯

USOIL:First go short, then go long
USOIL: There are still signs of a pullback on an hourly basis after oil prices climbed to near 63 after OPEC+ said there would be no immediate changes to current production policies.
So the trading strategy :SELL@62.5-62.8 TP@61.6-61.3
After stepping back to the point can not break a wave of rebound, the target can look at 63 again
↓↓↓ More detailed strategies and trading will be notified here →→→
↓↓↓ Keep updated, come to "get" →→→

USOIL:Long thinking, target 62.5
USOIL: Same idea, the front 61.3-61.5 has been given to the entry point, it is slowly rising, the upper target is still seen near 62.5.
So strategically, stay long and wait for the rally, TP@62.5
Tip: It is always right to sell when there is a profit, according to individual risk appetite.
↓↓↓ More detailed strategies and trading will be notified here →→→
↓↓↓ Keep updated, come to "get" Or just find me→→→

Potential bullish rise?WTI Oil (XTI/USD) has bounced off the pivot and could rise the 1st resistance which is a pullback resistance.
Pivot: 61.68
1st Support: 60.72
1st Resistance: 63.49
Risk Warning:
Trading Forex and CFDs carries a high level of risk to your capital and you should only trade with money you can afford to lose. Trading Forex and CFDs may not be suitable for all investors, so please ensure that you fully understand the risks involved and seek independent advice if necessary.
Disclaimer:
The above opinions given constitute general market commentary, and do not constitute the opinion or advice of IC Markets or any form of personal or investment advice.
Any opinions, news, research, analyses, prices, other information, or links to third-party sites contained on this website are provided on an "as-is" basis, are intended only to be informative, is not an advice nor a recommendation, nor research, or a record of our trading prices, or an offer of, or solicitation for a transaction in any financial instrument and thus should not be treated as such. The information provided does not involve any specific investment objectives, financial situation and needs of any specific person who may receive it. Please be aware, that past performance is not a reliable indicator of future performance and/or results. Past Performance or Forward-looking scenarios based upon the reasonable beliefs of the third-party provider are not a guarantee of future performance. Actual results may differ materially from those anticipated in forward-looking or past performance statements. IC Markets makes no representation or warranty and assumes no liability as to the accuracy or completeness of the information provided, nor any loss arising from any investment based on a recommendation, forecast or any information supplied by any third-party.

Crude oil rebounds after encountering 60 support
📊Technical aspects
Due to concerns that global supply growth may exceed demand growth, WTI prices fell slightly and rebounded slightly after hitting the 60 mark.
From the daily chart level, the medium-term trend moving average system suppresses the rebound of oil prices, and the medium-term objective trend direction is downward. After the oil price hit the low of 55.20, the frequent alternation of long and short formed, and the embryonic form of the falling flag relay appeared from the shape. Pay attention to the strength of the oil price testing the upper edge of the flag. It is expected that after the medium-term trend fluctuates, it will still rise to the 64 position.
The short-term (1H) trend of crude oil fell and touched the key support of 60, then rose slightly. The moving average system turned to divergent upward arrangement, and the short-term objective trend direction was upward. The MACD indicator fast and slow lines crossed the zero axis, and the bullish momentum was sufficient. It is expected that the trend of crude oil will continue to rise during the day, and the probability of breaking through the 63 resistance and moving upward is relatively high.
💰 Strategy Package
Long Position: 60.5-61.5

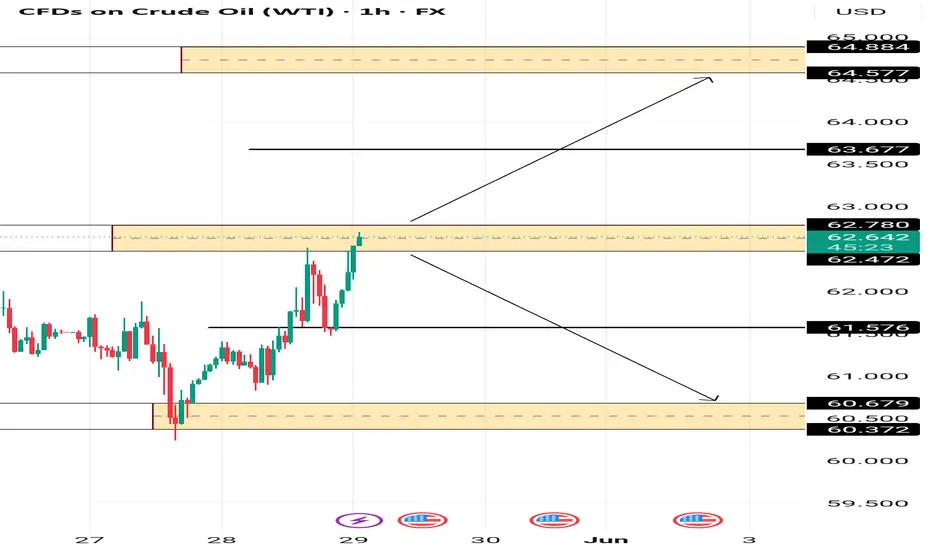
US CRUDE OIL PIVOT AREAUS OIL has formed a good base of support after the decent decline in the previous weeks.
The break of our intraday pivot area could keep the Bullish bias with targets of 63.67 and 64.57 in the near sight.
However failure to break above could bring prices down to 61.57 and 60.67
USOIL Today's Trading Strategy Hope this helps you
### Factors Influencing Long Positions in Crude Oil
#### Seasonal Demand Growth
Summer typically sees a surge in crude oil demand as increased travel and industrial activities drive up consumption. For example, gasoline demand in the U.S. rises significantly during summer due to higher public travel, providing support for crude oil prices and creating opportunities for long positions.
#### Geopolitical Factors
Conflicts, political instability, or sanctions in major oil-producing regions can disrupt or reduce crude oil supply, pushing prices higher. Although Middle Eastern tensions have eased recently, news of a potential Israeli attack on Iranian nuclear facilities previously caused oil prices to jump 3%. Escalating geopolitical tensions would favor long positions in crude oil.
#### Inventory Levels
A decline in crude oil inventories signals tighter supply, which may drive price increases. When inventory data falls below expectations, market concerns about supply shortages intensify, pushing prices higher and creating opportunities for long positions.
USOIL Today's Trading Strategy Hope this helps you
USOIL BUY@60.5~61
SL:59.5
TP:62~62.5
