USOil Dips Amid Global Demand WorriesXTI/USD is currently exhibiting bearish technical signals, with key indicators pointing towards potential further declines. However, the presence of oversold conditions suggests that a short-term rebound could occur if prices find support at current levels. Traders should monitor the $60.13 support and $61.38 resistance levels closely, as breaks of these levels could signal the next directional move.
XTI/USD is experiencing a noticeable downward shift in market sentiment. After a period of relative stability, prices have started to decline, influenced primarily by concerns over global demand and shifting geopolitical conditions. Despite earlier support from tensions in Eastern Europe and U.S. sanctions on Russian energy exports, the market now appears to be reacting more to economic headwinds, such as signs of slowing industrial growth in major economies like China and the Eurozone. Traders are closely watching whether current support levels will hold or if the recent downward momentum will lead to a deeper correction. Overall, the sentiment leans cautious, with traders waiting for clearer signals from both supply-side developments and macroeconomic indicators.
Pivot Points:
Support Levels: S1 at $60.13, S2 at $59.69, S3 at $58.88.
Resistance Levels: R1 at $61.38, R2 at $62.19, R3 at $62.63.
Bearish Outlook
Trigger: A break below the $60.13 support level.
Targets: $59.69 followed by $58.88
Invalidation: A decisive move above the $61.38 resistance level.
Bullish Outlook
Trigger: A sustained break above the $61.38 resistance level.
Targets: $62.19 followed by $62.63
Invalidation: A drop below the $60.13 support level.
Note
Please risk management in trading is a Key so use your money accordingly. If you like the idea then please like and boost. Thank you and Good Luck!
OIL_CRUDE trade ideas

OIL: A Bearish Setup And Geopolitical UncertaintyOIL: A Bearish Setup And Geopolitical Uncertainty
Today Oil is showing a clear bearish pattern development but it comes with a high risk from a fundamental perspective.
Technical analysis:
The price faced a strong resistance near 64 - 64.80 from where it moved down several times. The Chart is showing in a clear way the possibility of a bearish movement with targets 60.2 ; 58 and 56.
It's possible that OIl may follow this way down if we don't take the news in consideration.
Fundamental Analysis:
Yesterday OIL declined toward $61 as traders anticipate positive developments on teh next round between US-Irand Nuclear negotiations.
Earlier yesterday their lider said that the deal with the U.S was impossible.
On the other hand, On Tuesday, the US obtained new intelligence suggesting that Israel is making preparations to strike Iranian nuclear facilities, even as US President Donald Trump has been pursuing a diplomatic deal with Tehran. It isn’t clear that Israeli leaders have made a final decision to carry out the strikes, CNN said, citing unnamed officials.
So all of this is not a clear situation and if something happens OIL may rise aggressively up again. But this is all related to the news now.
You may find more details in the chart!
Thank you and Good Luck!
❤️PS: Please support with a like or comment if you find this analysis useful for your trading day❤️

USOIL Today's Trading Strategy:Recently, there have been many developments in the crude oil market that affect the price trend. From the supply side, the Organization of the Petroleum Exporting Countries and its allies (OPEC+) have been committed to production cuts to stabilize oil prices. Some member countries have even taken unexpected production - cutting actions, which has reduced the crude oil supply to a certain extent. Major oil - producing countries such as Saudi Arabia have cut their own crude oil production, sending a strong signal to the market to control the supply.
Meanwhile, the global crude oil demand has not declined significantly. With the gradual recovery of the global economy, industrial production activities in many countries have increased, and the demand for crude oil has also increased. In particular, some emerging economies have a relatively high - speed economic growth and a high degree of dependence on crude oil. Their growing demand strongly supports the crude oil price.
USOIL Today's Trading Strategy:
USOIL BUY@61~60.5
SL:60
TP:62.5~63

Will Middle East Tensions Ignite a Global Oil Crisis?The global oil market faces significant turbulence amidst reports of potential Israeli military action against Iran's nuclear facilities. This looming threat has triggered a notable surge in oil prices, reflecting deep market anxieties. The primary concern stems from the potential for severe disruption to Iran's oil output, a critical component of global supply. More critically, an escalation risks Iranian retaliation, including a possible blockade of the Strait of Hormuz, a vital maritime chokepoint through which a substantial portion of the world's oil transits. Such an event would precipitate an unprecedented supply shock, echoing historical price spikes seen during past Middle Eastern crises.
Iran currently produces around 3.2 million barrels per day and holds strategic importance beyond its direct volume. Its oil exports, primarily to China, serve as an economic lifeline, making any disruption profoundly impactful. A full-scale conflict would unleash a cascade of economic consequences: extreme oil price surges would fuel global inflation, potentially pushing economies into recession. While some spare capacity exists, a prolonged disruption or a Hormuz blockade would render it insufficient. Oil-importing nations, particularly vulnerable developing economies, would face severe economic strain, while major oil exporters, including Saudi Arabia, the US, and Russia, would see substantial financial gains.
Beyond economics, a conflict would fundamentally destabilize the geopolitical landscape of the Middle East, unraveling diplomatic efforts and exacerbating regional tensions. Geostrategically, the focus would intensify on safeguarding critical maritime routes, highlighting the inherent vulnerabilities of global energy supply chains. Macroeconomically, central banks would confront the difficult task of managing inflation without stifling growth, leading to a surge in safe-haven assets. The current climate underscores the profound fragility of global energy markets, where geopolitical developments in a volatile region can have immediate and far-reaching global repercussions.

WTI Crude: Bears Target 60.549 USDHey traders and investors!
🔹 Crude Oil — 1D / 4H
📍 Context
Daily (1D): clear short trend; price capped below 65.40 USD.
4-Hour (4H): sideways range — its boundaries are marked by black lines on the chart — with seller initiative in control.
Higher-time-frame levels reinforce the bearish bias.
🔎 Analysis
Sellers keep the upper hand on 4H. The daily shows no strong buyer bars, sustaining downward pressure. If price retests the IKC zone and prints bearish confirmation (high-volume seller bar or buyer absorption), the odds of breaking 60.549 USD increase.
🎯 Trade Idea
Setup: hunt for short patterns inside the IKC range.
Target: 60.549 USD (range low).
Confirmation: pattern on M15–H1 + seller-side volume.
📌 Takeaway
Bears remain in control. Wait for a trigger inside the IKC zone and lower-TF confirmation before joining the move toward 60.549 USD.
This analysis is based on the Initiative Analysis concept (IA).
Wishing you profitable trades!

USCRUDEOIL - Potential SellHi Traders,
Here is my view on CMCMARKETS:USCRUDEOIL
BIAS: SELL
Logical Analysis:
From April 2020 to March 2022, oil experienced strong buyer demand, pushing price aggressively from the $7 level up to around $120.
At that point, sellers stepped in, and a temporary agreement between buyers and sellers was established around the $120 zone — a fair value at the time.
Since March 2022, price has been declining — entering a discount phase.
However, the move has not been sharp or aggressive, suggesting sellers are not in a rush.
Importantly, no significant buyer interest has been observed during this entire discounted phase.
🛒 Interpretation:
The “store” (market) offered oil at a huge premium until buyers stopped stepping in at high prices. Since then, the price has been marked down gradually, waiting for a new batch of interested buyers — who haven’t shown up yet but be aware.
Technical Analysis: see chart
Good Luck

USCRUDEOIL - Potential Buy (Day Trading) & Sell (Swing Trading)Hi Traders,
We are BUYING CMCMARKETS:USCRUDEOIL
🧠 Price Action Analysis:
USOIL has recently shown strong bullish momentum, bouncing off key support levels and forming higher lows.
Today, price is holding above a critical zone, suggesting continued interest from buyers. If this support holds and momentum builds, we could see a move toward recent highs.
Good Luck

WTI : UPTREND PATTERNYo. Good ? Me too.
1- W Bottom need to break 64.50 for confirmation.
2- H&S pattern inverted is the plan.
3- Target is all pattern is correct : 86 dollars.
4- Weekly show a very good signal
5- Good luck

USOIL | Bullish | Double Bottom USOIL has printed a double bottom with bullish divergence.It indicates that it is going to make new higher highs and start a bullish rally.

Will crude oil prices continue to rise?On Wednesday, international crude oil prices surged to nearly a one-month high amid market concerns over supply disruptions in the Middle East. News that Israel may strike Iranian nuclear facilities has ignited a risk premium for crude oil, while stalled progress in U.S.-Iran nuclear negotiations has also tightened supply expectations. The latest data from the Fujairah Oil Industrial Zone in the UAE showed that as of the week ending May 19, total refined product inventories at the Port of Fujairah stood at 20.562 million barrels, a 4.9% decline from the previous week. Light distillate inventories fell by 357,000 barrels to 8.277 million barrels, medium distillate inventories dropped by 467,000 barrels to 1.295 million barrels, and heavy residual fuel oil inventories rose by 1.651 million barrels to 10.99 million barrels.
Crude oil experienced a pullback today, with prices oscillating lower after the opening, showing minor fluctuations. Notably, prices gradually broke to new lows, suggesting a high probability of a rapid decline. Overall, crude oil has been in a stalemate between rally and correction recently, showing a pattern of daytime declines and night-time gains, but this may shift today. In trading, consider going long on rebounds as the primary strategy and shorting at highs as a secondary approach. Monitor resistance at the $63.0-$64.0 per barrel level and support at the $61.0-$60.0 per barrel level.
Trading Strategy:
buy@60.0-61.0
TP:63.0-64.0
In the market, there are no absolutes, and neither upward nor downward trends are set in stone. Therefore, the ability to judge the balance between market gains and losses is your key to success. Let money become our loyal servant.

USOIL Today's Trading StrategyThe current crude oil price is $62.5 per barrel. Recently, the crude oil price has witnessed a certain degree of decline, mainly affected by factors such as the unexpected production increase of OPEC+ and the suppression of demand by US tariffs. Since April, the international crude oil market has seen a sharp decline. First, Trump announced the launch of the "reciprocal tariff" policy, which has intensified market concerns about the global economic growth outlook and will once again lead to a decline in crude oil prices.
USOIL Today's Trading Strategy:
USOIL SELL@63.5-64
SL:65
TP:61~60

Oil bearish trend resumesI believe that we have been in a slow oscillating move to the high of $64.50. Which is a previous resistance area. The flash news of Israel planning on attacking Iran nuclear facilities caused a rally on the daily open. The markets viewed that this appears to be very unlikely to occur.
Price then hit the daily resistance area and started to fall since reaching these highs.
Today the build on oil inventories appears to have sealed oils fate and the downward pressure has continued.

WTI Oil H4 | Overlap support at 38.2% Fibonacci retracementWTI oil (USOIL) is falling towards an overlap support and could potentially bounce off this level to climb higher.
Buy entry is at 60.44 which is an overlap support that aligns with the 38.2% Fibonacci retracement.
Stop loss is at 57.60 which is a level that lies underneath a swing-low support and the 61.8% Fibonacci retracement.
Take profit is at 63.68 which is a multi-swing-high resistance.
High Risk Investment Warning
Trading Forex/CFDs on margin carries a high level of risk and may not be suitable for all investors. Leverage can work against you.
Stratos Markets Limited (tradu.com/uk):
CFDs are complex instruments and come with a high risk of losing money rapidly due to leverage. 63% of retail investor accounts lose money when trading CFDs with this provider. You should consider whether you understand how CFDs work and whether you can afford to take the high risk of losing your money.
Stratos Europe Ltd (tradu.com/eu):
CFDs are complex instruments and come with a high risk of losing money rapidly due to leverage. 63% of retail investor accounts lose money when trading CFDs with this provider. You should consider whether you understand how CFDs work and whether you can afford to take the high risk of losing your money.
Stratos Global LLC (tradu.com/en):
Losses can exceed deposits.
Please be advised that the information presented on TradingView is provided to Tradu (‘Company’, ‘we’) by a third-party provider (‘TFA Global Pte Ltd’). Please be reminded that you are solely responsible for the trading decisions on your account. There is a very high degree of risk involved in trading. Any information and/or content is intended entirely for research, educational and informational purposes only and does not constitute investment or consultation advice or investment strategy. The information is not tailored to the investment needs of any specific person and therefore does not involve a consideration of any of the investment objectives, financial situation or needs of any viewer that may receive it. Kindly also note that past performance is not a reliable indicator of future results. Actual results may differ materially from those anticipated in forward-looking or past performance statements. We assume no liability as to the accuracy or completeness of any of the information and/or content provided herein and the Company cannot be held responsible for any omission, mistake nor for any loss or damage including without limitation to any loss of profit which may arise from reliance on any information supplied by TFA Global Pte Ltd.
The speaker(s) is neither an employee, agent nor representative of Tradu and is therefore acting independently. The opinions given are their own, constitute general market commentary, and do not constitute the opinion or advice of Tradu or any form of personal or investment advice. Tradu neither endorses nor guarantees offerings of third-party speakers, nor is Tradu responsible for the content, veracity or opinions of third-party speakers, presenters or participants.

WTI Crude Oil awaits inventoriesPrice Movement: WTI Crude trades around $62.70 per barrel, marking a fourth straight session of gains.
Main Bullish Driver: Geopolitical tensions — reports suggest Israel may strike Iran’s nuclear sites, sparking fears of supply disruption from Iran (OPEC’s 3rd largest producer).
Risk of Iran retaliating by blocking the Strait of Hormuz, which could disrupt exports from Saudi Arabia, Kuwait, Iraq, and UAE.
Limiting Factor: Rising U.S. crude supply
API data shows a 2.49 million barrel build in U.S. crude stocks, defying expectations of a draw.
Traders await confirmation from EIA stockpile data later today.
Conclusion:
Bullish momentum is currently driven by Middle East tension, but gains may be capped if U.S. inventory builds continue. Traders should watch for EIA data release and further geopolitical developments.
This communication is for informational purposes only and should not be viewed as any form of recommendation as to a particular course of action or as investment advice. It is not intended as an offer or solicitation for the purchase or sale of any financial instrument or as an official confirmation of any transaction. Opinions, estimates and assumptions expressed herein are made as of the date of this communication and are subject to change without notice. This communication has been prepared based upon information, including market prices, data and other information, believed to be reliable; however, Trade Nation does not warrant its completeness or accuracy. All market prices and market data contained in or attached to this communication are indicative and subject to change without notice.

Crude Oil (WTI/USD) Short SetupInternational oil prices have been supported by the temporary easing of trade tensions and buying sentiment attracted by a double bottom. However, the upside for oil prices remains limited, mainly due to the impact of Trump's uncertain tariff policies on the economy and the OPEC+ strategy of maintaining production increases. In the forward view, attention should be paid to the progress of the Iran Nuclear Agreement and Russia-Ukraine negotiations. If the agreements are reached, pressure on the oil supply side will continue to increase. During the summer oil consumption peak season, the incremental oil demand in major consuming countries may be affected by factors such as the bleak prospects of economic recovery and the substitution of new energy, keeping oil prices under pressure. On the daily chart, crude oil closed with a small bullish candle, with the high price breaking above the previous high and the low price not breaking below the previous low, forming an breakout pattern. Crude oil has shown upward momentum after consecutive oscillations, and key attention should be paid to whether the resistance level at 63.6 is broken.
Trading Strategy:
sell@62.5-63.0
TP:61.0-61.5
In the market, there are no absolutes, and neither upward nor downward trends are set in stone. Therefore, the ability to judge the balance between market gains and losses is your key to success. Let money become our loyal servant.

Crude oil: 63.00 resistance & 60.00 support keyPrices are currently testing the upper resistance at $63.00 📈. These levels are suppressing the price 🔻. A decisive breakthrough above this level may trigger a more intense upward rally 🔥. Meanwhile, recent selling pressure has pushed the price down to $60.60 📉. Watch the pivot support at $60.00, the real downward target 🎯
Crude oil surplus expanded in April, and imports increased, reaching multi - month highs from some countries 🌍. If global benchmark oil prices rise in the future, purchases may be reduced 📉.
Crude oil fell first and then rose today 📊. After a deep dive to $60.9, it stabilized and started to rise 🔼. After the previous price increase and adjustment, it remains to be seen if the upward momentum will continue and break through upwards 🔍.
Overall, on the delivery day, oil prices are volatile 🔼🔽. Watch the resistance at $63.0 on the upside and the support at $60.60 - $60.0 on the downside 👀.
⚡️⚡️⚡️ USOil ⚡️⚡️⚡️
🚀 Sell@ 62.50 - 62.30
🚀 TP 61.50 - 60.60
Accurate signals are updated every day 📈 If you encounter any problems during trading, these signals can serve as your reliable guide 🧭 Feel free to refer to them! I sincerely hope they'll be of great help to you 🌟 👇

WTI OIL 1H Channel Up make or break Targets.WTI Oil (USOIL) has been trading within a Channel Up on the 1H time-frame that is supported by the 1H MA200 (orange trend-line). As long as this holds, we expect another +2.50% Bullish Leg (at least), which gives a Target of $63.55.
If the price breaks below the 1H MA200 though, we will take this small loss on the long and go short instead, targeting Support 1 at $60.60.
-------------------------------------------------------------------------------
** Please LIKE 👍, FOLLOW ✅, SHARE 🙌 and COMMENT ✍ if you enjoy this idea! Also share your ideas and charts in the comments section below! This is best way to keep it relevant, support us, keep the content here free and allow the idea to reach as many people as possible. **
-------------------------------------------------------------------------------
Disclosure: I am part of Trade Nation's Influencer program and receive a monthly fee for using their TradingView charts in my analysis.
💸💸💸💸💸💸
👇 👇 👇 👇 👇 👇

Crude Oil (WTI/USD) Short Setup🔻 Crude Oil (WTI/USD) Short Setup – Trend Exhaustion with Bearish Risk/Reward Play
Crude oil has shown weakness after failing to reclaim the $62.50–63.00 resistance zone. Price is now consolidating near the breakdown level, and early signs of bearish continuation are forming. SQZMOM histogram is flattening near zero, hinting at loss of bullish momentum. This setup offers a high-probability short with favorable downside extension.
📉 Entry: 61.97
🎯 Target: 57.83
🛑 Stop Loss: 63.87
📊 Risk/Reward Ratio: 2.18
📆 Expected Duration: ~5 days
📌 Technical Highlights:
Bearish Retest: Price is stalling at previous broken support turned resistance.
Trend Weakness: Lower highs forming after recent top at 63.87.
SQZMOM Indicator: Momentum stalling below zero, signaling a potential shift back to bearish pressure.
Support Gap: Clean range down to $58 with thin volume structure below $60.
💬 A break below 60.12 confirms momentum shift. A close above 62.50 invalidates the short.

Bullish momentum to extend?WTI Oil (XTI/USD) has bounced off the pivot and could rise to the 1st resistance, which lines up with the 61.8% Fibonacci projection.
Pivot: 60.08
1st Support: 57.68
1st Resistance: 64.63
Risk Warning:
Trading Forex and CFDs carries a high level of risk to your capital and you should only trade with money you can afford to lose. Trading Forex and CFDs may not be suitable for all investors, so please ensure that you fully understand the risks involved and seek independent advice if necessary.
Disclaimer:
The above opinions given constitute general market commentary, and do not constitute the opinion or advice of IC Markets or any form of personal or investment advice.
Any opinions, news, research, analyses, prices, other information, or links to third-party sites contained on this website are provided on an "as-is" basis, are intended only to be informative, is not an advice nor a recommendation, nor research, or a record of our trading prices, or an offer of, or solicitation for a transaction in any financial instrument and thus should not be treated as such. The information provided does not involve any specific investment objectives, financial situation and needs of any specific person who may receive it. Please be aware, that past performance is not a reliable indicator of future performance and/or results. Past Performance or Forward-looking scenarios based upon the reasonable beliefs of the third-party provider are not a guarantee of future performance. Actual results may differ materially from those anticipated in forward-looking or past performance statements. IC Markets makes no representation or warranty and assumes no liability as to the accuracy or completeness of the information provided, nor any loss arising from any investment based on a recommendation, forecast or any information supplied by any third-party.


USOILUSOIL (WTI Crude) Fundamentals – May 2025
1. Supply and Demand Dynamics
Global Oil Demand:
The International Energy Agency (IEA) projects global oil demand growth will slow from 990,000 barrels per day (bpd) in Q1 to around 650,000 bpd for the rest of 2025, reflecting economic headwinds and record-high efficiency gains.
The IEA’s latest report (May 2025) estimates total demand will rise by 741,000 bpd in 2025, reaching 103.9 million bpd, with emerging markets (China, India, Africa, Latin America, Middle East) driving most of the growth.
OECD demand is expected to decline, while non-OECD demand remains geographically diversified.
Global Oil Supply:
Global crude oil and liquids supply is forecast to average 104.4 million bpd in 2025, up 1.8 million bpd (+1.7%) from 2024.
Non-OPEC+ countries (U.S., Brazil, Guyana, Canada) are expected to contribute most of the supply growth, potentially resulting in a supply surplus.
OPEC+ extended its 3.7 million bpd supply cuts to the end of 2026, but voluntary cuts will be gradually phased out starting April 2025.
Supply-Demand Balance:
The EIA expects a supply surplus in 2025 as non-OPEC+ supply growth outpaces demand increases, especially with OPEC+ phasing out some cuts.
2. Inventory and Refinery Data
U.S. Inventories:
U.S. commercial crude oil inventories fell by 2.7 million barrels at the end of April, now about 6% below the five-year seasonal average.
Gasoline and distillate inventories remain below average, suggesting tightness in refined product markets.
U.S. refineries are operating at 88.6% capacity, with robust input and flat-to-lower gasoline production.
3. Geopolitical and Macro Factors
Trade Policy and Geopolitics:
Recent easing of U.S.-China trade tensions and progress in U.S.-Iran nuclear talks have improved risk sentiment and supported oil prices.
Hopes for a Russia-Ukraine ceasefire and de-escalation in the Middle East have reduced risk premiums, but the market remains sensitive to any setback in negotiations.
OPEC+ Compliance:
OPEC+ compliance with production cuts was high (112%) in March 2025, tightening supply and helping prices rebound from recent lows.
4. Price Trends and Outlook
Current Prices:
WTI crude is trading around $62.80–$63.50, rebounding from recent lows but still well below early 2025 peaks.
Price volatility remains high (Brent’s 30-day realized volatility peaked at 35%), reflecting sensitivity to geopolitical headlines and inventory data.
Forecasts:
J.P. Morgan maintains a Brent forecast of $66/bbl for 2025, with expectations for prices to remain under pressure due to supply surplus, but potential for mid-$70s if trade optimism and OPEC+ discipline persist.
Futures markets price WTI at an average of $75/bbl for 2025, though this is above current spot prices.
Summary Table
Factor Current Status/Impact (May 2025)
Global Demand Growth Slowing, driven by emerging markets
Global Supply Rising, led by non-OPEC+ (US, Brazil, Guyana)
OPEC+ Policy Extended cuts, gradual phase-out
US Inventories Below 5-year average, supporting prices
Geopolitical Risk Lower, but market remains headline-sensitive
WTI Price Range $62.80–$63.50 (recent), futures avg $75/bbl
Volatility High, driven by macro and geopolitical uncertainty
Conclusion
USOIL fundamentals for May 2025 reflect a market balancing slower demand growth, robust non-OPEC+ supply, and cautious optimism on geopolitics. Ongoing OPEC+ discipline and below-average inventories provide some support, but the risk of a supply surplus and persistent volatility keep prices capped. Watch for trade policy shifts, OPEC+ compliance, and inventory trends as key catalysts for the month.

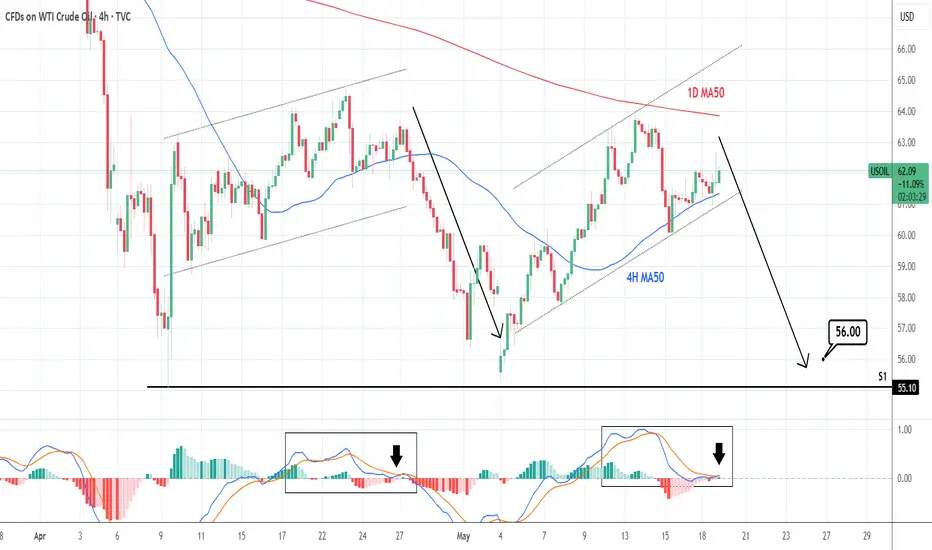
WTI CRUDE OIL: Mirror pattern calls for a sell.WTI Crude Oil is neutral on its 1D technical outlook (RSI = 50.222, MACD = -0.370, ADX = 25.154) as the price is just under the 1D MA50, where it got rejected last Tuesday. In the meantime, it has the support of the 4H MA50, hence stuck inside a neutral range. This pattern is however identical to April, after which the price declined aggressively to the S1 level. Sell, TP = 56.00.
See how our prior idea has worked out:
## If you like our free content follow our profile to get more daily ideas. ##
## Comments and likes are greatly appreciated. ##
The main strategy is to go long on pullbacksDuring the Asian trading session on Monday, Brent crude fell slightly by $0.05 to $65.15 per barrel; WTI crude was quoted at $61.76, while the more actively traded July contract dropped $0.04 to $61.93. Both benchmark oil prices recorded weekly gains of over 1% last week, mainly boosted by the easing of global trade sentiment. The market will closely monitor data to be released soon by a major Asian economy, including April industrial added value, fixed asset investment, and retail sales. ANZ Bank noted in a report that weak data from the major Asian economy could undermine the optimism brought by the tariff suspension, thereby pressing down oil prices.👉👉👉
The K-line closed as a yang line with a long lower shadow, indicating strong bullish momentum from buyers. The moving average system is gradually arranging in a bullish formation, relying on the oil price, and the short-term objective trend direction has turned upward. It is expected that the intraday crude oil trend will continue to rise, reaching near 63. Overall, in terms of crude oil trading strategies, it is recommended to focus on buying low on pullbacks and supplement with selling high on rebounds. In the short term, pay attention to the resistance at the 63.0-63.5 level above, and the support at the 61.0-60.5 level below.
Oil trading strategy:
buy @ 61.00-61.50
sl 60.00
tp 62.30-62.80
If you think the analysis helpful, you can give a thumbs-up to show your support. If you have different opinions, you can leave your thoughts in the comments. Thank you for reading!👉👉👉
