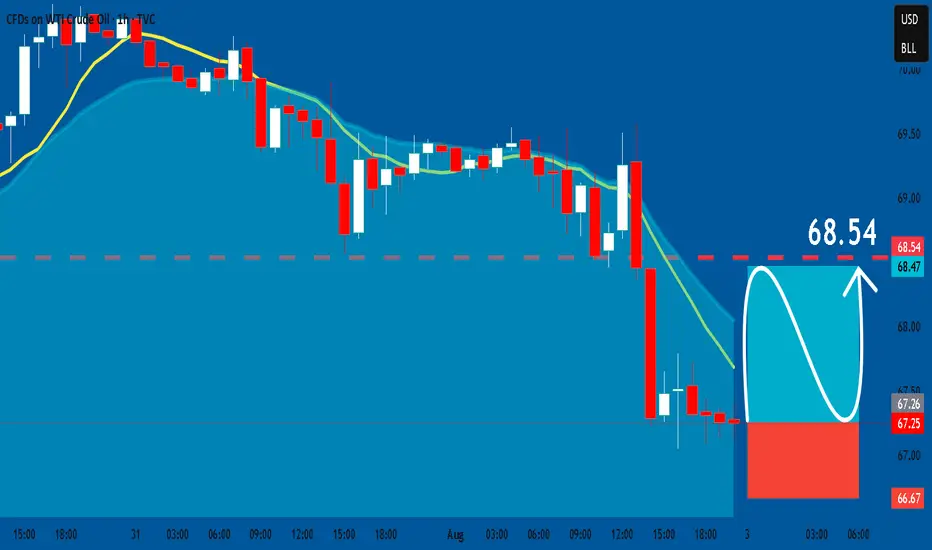
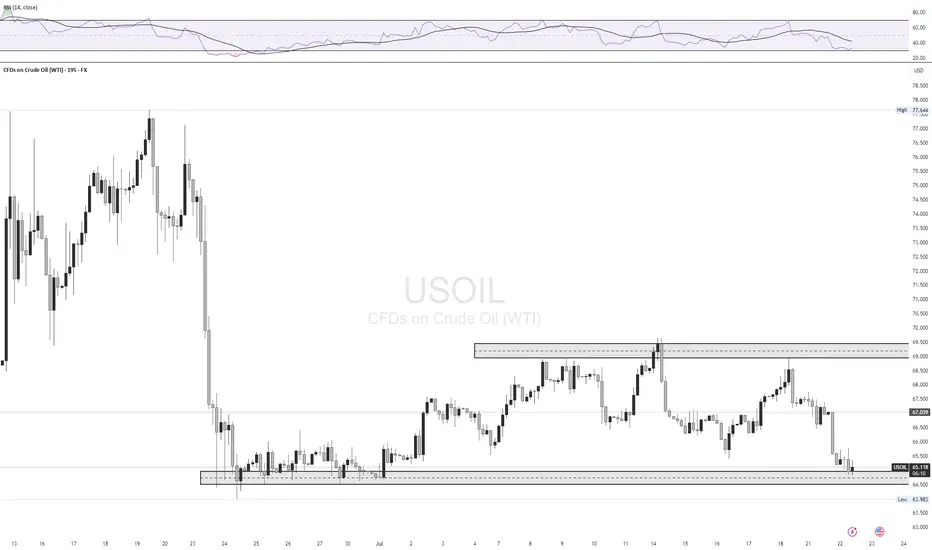
USOIL: Long Trade with Entry/SL/TP
USOIL
- Classic bullish pattern
- Our team expects retracement
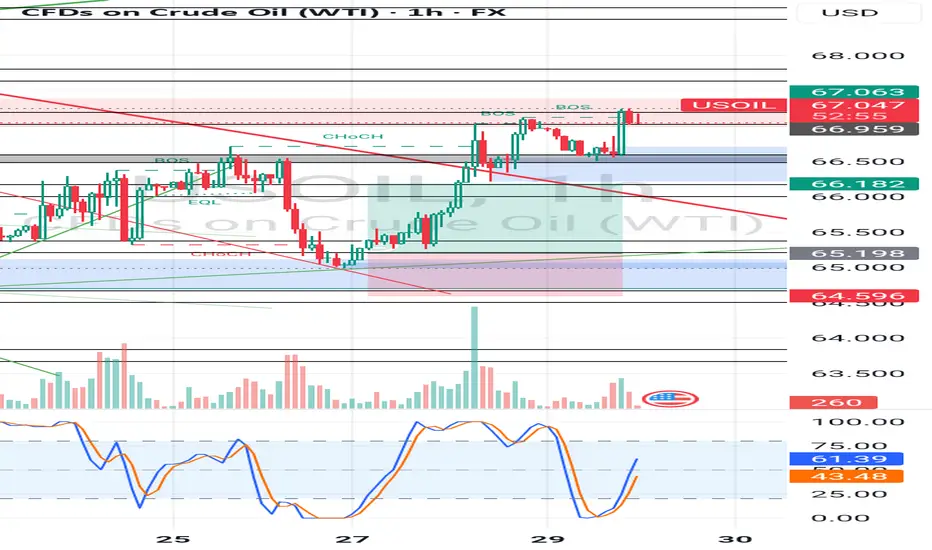
SUGGESTED TRADE:
Swing Trade
Buy USOIL
Entry - 67.25
Stop - 66.67
Take - 68.53
Our Risk - 1%
Start protection of your profits from lower levels
Disclosure: I am part of Trade Nation's Influencer program and receive a monthly fee for using their TradingView charts in my analysis.
❤️ Please, support our work with like & comment! ❤️
OIL_CRUDE trade ideas

WTIWTI crude oil (West Texas Intermediate) is one of the main global benchmarks for oil pricing, alongside Brent crude. It is a light, sweet crude oil primarily produced in the United States and traded on the New York Mercantile Exchange (NYMEX). WTI is known for its high quality and low sulfur content, making it ideal for refining into gasoline and other fuels. Crude oil prices are influenced by a wide range of factors including global supply and demand dynamics, geopolitical tensions, OPEC+ decisions, US shale production, and macroeconomic trends such as inflation and economic growth.
Over the past two decades, crude oil has experienced significant volatility. Prices surged to over $140 per barrel in 2008, collapsed during the global financial crisis, and again plummeted during the COVID-19 pandemic in 2020, when demand collapsed and prices briefly turned negative for the first time in history. The years following saw a sharp rebound as the global economy reopened and supply constraints persisted. However, rising interest rates, concerns about slowing global growth, and increasing energy transitions toward renewables have put downward pressure on oil demand in recent years.
As of August 2025, WTI crude oil is trading at $66.59 per barrel, reflecting a relatively weak energy market compared to its highs in 2022. The current price suggests concerns over slowing global industrial demand, increased US oil production, and ongoing geopolitical negotiations that have stabilized some of the previous supply shocks. While energy markets remain sensitive to global conflicts, economic shifts, and OPEC+ policy decisions, WTI at this level represents a market balancing between moderate demand and ample supply. It remains a critical asset for energy traders and a key indicator of global economic health.

Oil (WTI) – Upcoming Buy OpportunityBased on the analysis I conducted using fractals, oil is expected to move upward and provide buyers with a 2% gain, equivalent to 140 pips.

USOIL BULLS ARE STRONG HERE|LONG
USOIL SIGNAL
Trade Direction: short
Entry Level: 67.26
Target Level: 68.46
Stop Loss: 66.46
RISK PROFILE
Risk level: medium
Suggested risk: 1%
Timeframe: 1h
Disclosure: I am part of Trade Nation's Influencer program and receive a monthly fee for using their TradingView charts in my analysis.
✅LIKE AND COMMENT MY IDEAS✅

Activation of the head and shoulders pattern?Oil has formed a clean head and shoulders pattern, which, if activated, could lead the price to drop to 67.125. However, if the pattern fails and turns out to be a fakeout, we can expect the price to rise toward the \$71 area.
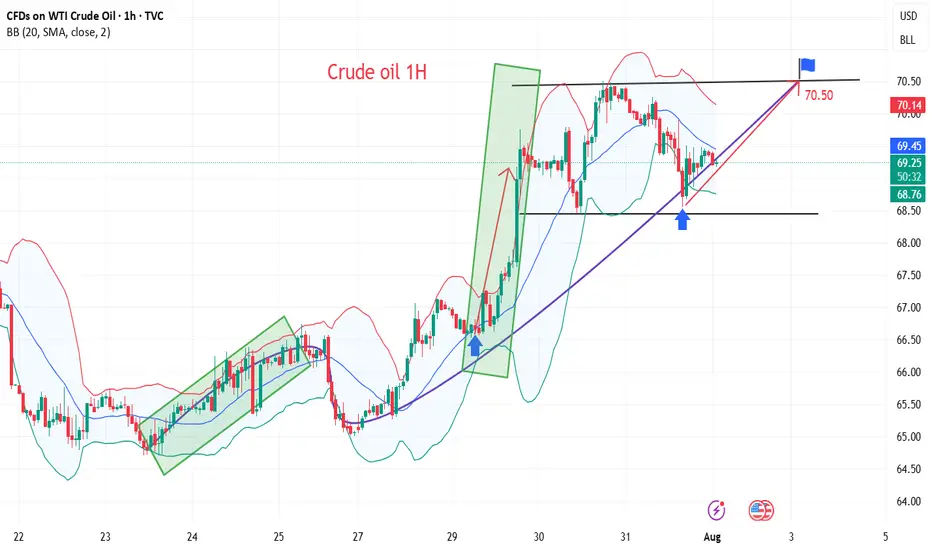
Oil prices rebound, maintain bullish attitude
💡Message Strategy
International oil prices continued their upward trend on Thursday, closing higher for the fourth consecutive day, as concerns about growing global supply tightness abounded. Brent crude for September delivery rose 0.4% to $73.51 a barrel, while West Texas Intermediate (WTI) crude for September delivery rose 0.5% to $70.37 a barrel, while the more active Brent October contract rose 0.4% to $72.76 a barrel.
Recently, the market has focused on the statement of US President Trump, who demanded that Russia make "substantial progress" on the situation in Ukraine within 10-12 days, otherwise he would impose 100% secondary tariffs on its trading partners, significantly bringing forward the previous 50-day deadline.
Inventory data suggests a continued struggle between supply and demand. Data from the U.S. Energy Information Administration (EIA) showed that U.S. crude oil inventories unexpectedly rose by 7.7 million barrels to 426.7 million barrels in the week ending July 25, far exceeding expectations for a 1.3 million barrel drop. However, gasoline inventories fell by 2.7 million barrels to 228.4 million barrels, exceeding market expectations for a 600,000 barrel drop.
📊Technical aspects
From a daily perspective, WTI crude oil prices have closed higher for four consecutive days since rebounding from the $66 level. It is currently running stably above the integer mark of $70 per barrel. The short-term moving average system is in a bullish arrangement, and the MACD indicator remains above the zero axis, indicating that the bullish momentum is still strong.
From an hourly perspective, if the price breaks through the previous high of $70.50, it is expected to further rise to the $73.50-$75 range. Conversely, if it continues to fall below the $70 mark, it may trigger short-term profit-taking, and further support will focus on the $68.50 level. Overall, the short-term trend remains bullish.
💰Strategy Package
Long Position:68.00-68.50,SL:67.50,Target:70.50-73.00
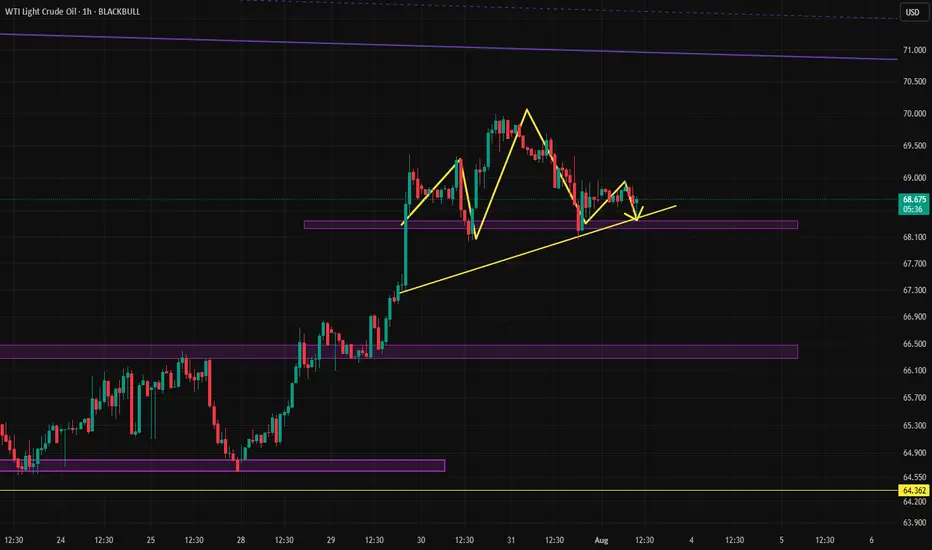
USOIL GROWTH AHEAD|
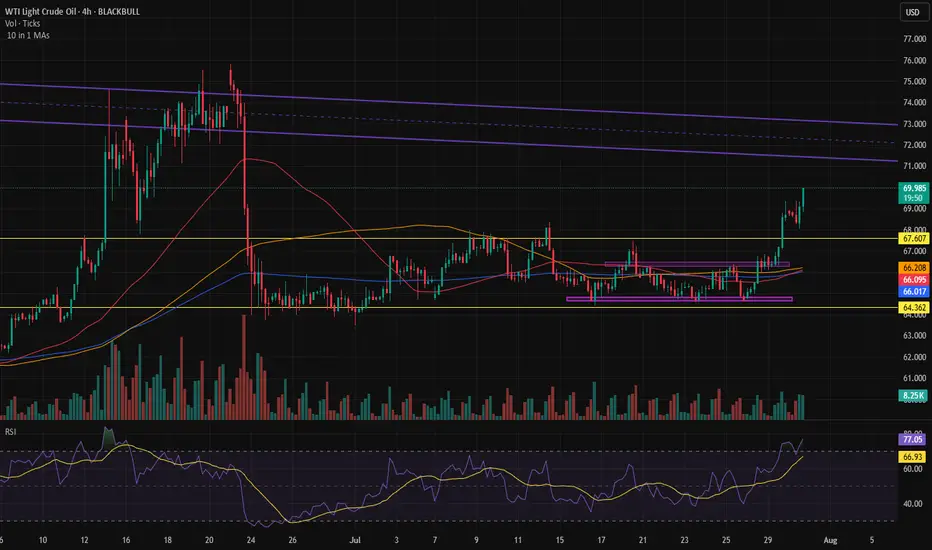
✅CRUDE OIL broke the key
Structure level of 69.50$
While trading in an local uptrend
Which makes me bullish biased
And I think that after the retest of the broken level is complete
A rebound and bullish continuation will follow
LONG🚀
✅Like and subscribe to never miss a new idea!✅
Disclosure: I am part of Trade Nation's Influencer program and receive a monthly fee for using their TradingView charts in my analysis.

Is there any news in the Middle East?Rapid move in oil.
We need to see if something significant is about to happen in the Middle East — it usually is when we see moves like this.
WTI is up on my radarPrice closed above daily GM, travelled, and now retraced back to the GM..
For now, I'll be BULLISH biased and look for Buy setup on the lower time frames..
Price took out the Asian high, then gave a bearish coh triggering the backside (bearish) move of the Buy set up..
Note that the backside move is more of the manipulative move.
Price has now taken out the Asian low and come into the daily PRZ..this is an early sign that the backside move is likely coming to an end..
We wait to a see bullish coh for more confirmation, then look for complete buy set up to pull the trigger.

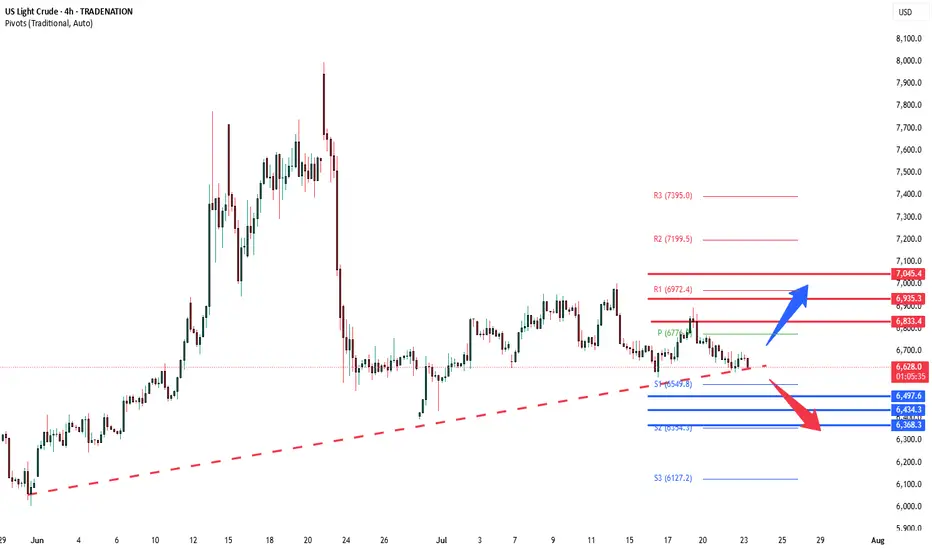
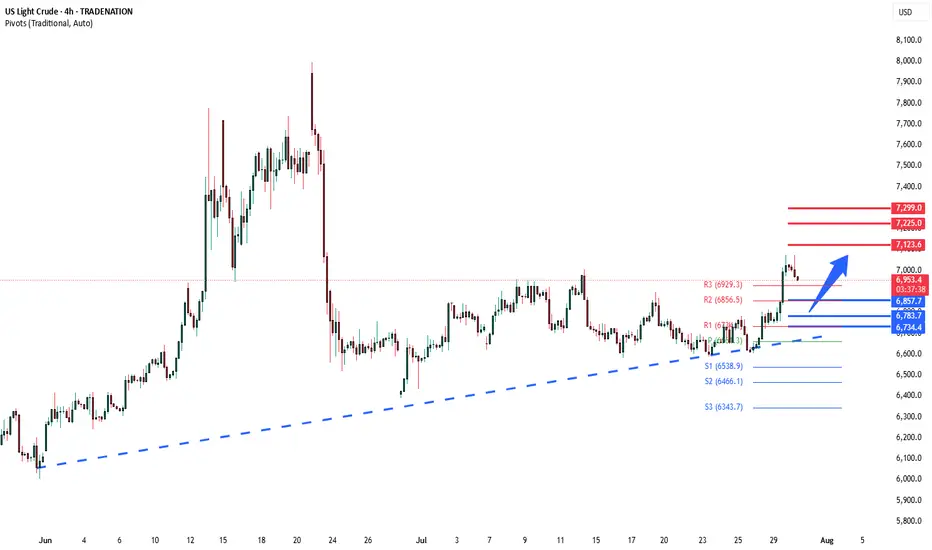
WTI uptrend pause support at 6857The WTI Crude remains in a bullish trend, with recent price action showing signs of a corrective pullback within the broader uptrend.
Support Zone: 6857 – a key level from previous consolidation. Price is currently testing or approaching this level.
A bullish rebound from 6857 would confirm ongoing upside momentum, with potential targets at:
7123 – initial resistance
7225 – psychological and structural level
7299 – extended resistance on the longer-term chart
Bearish Scenario:
A confirmed break and daily close below 6857 would weaken the bullish outlook and suggest deeper downside risk toward:
6783 – minor support
6735 – stronger support and potential demand zone
Outlook:
Bullish bias remains intact while the WTI Crude holds above 6734. A sustained break below this level could shift momentum to the downside in the short term.
This communication is for informational purposes only and should not be viewed as any form of recommendation as to a particular course of action or as investment advice. It is not intended as an offer or solicitation for the purchase or sale of any financial instrument or as an official confirmation of any transaction. Opinions, estimates and assumptions expressed herein are made as of the date of this communication and are subject to change without notice. This communication has been prepared based upon information, including market prices, data and other information, believed to be reliable; however, Trade Nation does not warrant its completeness or accuracy. All market prices and market data contained in or attached to this communication are indicative and subject to change without notice.
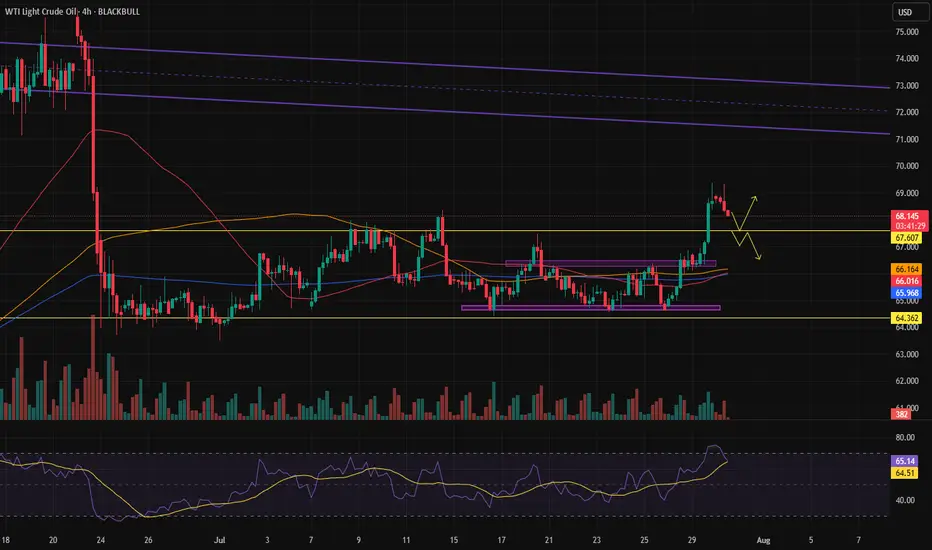
Back to boring range or a pullback and trend continuation?I hope it doesn't return to that boring range and instead makes a pullback and moves upward.
Although the price of oil depends on thousands of fundamental reasons.
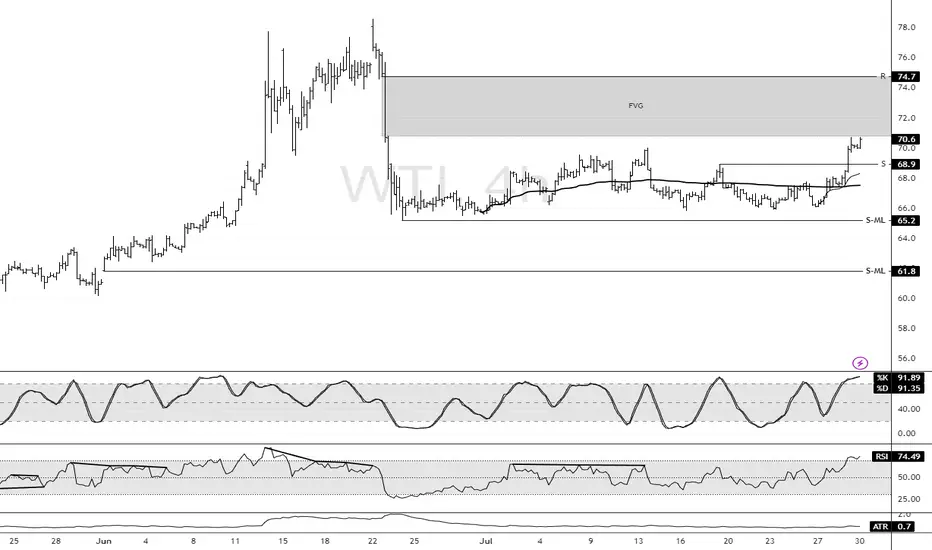
WTI Crude Eyes Bullish Momentum Above $68.9FenzoFx—WTI Crude Oil broke resistance at $68.9 in the last session, now trading near $70.6. This breakout supports a bullish shift.
Yet, RSI 14 and Stochastic indicate overbought conditions, suggesting possible consolidation. Support at $68.9 could offer a discounted entry if prices retreat.
Watch for bullish signs like candlestick formations and inverted FVG around the $68.9 support.
US OIL LONG SETUPPrice had created a good Demand Zone , Also Price is in an overall uptrend and pullback to the demand order block from which I took the entry, expected a minor retractment to pick my entry.
But it is what it is. Good Trade overall.
Potential Next setup Coming 🔥
_THE_KLASSIC_TRADER_.

Oil Steady as Sanction Threat LoomsOil prices held steady near recent highs after Trump threatened Russia with economic penalties if it doesn’t reach a ceasefire with Ukraine within 10–12 days. Traders are watching closely, as potential secondary sanctions on Russia could disrupt crude supply. However, skepticism remains over whether Trump will follow through, given his push for lower oil prices. The threat comes amid ongoing EU sanctions and ahead of key US trade deadlines and an OPEC+ meeting. Despite current tightness and summer demand, concerns of oversupply remain for later in the year.
On the technical side, the price of crude oil is still trading in a sideways range between $64 and $68. The moving averages are confirming a bullish trend in the market, while the Stochastic oscillator is at neutral levels, hinting that the short-term outlook for pricing could go either way. The Bollinger bands have contracted quite excessively, meaning that volatility is low; therefore, it could take some time for any significant moves. Currently, the price is testing the resistance of the 50-day simple moving average, while the first area of technical resistance lies around the $68 level, which is the upper boundary of the current sideways channel.

OILUSD Range Between 60–64.26 – Will Support Hold or Break?WTI Crude has been in a sideways range after the sharp drop in early April. Price recently tested resistance at 64.260 but failed to break higher, pulling back into the 60.000 support zone. This level has held multiple times, forming a key pivot.
Support at: 60.000 🔽, 55.931 🔽
Resistance at: 64.260 🔼, 67.000 🔼, 71.101 🔼
🔎 Bias:
🔼 Bullish: A strong rejection from the 60.000 zone followed by a breakout above 64.260.
🔽 Bearish: A daily/12H close below 60.000 opens the path to retest 55.931, and potentially lower.
📛 Disclaimer: This is not financial advice. Trade at your own risk.

USOIL--SHORT
--unabled to move up, price will move down
--three horizantal line: starting from top, entry,TP1,TP2

USOIL-LONG--severel times attemted to break the green channel's bottom side and failed
--price seems to go higher and push the upper side of green channel
-

Crude Oil Short Setup
Entry: 66.40
SL: 67.20
TP: 64.85
Risk to Reward: 1.93
Bias: Bearish
I expect mid-term downside pressure on crude oil prices, mainly due to the following reasons:
The U.S. is mitigating the impact of energy tariffs by increasing domestic supply.
Pressure on OPEC to boost production is rising.
Global demand growth remains uncertain.
These factors may keep energy prices capped in the medium term and support bearish scenarios.

SELL PLAN – XTIUSD (15M)📉 SELL PLAN – XTIUSD (15M)
🗓️ Date: 23 July 2025
⏱️ Timeframe: 15-Minute
🔍 Context & Reasoning:
HTF Supply Zone (Red Zone)
Price entered the red HTF zone (noted as “4H T2,3,4”) and showed rejection.
This zone aligns with potential 4H Fair Value Gaps / Supply.
Sweep & Rejection
Liquidity sweep above previous highs followed by immediate bearish reaction.
Entry Confirmation
Bearish engulfing candle formed inside the HTF zone.
Price closed below 15M EMA (blue line) showing bearish momentum.
Dealing Range Valid
DR formed after rejection of the HTF zone.
Short-term bullish FVG created and violated.
Bearish FVG confirms continuation.
🎯 Entry Details:
Entry Price: ~66.12
Stop Loss: ~66.58 (Above HTF rejection zone)
Take Profit: ~65.12 (Near Weekly TP level)
🧠 Confluences:
Rejection from 4H Supply
Price closed below EMA
Clear swing failure / liquidity grab
DR confirmation on 15M
Multiple FVGs and breaker structure supporting the move
📌 Risk Management:
Risk-to-Reward: 1:2+
Risk per trade: Max 1%
If in drawdown: Use 0.5%

WTI crude consolidation ahead of US Inventory figuresWest Texas Intermediate (WTI) crude futures hovered near $66.30 during Wednesday’s European session, trading in a narrow range as investors awaited the latest US EIA crude inventory report. Market expectations point to a 1.4 million barrel drawdown, which would signal stronger demand and potentially support prices.
However, crude failed to rally despite confirmation of a US-Japan bilateral trade agreement, announced by President Trump via Truth Social. While the deal is seen as a positive for global trade sentiment, broader oil demand concerns persist—especially if US-EU trade negotiations stall, which could dampen growth in major consuming regions.
Conclusion:
Oil markets remain in consolidation mode, with near-term direction likely hinging on EIA inventory results. A larger-than-expected draw could offer upside momentum, but macro-level trade uncertainties continue to cap gains.
Key Support and Resistance Levels
Resistance Level 1: 6830
Resistance Level 2: 6940
Resistance Level 3: 7045
Support Level 1: 6500
Support Level 2: 6435
Support Level 3: 6370
This communication is for informational purposes only and should not be viewed as any form of recommendation as to a particular course of action or as investment advice. It is not intended as an offer or solicitation for the purchase or sale of any financial instrument or as an official confirmation of any transaction. Opinions, estimates and assumptions expressed herein are made as of the date of this communication and are subject to change without notice. This communication has been prepared based upon information, including market prices, data and other information, believed to be reliable; however, Trade Nation does not warrant its completeness or accuracy. All market prices and market data contained in or attached to this communication are indicative and subject to change without notice.