OKB (OKB) - June 8Hello?
Welcome, traders.
By "following", you can always get new information quickly.
Please also click "Like".
Have a good day.
-------------------------------------
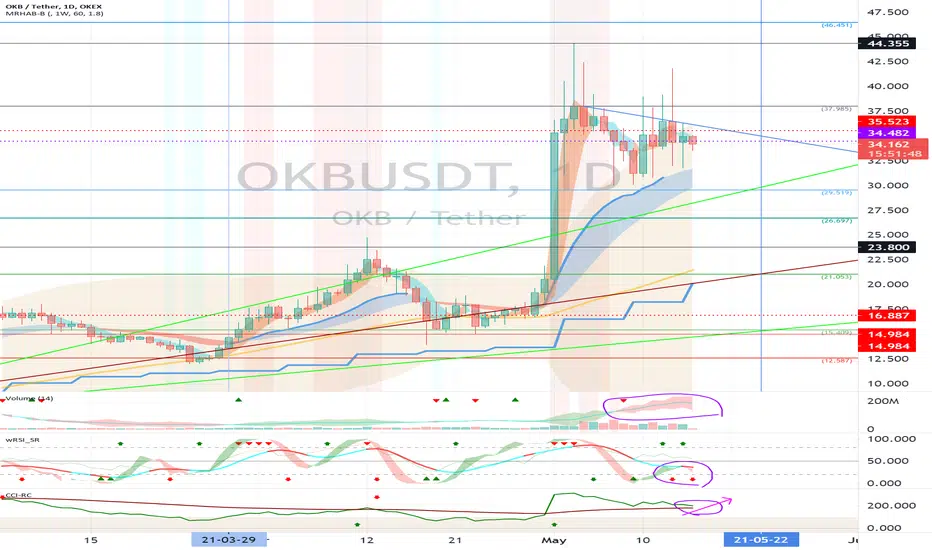
(OKBUSDT 1W chart)
If it moves sideways in the 14.984-23.800 section, it is expected to lead to an uptrend.
However, if the 14.984 point falls, the 14.984-23.800 section acts as a resistance section and may take time to rise, so it is important to find support at the 14.984 point.
(1D chart)
It remains to be seen if the 12.587-15.409 section can find support and move up.
If it goes down from the 12.587 point, it could touch the 4.121 point, so you need to be careful with your trades.
If it moves above the 16.887 point and finds support, we expect the uptrend to continue.
However, in order to accelerate the upward trend, it must rise above the 26.697-29.519 section.
-------------------------------------
(OKBBTC 1W chart)
If the price holds above the 0.0004448 point, it is expected to maintain an uptrend.
(1D chart)
We need to see if we can move up along the uptrend line.
If it finds support by moving towards the 0.0004953-0.0005390 section, I expect the uptrend to accelerate.
If it falls from the 0.0004079 point, Stop Loss is required to preserve profit and loss.
------------------------------------------
We recommend that you trade with your average unit price.
This is because, if the price is below your average unit price, whether it is in an uptrend or in a downtrend, there is a high possibility that you will not be able to get a big profit due to psychological burden.
The center of all trading starts with the average unit price at which you start trading.
If you ignore this, you may be trading in the wrong direction.
Therefore, it is important to find a way to lower the average unit price and adjust the proportion of the investment, ultimately allowing the funds corresponding to the profits to regenerate themselves.
------------------------------------------------------------ -----------------------------------------------------
** All indicators are lagging indicators.
Therefore, it is important to be aware that the indicator moves accordingly with the movement of price and volume.
However, for the sake of convenience, we are talking in reverse for the interpretation of the indicator.
** The wRSI_SR indicator is an indicator created by adding settings and options to the existing Stochastic RSI indicator.
Therefore, the interpretation is the same as the traditional Stochastic RSI indicator. (K, D line -> R, S line)
** The OBV indicator was re-created by applying a formula to the DepthHouse Trading indicator, an indicator disclosed by oh92. (Thanks for this.)
** See support, resistance, and abbreviation points.
** Support or resistance is based on the closing price of the 1D chart.
** All descriptions are for reference only and do not guarantee a profit or loss in investment.
Explanation of abbreviations displayed in the chart
R: A point or section of resistance that requires a response to preserve profits.
S-L: Stop Loss point or section
S: A point or section where you can buy to make a profit as a support point or section.
(Short-term Stop Loss can be said to be a point where profit and loss can be preserved or additional entry can be made through split trading. It is a short-term investment perspective.)
GAP refers to the difference in prices that occurred when the stock market, CME, and BAKKT exchanges were closed because they are not traded 24 hours a day.
G1 : Closing price when closed
G2: Opening price
(Example) Gap (G1-G2)
OKBUSDT trade ideas

OKEx - yet unrealized perspectiveOKEX:OKBUSDT
The indicative price for the coming year, according to our estimates, is USD 51, which is 251% upside from the current value.
OKB is a traditional utility token with a deflationary pricing model. The exchange team has endeavoured to ensure it the maximum possible use, both internally and by external projects and applications. Given that a part of tokens is withdrawn from circulation every three months, the outlook for price growth looks rather optimistic. When compared to tokens of its closest competitor in terms of a number of users and trading volume, OKB is significantly undervalued. It had more value losses than other tokens at the end of the last crypto market decline. The reason for this may have been the fact that a large share of business comes from the Chinese market, whose tight regulation was the main reason for the price drop. However, the exchange has long experience in conflict resolution with the authorities and has developed successfully despite the restrictions that have been in place since day one.
Among the risk factors that could affect the token price are the overall market dynamics (if the decline continues, it may take considerably longer to recover) and the possibility of increased regulatory pressure from the authorities.

OKBUSDT - Bullish Opportunities !Welcome to our Trade Setups - June 02th ( OKBUSDT ) !
BUY OKBUSDT
ENTRY LEVEL @ 17.649
SL @ 8.513
TP @ 35.927
Max Risk: 1% - 3%!
Risk/Reward Ratio: 2
Leave us a comment or like to keep our content for free and alive.
Have a great week everyone!


OKB (OKB) - May 24Hello?
Dear traders, nice to meet you.
By "following" you can always get new information quickly.
Please also click "Like".
Have a good day.
-------------------------------------
(OKBUSDT 1W chart)
(1D chart)
We need to see if we can move sideways in the 4.121-12.587 section.
In particular, we have to see if we can get support and climb at the 8.483 point.
In order to turn to an uptrend, it must rise at least 21.053 points to gain support.
-------------------------------------
(OKBBTC 1W chart)
(1D chart)
We have to see if we can cross the 3204 Satoshi-4079 Satoshi section.
In particular, it remains to be seen if it can rise along the uptrend line.
If it falls, we need to make sure we get support in the 2767 Satoshi-3204 Satoshi section.
In order to turn to an uptrend, it must rise above the 4953 Satoshi point and gain support.
--------------------------------------
It is advisable to trade at your average unit price.
This is because if the price flows below your average unit price, which was on an uptrend or downtrend, there is a high possibility that you will not be able to earn a large profit due to the psychological burden.
The center of every trade starts with the average unit price you start trading.
If you ignore this, you may be trading in the wrong direction.
Therefore, it is important to find a way to lower the average unit price and adjust the proportion of the investment, so that the money that ultimately corresponds to the profit can regenerate the profit.
-------------------------------------------------- -------------------------------------------
** All indicators are lagging indicators.
So, it's important to be aware that the indicator moves accordingly with the movement of price and volume.
Just for the sake of convenience, we are talking upside down for interpretation of the indicators.
** The wRSI_SR indicator is an indicator created by adding settings and options from the existing Stochastic RSI indicator.
Therefore, the interpretation is the same as the conventional stochastic RSI indicator. (K, D line -> R, S line)
** The OBV indicator was re-created by applying a formula to the DepthHouse Trading indicator, an indicator that oh92 disclosed. (Thank you for this.)
** Check support, resistance and abbreviation points.
** Support or resistance is based on the closing price of the 1D chart.
** All explanations are for reference only and do not guarantee profit or loss on investment.
Explanation of abbreviations displayed on the chart
R: A point or section of resistance that requires a response to preserve profits
S-L: Stop Loss point or section
S: A point or segment that can be bought for profit generation as a support point or segment
(Short-term Stop Loss can be said to be a point where profits and losses can be preserved or additionally entered through installment transactions. It is a short-term investment perspective.)
GAP refers to the difference in prices that occurred when the stock market, CME, and BAKKT exchanges were closed because they do not trade 24 hours a day.
G1: Closing price when closed
G2: Cigar at the time of opening
(Example) Gap (G1-G2)

OKB (OKB) - May 15Hello?
Dear traders, nice to meet you.
By "following" you can always get new information quickly.
Please also click "Like".
Have a good day.
-------------------------------------
(OKBUSDT 1W chart)
(1D chart)
We need to see if we can get support from 34.178-35.523 and get off the downtrend line.
If it falls between 26.697-29.519, a short stop loss is required.
On the CCI-RC indicator, we need to see if the CCI line can touch the EMA line and rise.
If the CCI line and EMA line intersect, volatility may occur, so careful trading is required.
The next volatility period is around May 22nd.
-------------------------------------
(OKBBTC 1W chart)
(1D chart)
We need to see if we can get support at the 6702 Satoshi spot and climb along the uptrend line.
If you fall at the 5390 Satoshi point, you need a short stop loss.
--------------------------------------
It is advisable to trade at your average unit price.
This is because if the price flows below your average unit price, which was on an uptrend or downtrend, there is a high possibility that you will not be able to earn a large profit due to the psychological burden.
The center of every trade starts with the average unit price you start trading.
If you ignore this, you may be trading in the wrong direction.
Therefore, it is important to find a way to lower the average unit price and adjust the proportion of the investment, so that the money that ultimately corresponds to the profit can regenerate the profit.
-------------------------------------------------- -------------------------------------------
** All indicators are lagging indicators.
So, it's important to be aware that the indicator moves accordingly with the movement of price and volume.
Just for the sake of convenience, we are talking upside down for interpretation of the indicators.
** The wRSI_SR indicator is an indicator created by adding settings and options from the existing Stochastic RSI indicator.
Therefore, the interpretation is the same as the conventional stochastic RSI indicator. (K, D line -> R, S line)
** The OBV indicator was re-created by applying a formula to the DepthHouse Trading indicator, an indicator that oh92 disclosed. (Thank you for this.)
** Check support, resistance, and abbreviation points.
** Support or resistance is based on the closing price of the 1D chart.
** All explanations are for reference only and do not guarantee profit or loss on investment.
Explanation of abbreviations displayed on the chart
R: A point or section of resistance that requires a response to preserve profits
S-L: Stop Loss point or section
S: A point or segment that can be bought for profit generation as a support point or segment
(Short-term Stop Loss can be said to be a point where profits and losses can be preserved or additionally entered through installment transactions. It is a short-term investment perspective.)
GAP refers to the difference in prices that occurred when the stock market, CME, and BAKKT exchanges were closed because they do not trade 24 hours a day.
G1: Closing price when closed
G2: Cigar at the time of opening
(Example) Gap (G1-G2)

OKBUSDT - EW analysis - 5th wave extensionOKBUSDT - It is in 5th wave extension of one larger degree and expected to continue uptrend until it finishes the sequence. Currently is in 3rd of 3rd of 5th wave. So pump every three wave pull back as sideways correction for at least new high as minimum target zone.
Give a thumbs up if you really like the Elliott wave analysis.


OKBUSDT - EW analysis - 5th wave up OKBUSDT - It is in 3rd of 5th wave up and progressing for higher level, stay bullish until it reaches above 25-30 zone as 5th wave as impulse in 4 hr time frame.
Give a thumbs up if you really like the Elliott wave analysis.

OKBUSDT - EW analysis - 5th wave upOKBUSDT - It seems 4th wave completed and 5th wave just started move higher. Need impulse up as confirmation in 5 min time frame to confirm the count. If it will confirmed then it will be huge trade for Bull count with stop level below last low around 13.10 for target baove 24.
Give thumbs up if you really like the trade idea/analysis.


OKB (OKB) - December 20Good morning?
Dear traders, nice to meet you.
"Like" is a huge force for me.
By "following" you can always get new information quickly.
Thank you for always supporting me.
-------------------------------------------------- -----
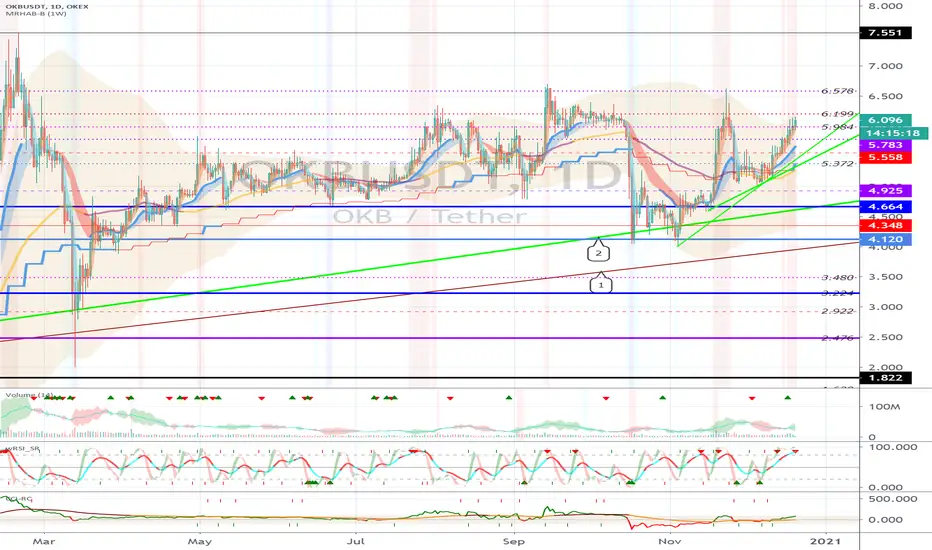
We have to see if we can rise above the 6.199 point for support.
It remains to be seen if the rise to renew the New High can begin in line with the rising BTC price.
If it falls at 5.984, it is a short-term Stop Loss.
If it falls at the 5.372 point, a Stop Loss is needed to preserve profit and loss.
-------------------------------------------------- -------------------------------------------
** All indicators are lagging indicators.
So, it's important to know that the indicator moves accordingly with the movement of price and volume.
Just for convenience, we are talking upside down for interpretation of the indicators.
** Check support, resistance, and abbreviation points.
** Support or resistance is based on the closing price of the 1D chart.
** All explanations are for reference only and do not guarantee profit or loss on investment.
Explanation of abbreviations displayed on the chart
R: A point or section of resistance that requires a response to preserve profits
S-L: Stop-Loss point or section
S: A point or segment that can be bought for profit generation as a support point or segment
(Short-term Stop Loss can be said to be a point where profits and losses can be preserved or additionally entered through installment trading. You should trade from a short-term investment perspective.)
OKBUSDT Found HARMONIC Pattern OKBUSDT
- 🔎 Found HARMONIC Pattern 🔍 -
=======================
🔘 Navarro200
🔘 TOTAL
=======================
👦🏻-Harmonic Trader-👦🏻

