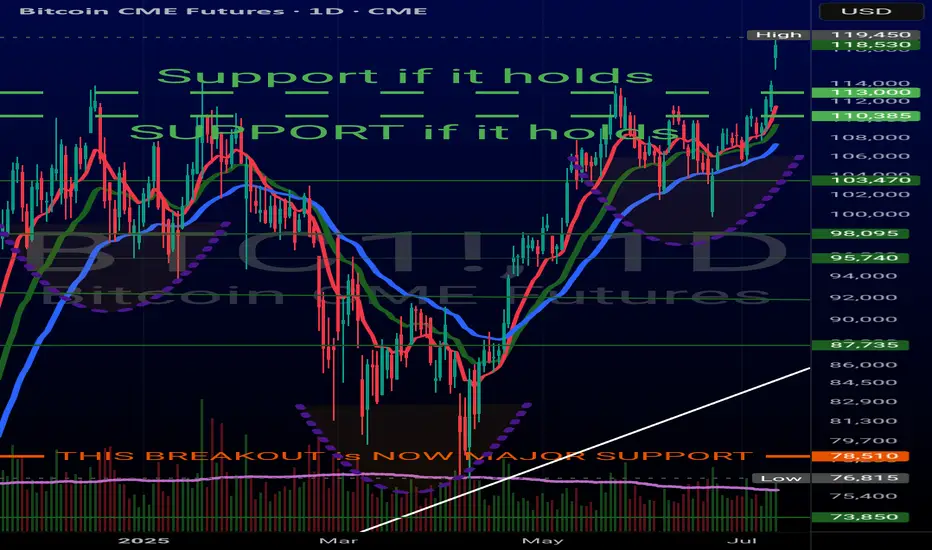
Bitcoin UpdateBitcoin has just broken out above its recent consolidation pattern, staying firmly in an uptrend and finding solid short-term support at its 55-day moving average.
We're now pushing toward the previous high at 112,345, chipping away at that level. Once cleared, our eyes turn to the weekly chart, whi
Related futures

Bitcoin Breakout: Charting the Next TargetsWe’re taking another look at #Bitcoin, which has surged higher and broken above its long-term channel — a move that’s caught the attention of many market watchers.
🔍 Key technical insights:
✅ The recent consolidation appears to be a midway pause in the uptrend. By measuring the preceding flagpole an

ETH: Buying in the DipCME: Micro Ether Futures ( CME:MET1! ), #microfutures
On May 22nd, #Bitcoin reached a new all-time high of $111,814. The king of cryptos rallied as bullish sentiment built up behind the most pro-crypto U.S. administration. As of last Friday, bitcoin realized a one-year return of +90.8%. For compari

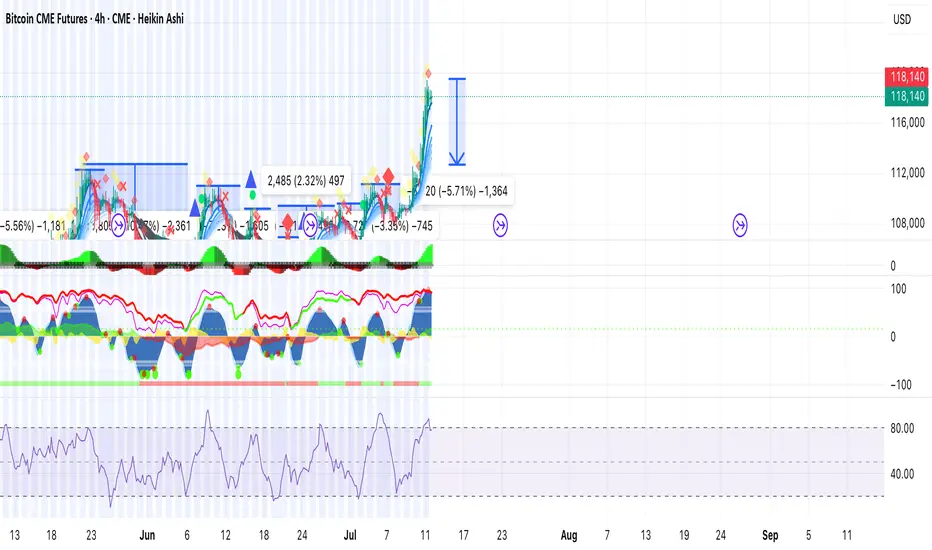
5% correct is needed BTCI believe follow the past we can see on 4h chart usually BTC always correct at least a 4%/6% and in a bigger case it correct 10%.
So now the price is in discovery mode we go some selling at 118k I guess a 5% drop from here is needed.
Beautiful Bitcoin breakout, as called. PLEASE SEE PROFILE FOR MORE INFO!
What an absolutely gorgeous Inverse Head & Shoulder for #Bitcoin.
Had suspicion this time WAS different for #BTC.
Let's talk ROUGH ESTIMATES for social #gold.
CRYPTOCAP:BTC is no longer a hard to anticipate as it's become an institutional asset. Follow the $
Previous trade working nicelyTaking 80% profit here as topping out - leave the rest to run and move stop to BE.
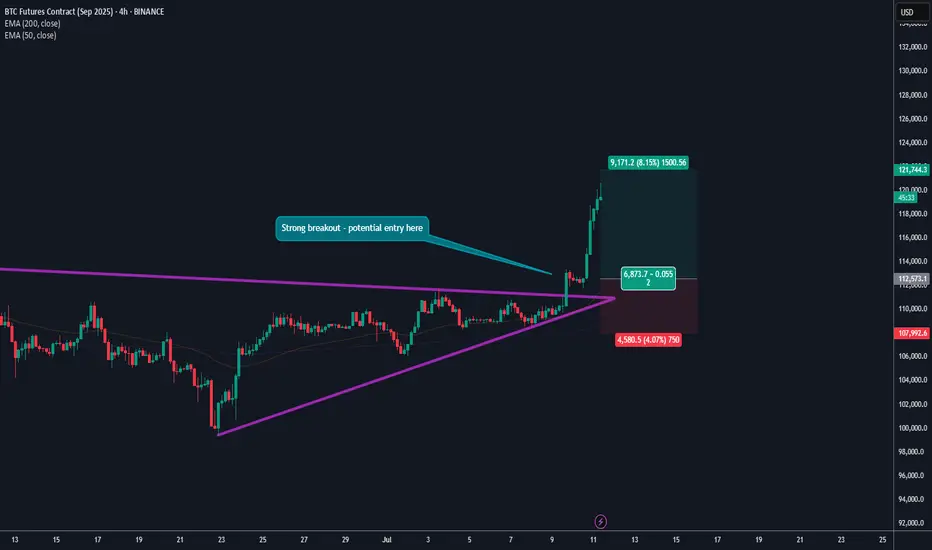
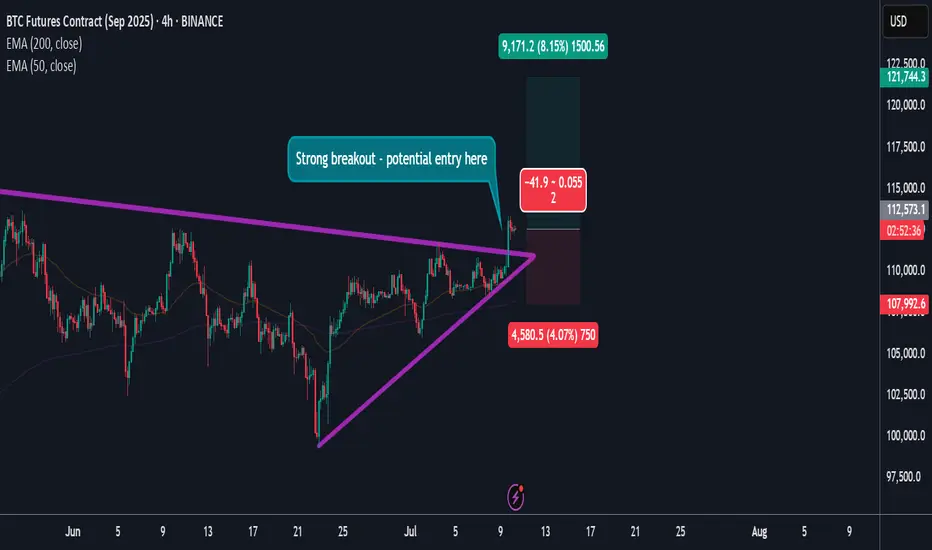
BTC Breakout OpportunityRecent BTC breakout.
Potential entry on 4h.
2:1 target with around 4% stop loss under recent low.
Higher risk as still under ATH. I would want to run some of this one.
i called the bottom and now im calling 150k BTC 150k BTC is coming in the near future.
we are seeing a nice breakout and we will test ATH yet again here. if we break ATH we will be going parabolic and the ALT season will begin!
hats on. pants clean. we are about to crap upwards in money printing
Strategy H2 2025. BTC Airless Plot Near $100'000 Choking PointOver the past 6 months, Bitcoin (BTC) has demonstrated a very mixed up/down performance, marked by significant price fluctuations, appreciation and volatility.
From late December 2024 to June 2025, BTC's price rose from approximately $92,000 to around $108,000, representing a gain of about 17.26% o

Bitcoin UpdateWe’re back looking at the #Bitcoin chart. While BTC stays above the 55-day MA (currently at 101,116), we remain overall bullish. But here’s the catch:
🔍 What I’m watching:
• The MACD is still below zero — no clear buy signal yet.
• The RSI is encouraging (above 50), but…
• 📉 No surge in volume = cau

See all ideas
Summarizing what the indicators are suggesting.
Oscillators
Neutral
SellBuy
Strong sellStrong buy
Strong sellSellNeutralBuyStrong buy
Oscillators
Neutral
SellBuy
Strong sellStrong buy
Strong sellSellNeutralBuyStrong buy
Summary
Neutral
SellBuy
Strong sellStrong buy
Strong sellSellNeutralBuyStrong buy
Summary
Neutral
SellBuy
Strong sellStrong buy
Strong sellSellNeutralBuyStrong buy
Summary
Neutral
SellBuy
Strong sellStrong buy
Strong sellSellNeutralBuyStrong buy
Moving Averages
Neutral
SellBuy
Strong sellStrong buy
Strong sellSellNeutralBuyStrong buy
Moving Averages
Neutral
SellBuy
Strong sellStrong buy
Strong sellSellNeutralBuyStrong buy
Displays a symbol's price movements over previous years to identify recurring trends.
Frequently Asked Questions
The current price of BTCUSD Futures Contract is 120,095.9 USD — it has risen 0.85% in the past 24 hours. Watch BTCUSD Futures Contract price in more detail on the chart.
The volume of BTCUSD Futures Contract is 22.34 M. Track more important stats on the BTCUSD Futures Contract chart.
The nearest expiration date for BTCUSD Futures Contract is Jul 18, 2025.
Traders prefer to sell futures contracts when they've already made money on the investment, but still have plenty of time left before the expiration date. Thus, many consider it a good option to sell BTCUSD Futures Contract before Jul 18, 2025.
Buying or selling futures contracts depends on many factors: season, underlying commodity, your own trading strategy. So mostly it's up to you, but if you look for some certain calculations to take into account, you can study technical analysis for BTCUSD Futures Contract. Today its technical rating is buy, but remember that market conditions change all the time, so it's always crucial to do your own research. See more of BTCUSD Futures Contract technicals for a more comprehensive analysis.