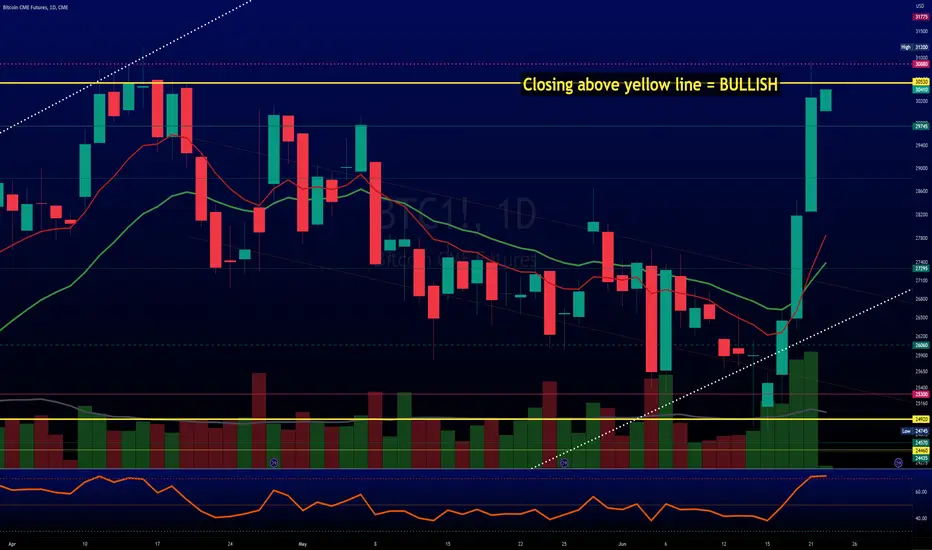
$BTC holding steady, dissecting on intraday to see next moveGOOD MORNING!
CRYPTOCAP:BTC opened @ 30.7 & it is staying above that yellow SUPPORT line. This is good.
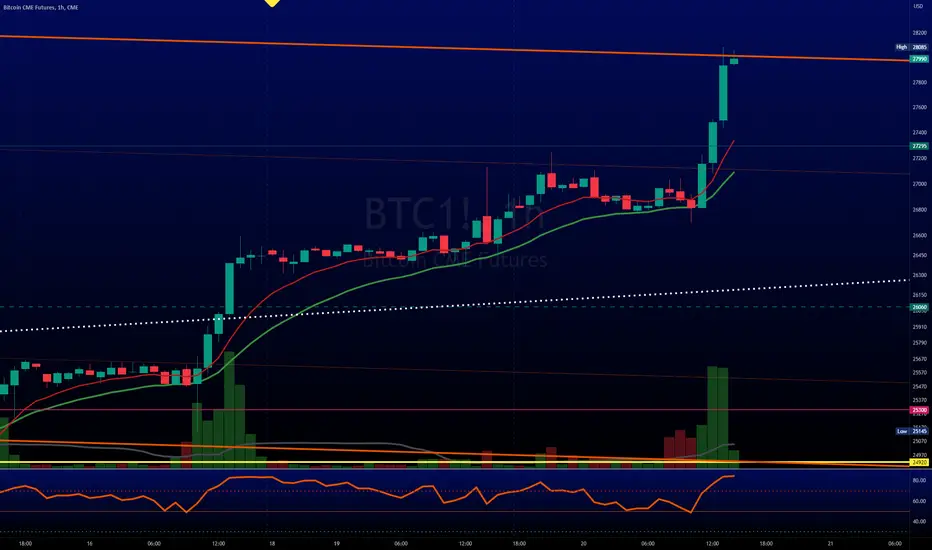
1HR chart shows a recent bearish crossover BUT it's fighting to crossover to the bullish side again.
We may see some #BTC weakness here BUT look @ the 4Hr chart. It still looks pretty strong. Hence, if there is any weakness it may be "weak".
:D
#bitcoin still has some momentum left as far as we see atm. But things can change fast.
BTCUSD18N2025 trade ideas

BTC again turning bullishBTC turning Bullish:
Bitcoin turning and creating higher low at this stage we can consider it bullish and take a long entry with small stoploss of previous swing low.

btc/usd144,000 region is a potential wave 5 target
would be a go run if that is achieved and that would usher in a very complex correct

Bitcoin CME Gap Chart Analysis: Two Significant Gaps to Watch#Bitcoin CME GAP Chart Analysis
- Current BTC Price: $31,120
- Continuous green candles since June 15th
Two unfilled CME gaps to watch:
1️⃣ First GAP: $35,180
Originated on May 9th, 2022
Price nearing this level
Potential for upcoming gap fill
2️⃣ Second GAP: $20,330
Represents 35% drop from current level
Unfilled, important to monitor
While gap fillings aren't guaranteed, these levels hold significance. $35,180 gap may fill before $20,330.
Placed Buy Bid: $30,330
Specific price for potential entry
Stay informed for trading decisions. Not all gaps fill, but monitoring provides insights.

More of why $BTC should still pumpWhy I'm still bullish on CRYPTOCAP:BTC
What do you see?
Look @ the previous highs, Now look at the RSI & Money Flow (showed here)
Highlighted it for you.
The RSI is STRONGER than it was @ previous high.
This = very good sign.
#Bitcoin Money Flow confirms this.
NOW, #BTC weekly needs to go higher, IMO it will.
#crypto

BTC $35,300 Hello everyone! Many of you have already noticed that the cryptocurrency market has been experiencing impressive growth recently.
I would like to draw your attention to some potential areas. In particular, I have identified a zone on the chart that has significant potential. It is the $35,300 level, where we can see an open gap. Considering past trends, this situation could contribute to further price growth.
Additionally, it's worth being attentive and observing the dominance of BTC if you are waiting for altcoins to take off.

BTC proving to have legsNASDAQ:COIN Coinbase fud is dead.
CRYPTOCAP:BTC held 25k nicely.
One of the few accounts stating this time was DIFFERENT.
#BTC new 2023 high atm.
#Bitcoin more than likely going higher.
Now you know why we said NOT good to have taken so many profits, yes 2x & some were more but they would be much larger returns now.
Buy volume is still there.
32k next resistance.
43k target for longer term.

Bitcoin Cup & Handle Bullish!CME:BTC1!
CRYPTOCAP:BTC has printed a massive Cup & Handle.
Also looks like an Inverse Head & Shoulders.
Idea tagged as Neutral, as I need to see more confirmation - read below:
Measured move to 48k over time.
Requires Break and Flip of the Breakout level around 31k.
Plan A: Long Break and Retest of 31.5k level - if you're a pro trader you can look for lower bounce ideas prior to the breakout - but gathering data every second.
Plan B: Short to Possible Pullback level and watch for hold of this support for next attempt or further downside to.
No Prediction - Preparation. When CRYPTOCAP:BTC moves we move.
Thanks for all the support from my followers!
Always having Plan A and Plan B scenarios so we can react once the markets provide an opportunity to execute our edge.
If you liked this idea or if you have your own opinion about it, write in the comments.
The information and publications are not meant to be, and do not constitute, financial, investment, trading, or other types of advice or recommendations.

$BTC has 2 choicesCRYPTOCAP:BTC still looks okay to me.
Outside that sell, volume seems to be 50 - 50 and on the lighter side. This is GOOD.
Now #BTC can do a few tings:
1 Safely trade sideways, not much downside, & then pump
2 Sell off to around the 28k area & then pump
Stated before that I am a believer of #1 until it breaks recent low, around 29,750.
#bitcoin

BTC - Profiler shows fresh-air Zone between 37740 and 32425Profiler shows a "fresh air zone" between 37740 and 32425.
These are areas where price moved by rapidly and created no support or resistance .
This also means that going the opposite way ( i.E upwards) there is also not much resistance .
There is also a CME gapfill within this area at 35k and I suspect CME may move price upwards and close this gap.

$BTC run has legs, we called previous bottom & steamCRYPTOCAP:BTC shorts piled on that rally but they QUICKLY covered that LOL
Wasn't that much in shorts anyway.
IMO #BTC has legs, strongest in some time.
Can we pause? Sure.
IMO = 2nd phase of a new bull market for #bitcoin.
Not saying it'll last 2 - 3 years but from lows, more than 2x.
See volume vs previous peak?
RSI looks okay as well.
Been calling tops & bottoms for over 2 years.
Bitcoin - CME gapsDoes all CME gaps get filled? I don't know, but almost all the gaps in 2020/2021/2022 got filled.
Now we have a few gaps left on the chart. Not hoping that this will happen because my target low is 13/14k, but there is always a possible swift move to 9k scenario.
Macro conditions can change quite suddenly.
Always stay safe.

BTC:Watch BTC here. Golden Cross lined up.
Should see some Gap up moves.
Not too often a bank fails based on their 10yr bond exposure. another bail out.
BTC almost out the valley.
Check out the last time the 50day moving average was above the 100 Day was September 2021.
Price is lower and has had significant time at consolidation levels.

$BTC hit first level called. Altcoins next?"I believe all" influencers had 27k target for $BTC.
Even posted on some of them that it WAS NOT the target.
DAYS ago we said 28K was the #BTC target for #futures.
Spot #bitcoin shows a lil extra room but IMO Futures dictate price, limit lil over 28k = 80%+, took it. (talking about the leveraged positions took few days ago (see profile for more info).
BIST:LINK (up 10%+) & CRYPTOCAP:LTC (25%+) moving, as is most #crypto.
$BTC looks good. Another $ call on direction. What now?CRYPTOCAP:BTC is PUSHING over 1k at the moment.
#bitcoin volume is HEALTHY as well.
We called the short term top BEFORE it happened.
We called "bottom" BEFORE it happened.
28k is going to be tough but in my opinion it will eventually break.
Also said CRYPTOCAP:ETH was waking up. Moving a bit last couple days.
For some time stated that #altcoins looked weak. BEFORE all the fud.
That's why, PERSONALLY, been doing mostly leveraged #BTC & #memecoins.

Bitcoin : The bulls in controll again ?After i published an analysis on bitcoin lately and the possibility of visiting that green zone arround 24k $ before going up again, that made a huge polarity line opportunity right there as the market is leaving the green zone to face 30k level again. also as statted before on the 3 months timeframe, bitcoin is bullish on the long run and going back to ATH wont be that easy and fast, however, now it is clear that on midterm vision, new investors are getting involved in the move, is it part of a bigger correction ? if the level of 30k is left behind this time, this would rarely be considered as a correction, claiming a wall of worry instead !

Daily Bitcoin Analysis - Long-Term PerspectiveWhen examining the daily timeframe, it becomes evident that a bearish structure has been in place since the rejection at 31.1k on April 14th. We can observe a consistent pattern of lower highs and lower lows, with another rejection occurring around the local resistance level of 29.1k - 28.2k on May 30th.
The resistance from the previous timeframe at 27.1k - 27.7k will likely keep the price suppressed, as breaking above the 29k mark is necessary to establish a clean daily break of the bearish structure.
Even if there is a rejection around 28.8k, which might initially seem bullish, it would still fall within the current bearish structure as a lower high. This would likely be followed by a lower low, dipping below the main support and resistance level at 25.2k - 24.4k.
Should the price movement go below 24.4k, the aforementioned support and resistance level would revert to becoming the main resistance. This would potentially make the CME Gap from March at 21.1k - 20.3k an enticing target for filling.
In summary, breaking above the local resistance at 29.1k is necessary to establish a bullish structure. Any levels below this mark are still considered part of the bearish structure. A retracement towards 24.4k is likely, which will be the primary level to hold. A breakdown below this level would create a new trading range between 25.2k - 20.3k.
Please note that cryptocurrency markets are highly volatile and subject to rapid changes. It's important to monitor the market closely and consider multiple factors before making any trading decisions

Association of small and medium crypto exchanges in South Korea On June 20th, the Korean Virtual Assets Exchange Association (VXA) announced on the 20th that it has sent 12 domestic commercial banks, local banks, and online banks that have not signed real-name deposit and withdrawal account contracts with virtual asset exchanges. The due diligence application for signing the real-name account contract was completed. The request includes a request to investigate real-name account contracts with virtual currency exchanges to ensure fair trade order and expand consumer rights.

Amazing BTC Futures run to close out last Fridays actionCME:BTC1!
Once the 1H triggers, time to scalp the lower TimeFrames...
Amazing entry Long on the BTC futures....
Ready for this upcoming week?
Trade well...

BTC Long, Market Shift? Volatility expectedMinor update to the previous idea.
BlackRock BTC Trust could change things, makes me wonder if they change their mind on whether it's ESG compliant.
This trade is more of a double-edged sword that is more profitable in longing for volatility rather than direction considering market forces at the moment. Expect at least a +- 20% price swing. Either we break through the first resistance band of 27k-32k and continue forward with a close above 26k today, or we drop to close the previous gap from 21.8k -20.8k with a close never reaching over 27.4k.
For now, we are at risk of seeing 20k considering current prices are under 27.4k and the sp500 being this overbought in the short term that could drag btc with it if a bull trap is in place in tradFi (not confirmed yet, mean rev. signals won't work). Overall, I'm bullish on BTC short term (possible that it could make a run up before sp500 contracts), and still remain bearish on SP500 long term (might switch to neutral if the west releases dependence on its manufacturing base toward China/the east, and innovation continues in the tech sector). Altcoins might not be able to catch up with BTC on the upswing, but most likely on the downswing if it so happens.
Trades:
Long #1
Entry: 26k
SL: 24k
TP: 34.5k, 40k
Long #2
Entry:20k
SL:18k
TP: 34k, 40k
Short
Entry: 26k
SL: 29k
TP:22k, 21k, 19k

Bitcoin intraday looks VERY GOOD!!!Super BULLISH for $BTC!!!!!!!
1Hr & 4Hr show very GOOD VOLUME.
Shorts still piling on & #BTC just keeps going higher.
This is VERY GOOD IMO!
#bitcoin could get to 28K!
Return would be 12% from buy zone (@ 10X Lev).
To get ton more data & frequent check our profile.
#crypto

$BTC showing great resolve atmGREAT NEWS for $BTC!
#BTC buy volume came in on that dip a few minutes ago
(Looks like shorts were part of that - they could be hurting soon if they don't cover)
Intraday the "long term" down trend is still there BUT now is a good a chance as any for it to end.
Furthermore, #bitcoin daily broke up trend. HOWEVER, weekly, depending on where we close today it can stay intact.
#crypto

Wait for the gap to fill then LONG it (i.e. time to SHORT now)Simple and straight forward. Wait till the CME futures gap is filled (around 20k), then long the crap out of btc.
In the meantime feel free to short it!! Just be careful, actual btc may not drop as low while futures may do a very quick dip to 20k area before bouncing hard. Close to bottom is better than exact bottom of the dip.
Cheers!
