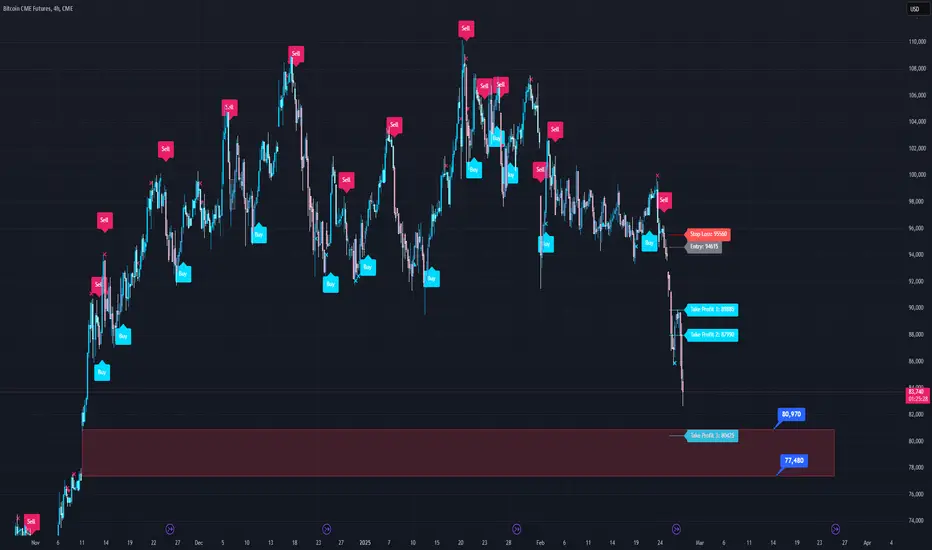
Bitcoin Futures CME - Short Trade Caution as FOMC meeting later tonight but price has been pushed higher this morning on lower liquidity and overall crypto sentiment is not great . High probability reversal from recent areas of strong activity and a Fibonacci area of the most recent move .
Sell 84100
Stop 85250
Target 82500
E
BTCUSD18N2025 trade ideas

LTF style bitcoin analysisIt seems that Bitcoin needs to complete the remaining orders in $61,000 to $64,000 to become bullish, until reaching that price range, you will be in a downward channel.

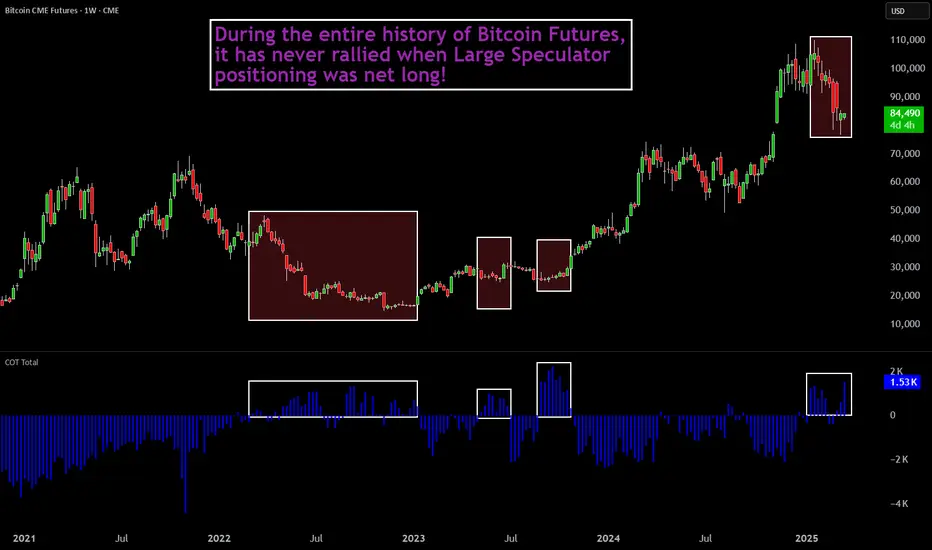
Large Speculators Bet on Bitcoin RallyWe published this chart a few months back noting that Bitcoin has never rallied while Large Speculators were net-long in Bitcoin futures and that streak continues this month as they remain net-long. This past week, Large Speculators actually increased their net-long positions by a lot as Bitcoin continues to struggle and near 2025 lows. This will be a good experiment to watch and see where Bitcoin goes from here and how it impacts positioning.
Some may say that Bitcoin futures is a small part of the BTC world and does not represent the entire trader population. Which may be true, but so far the COT data has done well identifying the reward/risk potential in Bitcoin. I have always said that COT data is not a great predictor of direction, but it sure does help you manage risk by knowing which side is crowded.
Bitcoin CME Gap at $77,930 Filled! Now, can $BTC push to $150K?Bitcoin CME Gap at $77,930 Filled! Now, can CRYPTOCAP:BTC push to $150K? 🚀
🔹 Support Level: $75,000 – If it holds, #BTC may target $100K+
🔻 If support breaks, my spot bids: $72K | $69K | $66K (Already filled at $77K ✅)
This drop was a liquidity flush to shake out high leverage traders. Stay prepared!
📢 Where’s your next buy order? Share below! 👇
#Bitcoin

Appetite For Risk Through the Lens of Nasdaq and BitcoinBitcoin tends to track Wall Street sentiment well, particularly compared to the Nasdaq. Growing concerns that Trump's policies will tip the US (and therefore the global economy) into a recession, which currently has the Nasdaq on the ropes and bitcoin getting dragged along for the ride. And there could be further losses to follow, though a cheeky bounce at a minimum could be due first.
Matt Simpson, Market Analyst and City Index and Forex.com

Bitcoin CME GAP Update
Don't forget panda fam that still there's a GAP at 82370 - 85920 range area keylevel currently filled by 50%.
Possible next scenario on bitcoin confluence with the CME GAP will be CME GAP filling above then continuation drop in worst case scenario since our H4 to Daily Timeframe is on clear bearish bias. 🐻
Bullish case scenario, If we manage to bounce and stay above on LAST MINOR S&R KEYLEVEL and will create a new swing for reversal sign then possibly we can test the recent Major PBr at 96k. 🐂

CME GapBitcoin is on its rally to fill the old big CME GAP. But on its way it created a new one at 93.000
Lets hope that this one gets filled quickly
Is the U.S. building a crypto reserve?The United States (U.S.) is no longer just a bitcoin holder – it may be laying the groundwork for a national crypto reserve. Is this the moment bitcoin goes fully mainstream?
Strategic bitcoin accumulation?
Recent estimates suggest that the U.S. government is sitting on 200,000+ bitcoins – over $13 billion worth – mostly seized from criminal operators such as the Silk Road1. That stash makes Uncle Sam one of the largest bitcoin holders in the world. But here is the real question: what is the endgame?
Historically, seized bitcoin was auctioned off at deep discounts, flooding the market with sell pressure. This time, however, President Donald Trump’s latest executive order has put a halt to rapid liquidations, signalling a strategic shift. Instead of fire sales, the U.S. government is deliberately holding onto its bitcoin, driving speculation about a potential long-term reserve strategy.
Is this merely a temporary pause, or the first step toward establishing a full-fledged crypto reserve? While the executive order marks a clear change in approach, formally integrating bitcoin into the U.S. financial system would demand congressional approval, regulatory coordination, and a robust custody framework. The path forward is not just about policy – it is about power.
Digital gold for digital age
Crypto is not just a speculative asset anymore – it is a strategic economic lever in global power dynamics. With the U.S. dollar facing growing pressure from alternative currencies and central bank digital currencies (CBDCs), bitcoin’s appeal as a neutral, hard asset is undeniable.
Unlike traditional assets, bitcoin cannot be printed, seized by sanctions, or easily manipulated. If the U.S. sees what other nations are beginning to recognise – that bitcoin is the 21st century version of gold – it may rethink its role as a long-term reserve asset.
The conversation around crypto is no longer confined to industry circles. President Donald Trump recently issued an executive order officially recognising bitcoin as a strategic reserve asset, marking a significant policy shift. This move has sparked widespread discussion about the future role of digital assets in national reserves.
Further reinforcing this shift, the White House is set to host a Crypto Summit on March 7, where top policymakers and industry leaders will discuss digital assets. While details are scarce, this could be the first step toward formal integration of crypto into U.S. financial policy.
Meanwhile, the Federal Reserve has remained largely silent, leaving questions about its stance on bitcoin’s role in national monetary policy. Will the central bank embrace digital assets, or will it resist this historic shift?
What would it take to make it official?
Turning bitcoin into a recognised U.S. reserve asset is not just a simple executive order. It would require:
Congressional approval to classify bitcoin and other cryptocurrencies as strategic reserves.
Regulatory coordination between the Securities and Exchange Commission (SEC), Commodity Futures Trading Commission (CFTC), Federal Reserve, and Treasury.
A secure custody framework to manage holdings without risking security breaches or market instability.
A phased rollout – starting with bitcoin before expanding to other cryptocurrencies or beginning with small holdings before gradually increasing them.
This would not happen overnight. A realistic timeline? Years, not months. Expect feasibility studies, pilot programs, and intense political battles before crypto earns a seat next to gold in the U.S. balance sheet.
Market shockwaves
If the U.S. openly adopts bitcoin as a reserve asset, expect seismic shifts in global markets:
Sovereign bitcoin FOMO2 – other nations would likely follow suit, sparking a global race to accumulate bitcoin.
Institutional confidence surge – a U.S. endorsement would cement bitcoin’s status as digital gold, driving massive institutional inflows.
Reduced sell pressure – unlike past cycles of seized bitcoin dumps, retention would tighten supply and bolster price stability.
If this trend accelerates, we could be looking at a fundamental shift in the financial system – one where bitcoin plays a central role in sovereign wealth strategies. The question is not if, but when and how fast governments will adapt to this new reality.
The bottom line
With the world’s largest economy holding one of the biggest bitcoin reserves, the question is not just about policy – it is about power. Will this be the turning point where bitcoin cements itself as the next global reserve currency?
1 US Government Bitcoin Holdings, Bitcoin Treasuries by BiTBO (treasuries.bitbo.io)
2 FOMO = fear of missing out.

BTC1!77K BTC1! gap filled. Liking this spot for a bounce, perhaps up to unfilled gap at 86K for starters.

CME Gap Filled The CME Gap from back in November has been filled finally. How much lower will Bitcoin be going now? My guess would be that we'll be having at least one Big dip to flush out all the leverage longs and bring panic to all the newbies before we can start going back up.

BTC Bullish ScenarioForgive my crude analysis of the waves displayed but this is how I see it. Assuming that the top is in for BTC, an ABC correction is expected. A wave would most likely take us to 68k - 70k region, B wave pullback to around 85k - 90k region and a C wave towards the Legendary Trading Zone around 43k. Trading below 43k means a cryptobubble is on the way, same way with the traditional stock market. Holding 43k level would validate a bullish scenario towards 200k area as Institutions/Whales want a cheaper price for BTC... That ABC correction follows a harmonic pattern as ABCD bullish scenario that would take us to the next wave of this supercycle...

Long trade MBT1
Wed 5th Mar 25
2.00pm
NY Session PM
Micro BIT-Futures
Buyside trade
Entry 90215
Profit level 91660
Stop level 89930
RR 5.07
Observed on the 1min TF
Reason: Using fib levels to mitigate price range and directional bias observed on the 1min TF seemed indicative of a buyside trade.

$BTC1! Price reaching interesting support of a GAP from November - December 2024.
Indicators decreasing and looking for an oversold zone.
Price looking for a strong support zone on this area, before reaching the target on the chartist rate figure... .
If this theory is confirmed, we can support our monthly chart.

Do you think this has an upside right now?I'm sorry, no. I don't think so. This looks bad. This looks so very, very bad. Not good. Bad. Really really bad. The worst.
$68190 is where I'll be.
Happy trails!
CRYPTO:BTCUSD CME:BTC1! COINBASE:BTIH2025 COINBASE:BITH2025

Bitcoin 10X Trade-Numbers (1,375% Potential)The low is in and this is the perfect timing for a long-term LONG on Bitcoin (BTCUSDT and other trading pairs).
This is for experienced traders and can end up producing huge profits, great growth, amazing results —great entry timing.
__
LONG BTCUSDT
Leverage: 10X
Entry levels:
1) $85,000
2) $83,000
3) $81,000
3) $78,000
Targets:
1) $94,810
2) $98,804
3) $101,058
4) $104,266
5) $108,353
6) $112,859
7) $115,648
8) $120,154
9) $132,643
10) $139,250
11) $158,347
12) $165,345
13) $189,212
14) $200,000
Stop-loss:
Close monthly below $78,000
Potential profits: 1375%
Capital allocation: 5%
____
Thanks a lot for your continued support.
Namaste.

BTC CME Gap PlayoutWell, here we go again—another CME gap filled like clockwork. On Friday, BTC closed at $85.7K on CME, only to open on Monday with a big jump at $94.5K, leaving a massive weekend gap. And what happened next? Within the next 24 hours, the price fully covered the gap, even dropping further down to $82.8K before stabilizing.
🔹 Statistics
Historically, these gaps have shown a high tendency to be filled, with studies indicating that approximately 95% of CME gaps eventually close.
🔹 Why does this happen?
CME gaps occur because the Bitcoin futures market on CME is closed during weekends, while crypto trades 24/7. When CME reopens on Monday, price often corrects to “fill” the gap left between Friday’s close and Monday’s open.
🔹 What’s next?
Now that the gap is filled, we’ll have to see if bulls can regain momentum or if we get another leg down before continuation. Watching the next key levels!
Stay sharp!

LONG BTCAfter price conslidated and created sell side LQ, price has sold to grab that liquidity and fill a large imbalance on the weekly. After said move price has given a 4H MSS and price has tapped into the imbalance left behind.

$BTC Futures FractalTaking a closer look at BTC CME chart in late 2020, after a high of $14,000 Bitcoin Futures corrected and rallied back up (with a gap) to $12,000. After another 21% correction (almost closing the gap) we started to rally to all time high. Looking at the current chart today we have a very similar set up.
From a major correction, and then a rally (Gap up) we have closed the gap. If the timing is exactly the same... (unlikely).., well see another rally to new all time highs.
First target is still $130,000.

BTC update#BTC in CME charts always fills its gaps and you can see that this time it happened again i think that now all the gaps are filled so we can expect the BTC to continue its normal way just check out my last analysis on these gaps

Bitcoin CME Gaps Wars UPDATEThat Gap that opened up so quickly over the weekemd...Nearly Full
I cannot wait to see which direction PA goes when we hit the Bottom of the Gap at around 85700
On a Short tem, PA has hit Support..........All eyes on the Gap

$BTC CME Futures Gap - Market Makers Flash Crash to FillI don't think I've ever seen market makers try to fill a CME Gap this fast in the history of CRYPTOCAP:BTC Futures.
I wonder WHY they want to fill it so fast 🧐
HODL ✊

Bitcoin CME GapThe good news: The #Bitcoin gap is nearly filled.
The bad news: This entire pump-and-dump was just another golden opportunity for the wealthy to profit while everyday investors took the hit once again.

Bitcoin: A US Reserve CurrencyCME: Micro Bitcoin Futures ( CME:MBT1! )
On the morning of March 2nd, President Donald Trump posted a tweet to reinforce his commitment to a Crypto Strategic Reserve, including XRP, SOL and ADA.
Cryptocurrency market took off immediately. Despite not being mentioned in the tweet, Bitcoin shot up from $78,400 to $83,900, and Ethereum from $2,090 to $2,240.
Later in the afternoon, President Trump posted an update and clarified that BTC and ETH will be in the Reserve. “I also love Bitcoin and Ethereum!”, he tweeted.
At the time of this writing, BTC is quoted $94,308, up 20.3% since the first tweet. ETH is trading at $2,520, up 20.6% within the day.
We are in a new age of cryptocurrencies, where BTC, ETH, XRP, SOL and ADA just gained the official backing of the US Government. This day has been in the making for months.
• On May 24, 2024, then presidential candidate Trump promised to launch a national crypto stockpile if he wins the election. Investors warmed to this idea and Bitcoin lifted 18%
• On November 5, 2024, Trump won the US election. Market cheered for the most pro-crypto president and Bitcoin shot up 57% in a month
• On January 23, 2025, President Trump signed the “Executive Order to establish United States leadership on digital financial technology.” Bitcoin went up 17%
• Recent events have brought bitcoin down 28% since reaching its all-time-high of $109,241. In a matter of two tweets, the crypto market has completely turned around
Bitcoin for the Long Haul
A year ago, I published this market commentary, “A Bitcoin Bull Run?”, and laid out the key drivers for bitcoin’s long-term rise.
Limited supply, increased demand and excessive liquidity helped bitcoin prices doubled in a year. In my opinion, these tailwinds remains intact for bitcoin in the coming months. On top of these, we now have the explicit endorsement from a sitting US president. Therefore, I stay bullish for holding bitcoin for the long haul.
Trading with Micro Bitcoin Futures
On “HODL with a Twist”, published on May 6, 2024, I explored using Futures Rollover strategy to invest in CME Micro Bitcoin Futures ( LSE:MBT ). This strategy worked nicely in the past, and I favor to continue deploying it. The paragraphs below provide a brief update with new contract months and new price data.
Firstly, using futures over spot bitcoin provides these compelling advantages:
• Capital efficiency in using margins. A trader could invest with as little as $2,075 to take on the full exposure of $9,431 (1/10th of a bitcoin)
• Futures contracts come with build-in leverage. For MBT, it is approximately 4.5 times (= 9431/2075). If bitcoin moves 10% in your favor, you could gain 45% with futures
• Price protection. MBT has a daily price limit (limit-up and limit-down) at 10%. In a volatile day with big moves, the Exchange will pause trading at the prescribed limits
Secondly, futures contracts have a limited lifespan that will influence the outcome of your trades and exit strategy. Micro Bitcoin futures are traded actively in the nearby March and April contracts. Liquidity in the back-month contracts has yet to pick up.
Rollover is when a trader moves his position from the front month contract to another contract further in the future, prior to the expiration of his existing holding.
Below is an illustration on how to hold a long MBT position overtime:
• In March, a trader buys (going long) April contract (MBTJ5) at $94,308
• In April, the trader enters an offsetting trade, going short on MBTJ5, to close his existing position. He would book a profit or loss, determined by the difference in selling price and purchasing price
• Simultaneously, the trader would buy May MBT contract (MBTK5) and re-establish a long position in Bitcoin
• In May, the trader will close out MBTK5 (going short) and buy June (MBTM5)
• The trader would repeat the above steps, so far as he holds a bullish view
Finally, Bitcoin prices are extremely volatile. Holding spot Bitcoin with no leverage could face potential drawdown of 70%-80%. With the leverage in futures, a sharp price move in the wrong direction could quickly deplete the available fund and trigger margin calls.
Trader could set up a stop-loss in the buy order, limiting the maximum loss. Hypothetically, he could set the stop-loss at $85,000 when executing long futures at $94,308. If bitcoin moves sharply down, the maximum loss will be $931 (= (94308-85000)*0.1). His margin account will be decreased to $1,144 from $2,075.
To learn more about all the Micro futures and options contracts traded on CME Group platform, you can check out the following site:
www.cmegroup.com
Happy Trading.
Disclaimers
*Trade ideas cited above are for illustration only, as an integral part of a case study to demonstrate the fundamental concepts in risk management under the market scenarios being discussed. They shall not be construed as investment recommendations or advice. Nor are they used to promote any specific products, or services.
CME Real-time Market Data help identify trading set-ups and express my market views. If you have futures in your trading portfolio, you can check out on CME Group data plans available that suit your trading needs www.tradingview.com
